Summary:
- Eli Lilly’s financial results for Q4 2023 showed a 28% increase in total revenue compared to the same period last year.
- The company’s new launch, Zepbound, is expected to drive sales growth in 2024 and contribute to a projected revenue growth of 18-22%.
- Eli Lilly’s gross margin and net margin indicate a potential durable competitive advantage compared to its peers in the healthcare sector.
NurPhoto/NurPhoto via Getty Images
My Thesis
My investment thesis and outlook for Eli Lilly (NYSE:LLY) is based on the dissonance between quantitative valuation metrics and the current share price. The growth expected by the market by analysts is also not properly parameterized for the stock. This takes us into a highly speculative zone.
Therefore, the only reasonable justification for such expensive valuations is the belief that Revenue in 2024 will be substantially increased from the new drugs recently approved by regulators – Zepbound, Ebglyss (only on EU), Omvoh and Jaypirca, in addition to Mounjaro’s resilience.
In this way, a substantial increase in revenue is already being priced, combined with the parameterization already observed by analysts, resulting in a larger net profit. However, this expectation is already reflected in the company’s current share price.
Any deviation from expected results, which have already been carefully considered by analysts, has the potential to result in a drop in share value. This does not meet the expectations of value investors, who look for opportunities where the share price does not fully reflect its true growth potential. This is expressed when considering Eli Lilly’s current projections and share price, any growth rate (g) below approximately 35% can be considered undervalued according to the company’s valuation standards.
Market Expectations
The quantification of future net profit and future free cash flows will be subject to individual analysis. However, because analysis of future events is inherently speculative, different individuals will consider different variables and metrics. Even if the market is efficient with respect to past events, future events cannot be completely priced by the market.
For this reason, it is always useful to analyze the market’s level of “surprise” in relation to the asset, this way, we can find possible inaccuracies by analysts in relation to the asset.
Let’s analyze Eli Lilly’s fourth quarter results in light of market expectations:
Market expectations/ Reported by Lilly (Author)
The market surprise regarding total revenue for the fourth quarter was 4.7%, an increase of 28% compared to the same period last year. In relation to EPS it was 12.16%. It is important to remember that the EPS of $2.49 does not consider the one-time items associated with the value of intangible assets.
Despite Mounjaro’s success throughout the calendar year, we do not have enough data to further evaluate the other drugs approved this year. We require an upcoming reading of the coming quarters to observe how this demand will behave with the accommodative conditions in a “higher for longer” scenario.
‘Forward Guidance’ – how does the company project its growth for 2024?
Eli Lilly is highly confident in its new products and its ability to drive sales growth as reported in 2023. But how does the company plan to achieve the growth predicted by the guidance? The answer to this question lies in its new launch, recently approved by the FDA.
Especially with your new release, called Zepbound, is a product made from tirzepatide, which was already used to treat type 2 diabetes under the trade name Mounjaro. In November 2023, the FDA approved the sale of tirzepatide for the treatment of obesity.
We are looking for long-term trends, so we have to be realistic and agree that, in the medium/long term, sedentarization, the result of a continuous process of technological development, naturally results in the material condition of an increase in the average weight of the population, mainly in developed countries, therefore, the demand for this type of drug will tend to follow an upward pattern.
The products that are making Lilly’s Revenue increase (Eli Lilly )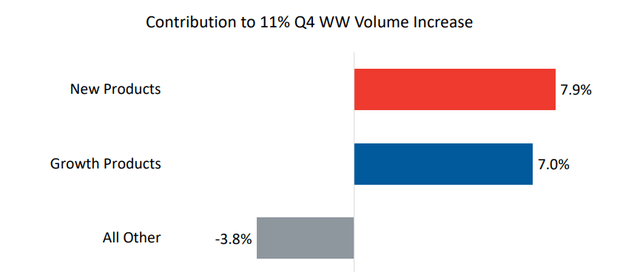
Eli Lilly’s sales growth in the fourth quarter was directly influenced by new products, recently approved by several regulatory agencies, which should boost revenue growth in the coming years.
Here are the products that Eli Lilly says drove sales growth in the fourth quarter, many of which have recently received approval from regulatory agencies. It is important to highlight that, for a pharmaceutical company, granting licenses is one of the crucial steps, as once the medicine is developed, research and development costs decrease and the company can focus on improving production efficiency:
- Ebglyss: approved in November by the European Commission for the treatment of atopic dermatitis;
- Jaypirca: approved in December by the FDA for the treatment of chronic lymphocytic leukemia;
- Zepbound: FDA approved in November for weight loss;
- Omvoh: approved by the FDA in October for the treatment of Ulcerative Colitis.
The company projects revenue of $40.4 billion to $41.6 billion for the year 2024. Compared to reported revenue for 2023, which was $34.124 billion, we note that Eli Lilly forecasts growth of 18% 22% from one year to the next. This projection exceeds the growth demonstrated from 2022 to 2023, but is in line with annual growth, except for the stagnation in revenue observed from 2021 to 2022.
Regarding EPS, the company aims to achieve a result 73% higher than that presented in 2022, reaching approximately $12.00 in earnings per share. As previously mentioned, for Eli Lilly to achieve this result in 2024, at least three of the following four conditions must be met:
- Eli Lilly must be able to adjust its COGS so that its marginal growth does not exceed its revenue growth. We observed an inconsistency in COGS during 2020 and 2021, where COGS CAGR became excessively large compared to the same revenue metric over the same period;
- To achieve the desired EPS, investment in R&D should not be parameterized according to the margins observed in the year 2023. Unless revenue growth is so large that an increase in R&D spending is comparatively smaller when using the respective margins;
- New drugs like Zepbound, Omvoh, Jaypirca are expected to perform exceptionally well to drive the company’s growth, approval of Ebglyss on US by mid-calendar year 2024 is quite desirable.
Lilly’s operations in accordance with its Income Statement
First, let’s analyze the trends reported in Eli Lilly’s Income Statement and format some metrics that we can use as a basis for comparison between its peers. Let’s look at Eli Lilly’s revenue over the last six years. In the following graph, I projected the year 2024 according to the company’s guidance:
Lilly’s revenue since 2018 (in billions) (Author)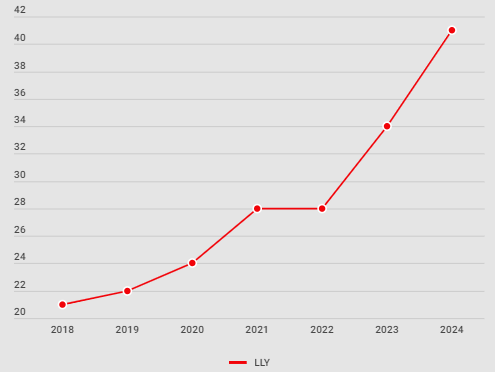
Eli Lilly has maintained sustained revenue growth year after year. This means that there is a demand for its products/services (either through effective market demand for the products it offers, or through leverage and the consequent realization of a temporary competitive advantage – we will see later).
We saw that the year-on-year Revenue growth (we are not talking about CAGR) for Lilly is approximately 9.69% while for the sector it is 6.36%. The projection for Lilly Revenue growth is 11.39%, while for the sector it is 9.33%.
It has an extremely high P/S (with a ratio of 19.83 compared to the industry median of 3.85, and Lilly’s own ratio of 8.86 five years ago. This implies a P/S approximately 415% higher than the industry average), this suggests that investors are willing to shell out a significantly higher amount for the company’s shares compared to its total revenue. In relation to competitors in the sector, this disparity may indicate a possible overvaluation of the company’s shares.
Gross Margin analysis will allow us to answer two fundamental questions for analyzing lasting competitive advantage, which are:
- If Eli Lilly has a narrow Gross Margin, it suggests that its production may not be efficient. In other words, the increase in COGS is outpacing the marginal increase in Revenue. This happens when costs increase at a greater rate than Revenue. If a company is not successful in controlling its margins due to cost pressure, it does not have a durable competitive advantage.
- If Eli Lilly has a narrow Gross Margin, this may suggest that, due to competition in the market, the company needs to reduce its margins to keep its Revenue stable. In other words, your pricing strategy must take into account other companies that offer cheaper products on the market. A company that constantly needs to reduce its margins due to pressure from other companies certainly does not have an intrinsic competitive advantage.
That said, let’s analyze the Gross Margin of Eli Lilly and its peers:
Gross Margins over years (Author)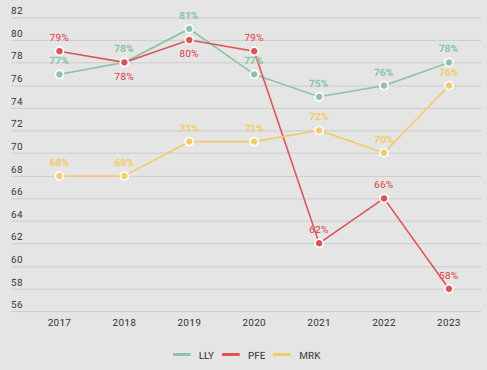
We then realized that the Gross Margin of Eli Lilly and Merck (MRK) point to lasting competitive advantages. Lilly presents fantastic numbers, with multiples constantly above 75% and varying up to 81%, Merck, despite presenting multiples slightly lower than Lilly, still presents solid numbers, constantly above 70%. Remember we talked about consistency? Well, the Lilly and Merck numbers are very consistent, follow a flat/rising pattern and indicate the predictability and malleability of the COGS and the strength of the Revenue.
Now for our analysis of SG&A expenses, the parameter we will use is: the smaller, the better. If the company keeps them constantly low, that is ideal. We will also consider the adaptability with which the company manages SG&A expenses. Finally, we will use the Buffettian benchmark to analyze this data in more depth.
Let’s graphically analyze the percentage that each company spends of its Gross Profit on SG&A:
Percentage of Gross Profit used in SG&A (Author)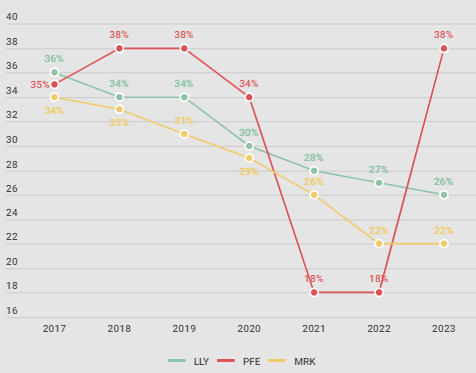
From the analysis of SG&A expenses on Gross Profit, we can infer that Eli Lilly has been prudent in managing SG&A. The expansion of their gross margins and the retraction in the SG&A/GP ratio indicate that both Lilly and Merck are not using SG&A leverage to expand their sales. This could indicate some kind of durable competitive advantage.
Using our ‘magic number’ that we use as a benchmark for SG&A spending on Gross Profit:
Using the benchmark to evaluate the average SG&A/Gross Profit (Author)
All companies have healthy SG&A/Gross Profit margins, despite the inconsistency observed in the Pfizer (PFE). However, when considering adaptability in our calculation, we can classify these companies in terms of SG&A expenses/Gross Profit in the following order: Merck > Lilly > Pfizer.
It is observed that the Net Profit of the companies analyzed does not present a defined trend, with Lilly remaining ‘stable’, but consistent. In Lilly’s case, despite the company demonstrating growing revenue and control over production costs and administrative expenses, it invests considerably in R&D. This ends up impacting Net Profit and, consequently, shareholder remuneration. However, when analyzing the Net Margin, we realize that Eli Lilly maintains a desirable consistency, despite not recording significant growth in Net Profit.
Valuation
After analyzing Eli Lilly’s operations, it’s time to bring our thesis to life. The question is: is the price in line with the company’s conditions and the growth prospects established by the market? We will use several valuation indicators to determine a fair price for Eli Lilly. Below I will explain why I consider the price to be high.
Lilly’s FCF is 4,174.5 billion. We calculate Lilly’s Cost of Equity using the formula Risk Free Rate + Beta x ERP. This cost is 7.99%. The Beta, which indicates the stock’s volatility relative to the market, is 0.85, while the current Risk-Free Rate, based on government bond yields, is 4.1%. The ERP, which measures the extra return over the risk-free rate demanded by investors, is 4.57%.
It is observed that even when using a growth (g) of 35%, the fair price of Eli Lilly would be $689.92. This is $50.76 less than the market value of the stock on the date of this analysis.
Lilly’s DCF Model using g=35% (Author)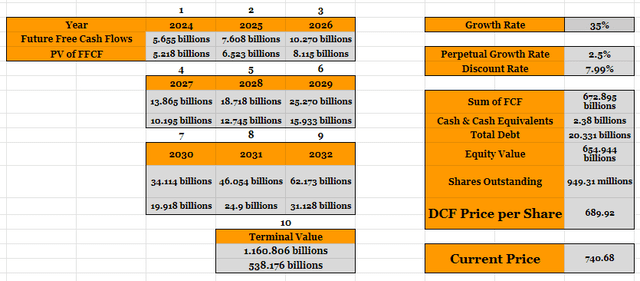
To justify my thesis, I carried out simulations in a scenario where I considered a growth rate (g) of 25%. In this scenario, the calculated fair price for Eli Lilly shares was $352. Therefore, any result weaker than continuous growth of an average of 35% will lead the company to an intrinsic value well below its current value. Let’s cover other interesting valuation metrics.
Eli Lilly under Graham Valuation Model (Author)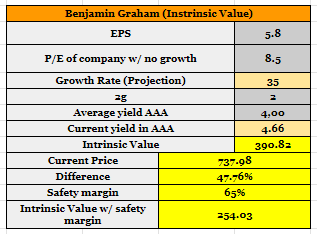
When we use Graham’s method, we have an intrinsic value of $390.82. This is 46.85% lower than the value of the stock. This dissonance becomes even more evident when we apply a safety margin, which varies from investor to investor, but as we can see in our model, it further demonstrates Lilly’s overpricing.
Lilly under Lynch’s Valuation Model (Author)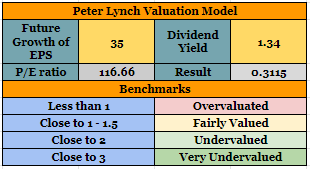
Here, I used Eli Lilly’s EPS growth forecast to average 35.8% over the next 5 fiscal years. It can be seen that according to Peter Lynch’s valuation model, the stock is highly overvalued, with a multiple of 0.3115.
Risks
Despite Mounjaro’s resilience, investors are pricing Eli Lilly in anticipation of a successful adaptation of new drugs to the market. Any setbacks in the post-approval regulatory process, unexpected regulatory hurdles or lower-than-anticipated market demand for these drugs could adversely affect revenue projections and, ultimately, the company’s stock price.
The analysis highlights an exaggerated optimism among market expectations for revenue growth. If this market sentiment, materialized in high expectations of revenue and EPS growth for the coming years, does not materialize with the same intensity as estimated, the market may perceive the dissonance between the share price and the estimated growth and that demonstrated phenomenally.
Other equity risks that we can identify in Eli Lilly’s Balance Sheet are related to its liquidity. In 2016, its Quick Ratio was 0.54 and has gradually deteriorated over time. In 2023, the same index showed 0.11. When we look at the increase in receivables, we realize that Eli Lilly may be adapting its sales policy, possibly extending payment terms to customers to boost sales or offering incentives to secure long-term contracts.
By extending terms and underlying deterioration in liquidity ratios, Lilly may run the risk of running out of cash to cover its operating expenses. When we add to this the increase in future interest rates and the withdrawal of liquidity due to contractionary monetary policy, we can predict some threats that Lilly’s management will have to deal with.
When we take into account the “manic-depressive” mentality of the market and its underlying exaggerations, we can take advantage of the right moment to “go shopping”. When this happens (if this happens) we can carry out other assessments based on conditions in the coming quarters, if it is below our intrinsic value we will update our rating.
Conclusion
I believe Lilly is overvalued, with a lot of speculation about the potential for revenue growth in the coming quarters, despite the fundamentals remaining solid.
For us investors, the only question that remains is whether the current share price is parameterized with the marginal increase in revenue for next year or whether there is some kind of widespread ‘euphoria’ in the market, which, in my opinion, is affecting the metrics of conventional valuation methods.
Although I believe that Eli Lilly can significantly increase its EPS, I consider that this marginal increase – and perhaps even a little more, as we have seen in our conventional valuation methods, is already reflected in the share price.
Following the value investor approach, I recommend a “Hold” on Eli Lilly, as intrinsically, the company has solid fundamentals and high growth potential, but appears to be overvalued by investors.
Analyst’s Disclosure: I/we have no stock, option or similar derivative position in any of the companies mentioned, and no plans to initiate any such positions within the next 72 hours. I wrote this article myself, and it expresses my own opinions. I am not receiving compensation for it (other than from Seeking Alpha). I have no business relationship with any company whose stock is mentioned in this article.
Seeking Alpha’s Disclosure: Past performance is no guarantee of future results. No recommendation or advice is being given as to whether any investment is suitable for a particular investor. Any views or opinions expressed above may not reflect those of Seeking Alpha as a whole. Seeking Alpha is not a licensed securities dealer, broker or US investment adviser or investment bank. Our analysts are third party authors that include both professional investors and individual investors who may not be licensed or certified by any institute or regulatory body.
