
Summary:
- Through the acquisition of stocks that provide you with dividend payments, you can generate an extra income for yourself.
- In this comparative analysis on Exxon Mobil and Chevron, I will show you which of these two companies I currently consider to be the better choice for dividend income investors.
- Exxon Mobil provides you with a Dividend Yield [FWD] of 3.48% while Chevron’s is 3.37%. Exxon Mobil’s Payout Ratio is slightly below the one of Chevron (27.69% compared to 32.37%).
- My DCF Model indicates an expected compound annual rate of return of 13% for Exxon Mobil and 9% for Chevron.
Brandon Bell/Getty Images News
Investment Thesis
Dividend income stocks provide you with an excellent opportunity to generate an additional income in the form of dividends. At the same time, this type of stock can help you to drive your main investment focus on the dividend instead of focusing too much on the ups and downs of the stock market in order to try to beat the market. Two companies that provide an attractive Dividend Yield and that I consider to be appealing in terms of risk and reward are Exxon Mobil (NYSE:XOM) and Chevron (NYSE:CVX).
In this analysis I will show you why I currently consider Exxon Mobil to be the slightly more attractive choice from the Integrated Oil and Gas Industry: Exxon Mobil’s Dividend Yield [FWD] of 3.48% is slightly above Chevron’s (3.37%). At the same time, the company’s Payout Ratio of 27.69% is lower than its competitor (Chevron’s is 32.37%). I also consider Exxon Mobil to be slightly more attractive when it comes to Valuation: my DCF Model indicates an expected compound annual rate of return of 13% for Exxon Mobil and 9% for Chevron, underlying my theory to consider Exxon Mobil as the currently more attractive choice between the two companies.
The Competitive Advantages of Exxon Mobil and Chevron
Both Exxon Mobil and Chevron have strong competitive advantages that contribute to the fact that they have managed to build a wide economic moat which prevents their competitors from entering the business field. Among the companies’ competitive advantages are their enormous financial strength, their economies of scale as well as their global product portfolio.
The companies’ financial strength is underlined by their Aa2 credit ratings by Moody’s. Exxon Mobil shows a Free Cash Flow Yield [TTM] of 13.39% while Chevron’s is currently 10.9%, which serves as an indicator that Exxon Mobil is currently the slightly more appealing option of the two.
Both companies possess large economies of scale.
Economies of scale are cost advantages that occur when a company raises its level of output. The cost advantages are a result of a lower per-unit fixed cost when increasing the quantity of output.
The economies of scale contribute to the fact that both Exxon Mobil and Chevron have competitive advantages over smaller competitors.
The companies’ global product portfolios also contribute to their strong competitive advantage over smaller competitors. In my in-depth analysis on Exxon Mobil, in which I showed why I consider Exxon Mobil to be a must have for dividend income investors, I discussed the company’s global and diversified product portfolio in more detail:
“Regarding its crude oil and natural gas liquids production, Exxon Mobil distinguishes among the following regions: United States, Canada/Other Americas, Europe, Africa, Asia and Australia/Oceania. While 36.96% is produced in the United States, 31.12% is produced in Asia, 18.48% in Africa and 9.97% in Canada/Other Americas. These numbers provide strong evidence for the global and broad diversified product portfolio, which gives Exxon Mobil an additional competitive advantage over its rivals.”
Exxon Mobil’s and Chevron’s strong competitive positions are underlined by their relatively high EBIT Margins of 16.07% (Exxon Mobil) and 16.27% (Chevron).
The Valuation of Exxon Mobil and Chevron
Discounted Cash Flow [DCF]-Model
I have used the DCF Model to determine the intrinsic value of both Exxon Mobil and Chevron. The method calculates a fair value of $121.34 for Exxon Mobil and $171.94 for Chevron.
At the current stock prices, this gives Exxon Mobil an upside of 15.6% and 1.1% for Chevron. My calculations are based on the following assumptions as presented below (in $ millions except per share items):
|
Exxon Mobil |
Chevron |
|
|
Company Ticker |
XOM |
CVX |
|
Tax Rate |
31.0% |
27.5% |
|
Discount Rate [WACC] |
8.75% |
8.75% |
|
Perpetual Growth Rate |
3% |
3% |
|
EV/EBITDA Multiple |
5.0x |
5.5x |
|
Current Price/Share |
$105.00 |
$170.00 |
|
Shares Outstanding |
4,168 |
1,934 |
|
Debt |
$46,883 |
$23,641 |
|
Cash |
$18,861 |
$15,431 |
|
Capex |
$14,677 |
$10,745 |
Source: The Author
Based on the above, I have calculated the following results:
Market Value vs. Intrinsic Value
|
Exxon Mobil |
Chevron |
|
|
Market Value |
$105.00 |
$170.00 |
|
Upside |
15.60% |
1.10% |
|
Intrinsic Value |
$121.34 |
$171.94 |
Source: The Author
Internal Rate of Return for Exxon Mobil
Below you can find the Internal Rate of Return as according to my DCF Model (when assuming different purchase prices for the Exxon Mobil stock).
At Exxon Mobil’s current stock price of $105, my DCF Model indicates an Internal Rate of Return of approximately 13% for the company.
|
Purchase Price of the Exxon Mobil Stock |
Internal Rate of Return as according to my DCF Model |
|
$95.00 |
16% |
|
$97.50 |
15% |
|
$100.00 |
15% |
|
$102.50 |
14% |
|
$105.00 |
13% |
|
$107.50 |
12% |
|
$110.00 |
12% |
|
$112.50 |
11% |
|
$115.00 |
10% |
Source: The Author
Internal Rate of Return for Chevron
At Chevron’s current stock price of $170, my DCF Model indicates an Internal Rate of Return of approximately 9% for the company. (In bold you can see the Internal Rate of Return for Chevron’s current stock price of $170.)
|
Purchase Price of the Chevron Stock |
Internal Rate of Return as according to my DCF Model |
|
$150.00 |
13% |
|
$155.00 |
12% |
|
$160.00 |
11% |
|
$165.00 |
10% |
|
$170.00 |
9% |
|
$175.00 |
8% |
|
$180.00 |
7% |
|
$185.00 |
7% |
|
$190.00 |
6% |
Source: The Author
The fact that my DCF Model shows a higher expected compound annual rate of return for Exxon Mobil when compared to Chevron, is another indicator that Exxon Mobil is currently the slightly more attractive choice.
Fundamentals: Exxon Mobil vs. Chevron
At the time of writing, Exxon Mobil shows the slightly more attractive Dividend Yield: it currently has a Dividend Yield [FWD] of 3.48%, while Chevron’s is 3.37%.
In addition to that, Exxon Mobil’s Payout Ratio of 27.69% is lower than the one of Chevron (32.37%), demonstrating that Exxon Mobil has slightly more room for future dividend increases compared to its competitor.
Exxon Mobil’s slightly higher Dividend Yield and lower Payout Ratio strengthens my belief that the company is currently the better choice for dividend income investors that aim to invest with a long investment horizon and that plan to benefit from the company’s steadily increasing dividend payments.
However, it should be mentioned that Chevron has shown a higher Dividend Growth Rate [CAGR] over the past 5 years (5.63% as compared to Exxon Mobil’s 3.02%). Furthermore, Chevron has shown 35 Consecutive Years of Dividend Growth while Exxon Mobil has produced just 20. Below you can find an overview concerning the dividend of both companies.
Source: Seeking Alpha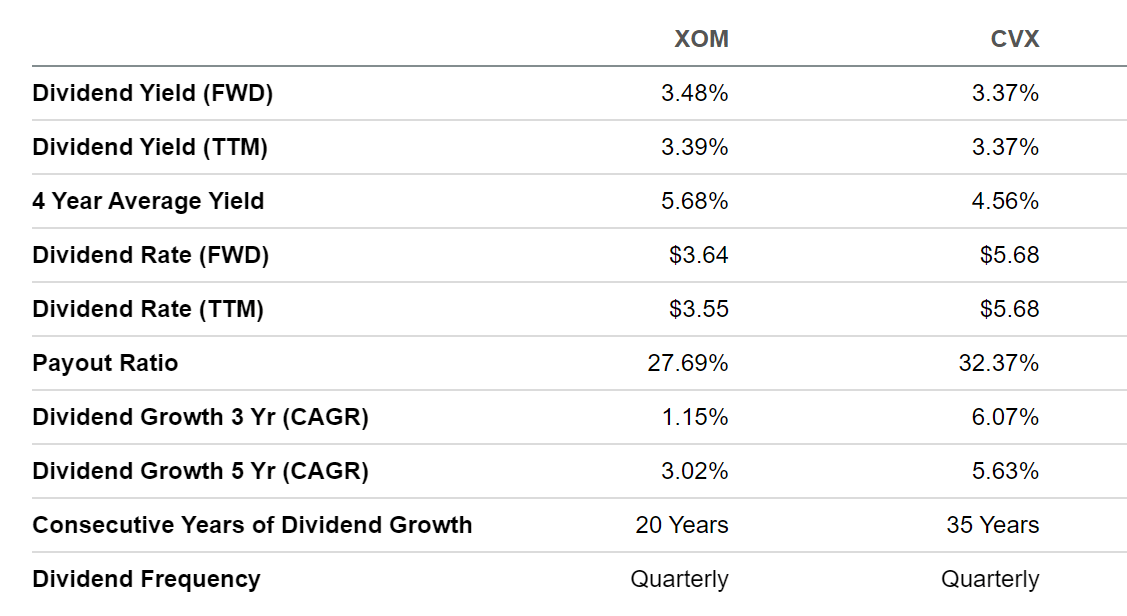
In addition to the numbers provided above, Exxon Mobil has a higher Return on Equity than Chevron (29.73% compared to 23.16%), underlying that the company’s management is more efficient in generating income from shareholder’s equity.
In addition to that, Exxon Mobil’s P/E GAAP [FWD] Ratio of 7.79 is below the one of Chevron (8.71), suggesting it to be the slightly more appealing choice in terms of Valuation.
Furthermore, I would like to highlight that Exxon Mobil’s EBIT Growth Rate [CAGR] over the past 3 Years has been higher than Chevron’s (59.56% compared to 39.89%). Additionally, the company’s EPS Diluted Growth Rate [CAGR] over the past 3 years has also been higher (52.77% compared to 36.18%). Both are indicators confirming that Exxon Mobil has been able to grow its earnings at higher rates when compared to Chevron, thus reinforcing my theory that it’s the more attractive choice.
Below you can find an overview of the Fundamental Data for both companies.
|
Exxon Mobil |
Chevron |
||
|
General Information |
Ticker |
XOM |
CVX |
|
Sector |
Energy |
Energy |
|
|
Industry |
Integrated Oil and Gas |
Integrated Oil and Gas |
|
|
Market Cap |
431.19B |
326.24B |
|
|
Profitability |
EBIT Margin |
16.07% |
16.27% |
|
ROE |
29.73% |
23.16% |
|
|
Valuation |
P/E GAAP [FWD] |
7.79 |
8.71 |
|
Growth |
Revenue Growth 3 Year [CAGR] |
14.16% |
15.96% |
|
Revenue Growth 5 Year [CAGR] |
11.34% |
13.34% |
|
|
EBIT Growth 3 Year [CAGR] |
59.56% |
39.89% |
|
|
EPS Diluted 3 Year [CAGR] |
52.77% |
36.18% |
|
|
Income Statement |
Revenue |
389.39B |
227.05B |
|
EBITDA |
82.32B |
52.93B |
|
|
Balance Sheet |
Total Debt to Equity Ratio |
23.53% |
14.81% |
Source: Seeking Alpha
Projection of the Companies’ Yield on Cost
Below you can find a projection for Exxon Mobil’s Yield on Cost when assuming an Average Dividend Growth Rate of 3% for the company in the next 30 years. You could reach a Yield on Cost of 4.66% in 2032, 6.26% in 2042 and 8.41% in 2052 when assuming this Dividend Growth Rate.
Source: The Author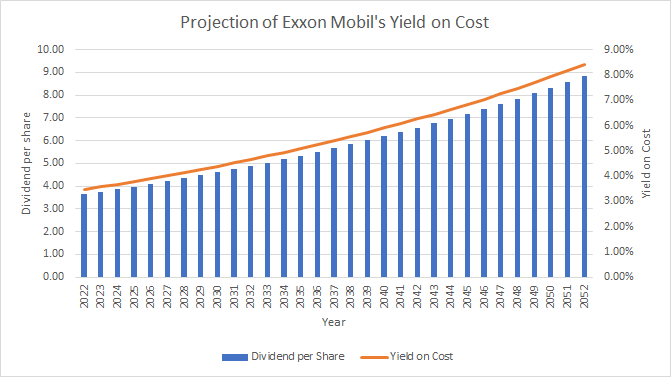
Below you can find the same projection for an investment in Chevron when assuming an Average Dividend Growth Rate of 3% for the company over the coming 30 years. You could reach a Yield on Cost of 4.49% in 2032, 6.03% in 2042 and 8.11% in 2052.
Source: The Author
When assuming the same Dividend Growth Rate of 3% for both companies, a Yield on Cost of 8.41% could be expected for Exxon Mobil and 8.11% for Chevron in 2052. The illustration underlines my theory to consider Exxon Mobil as the currently slightly more attractive option.
The High-Quality Company [HQC] Scorecard
“The aim of the HQC Scorecard that I have developed is to help investors identify companies which are attractive long-term investments in terms of risk and reward.” Here you can find a detailed description of how the HQC Scorecard works.
Overview of the Items on the HQC Scorecard
“In the graphic below, you can find the individual items and weighting for each category of the HQC Scorecard. A score between 0 and 5 is given (with 0 being the lowest rating and 5 the highest) for each item on the Scorecard. Furthermore, you can see the conditions that must be met for each point of every rated item.”
Source: The Author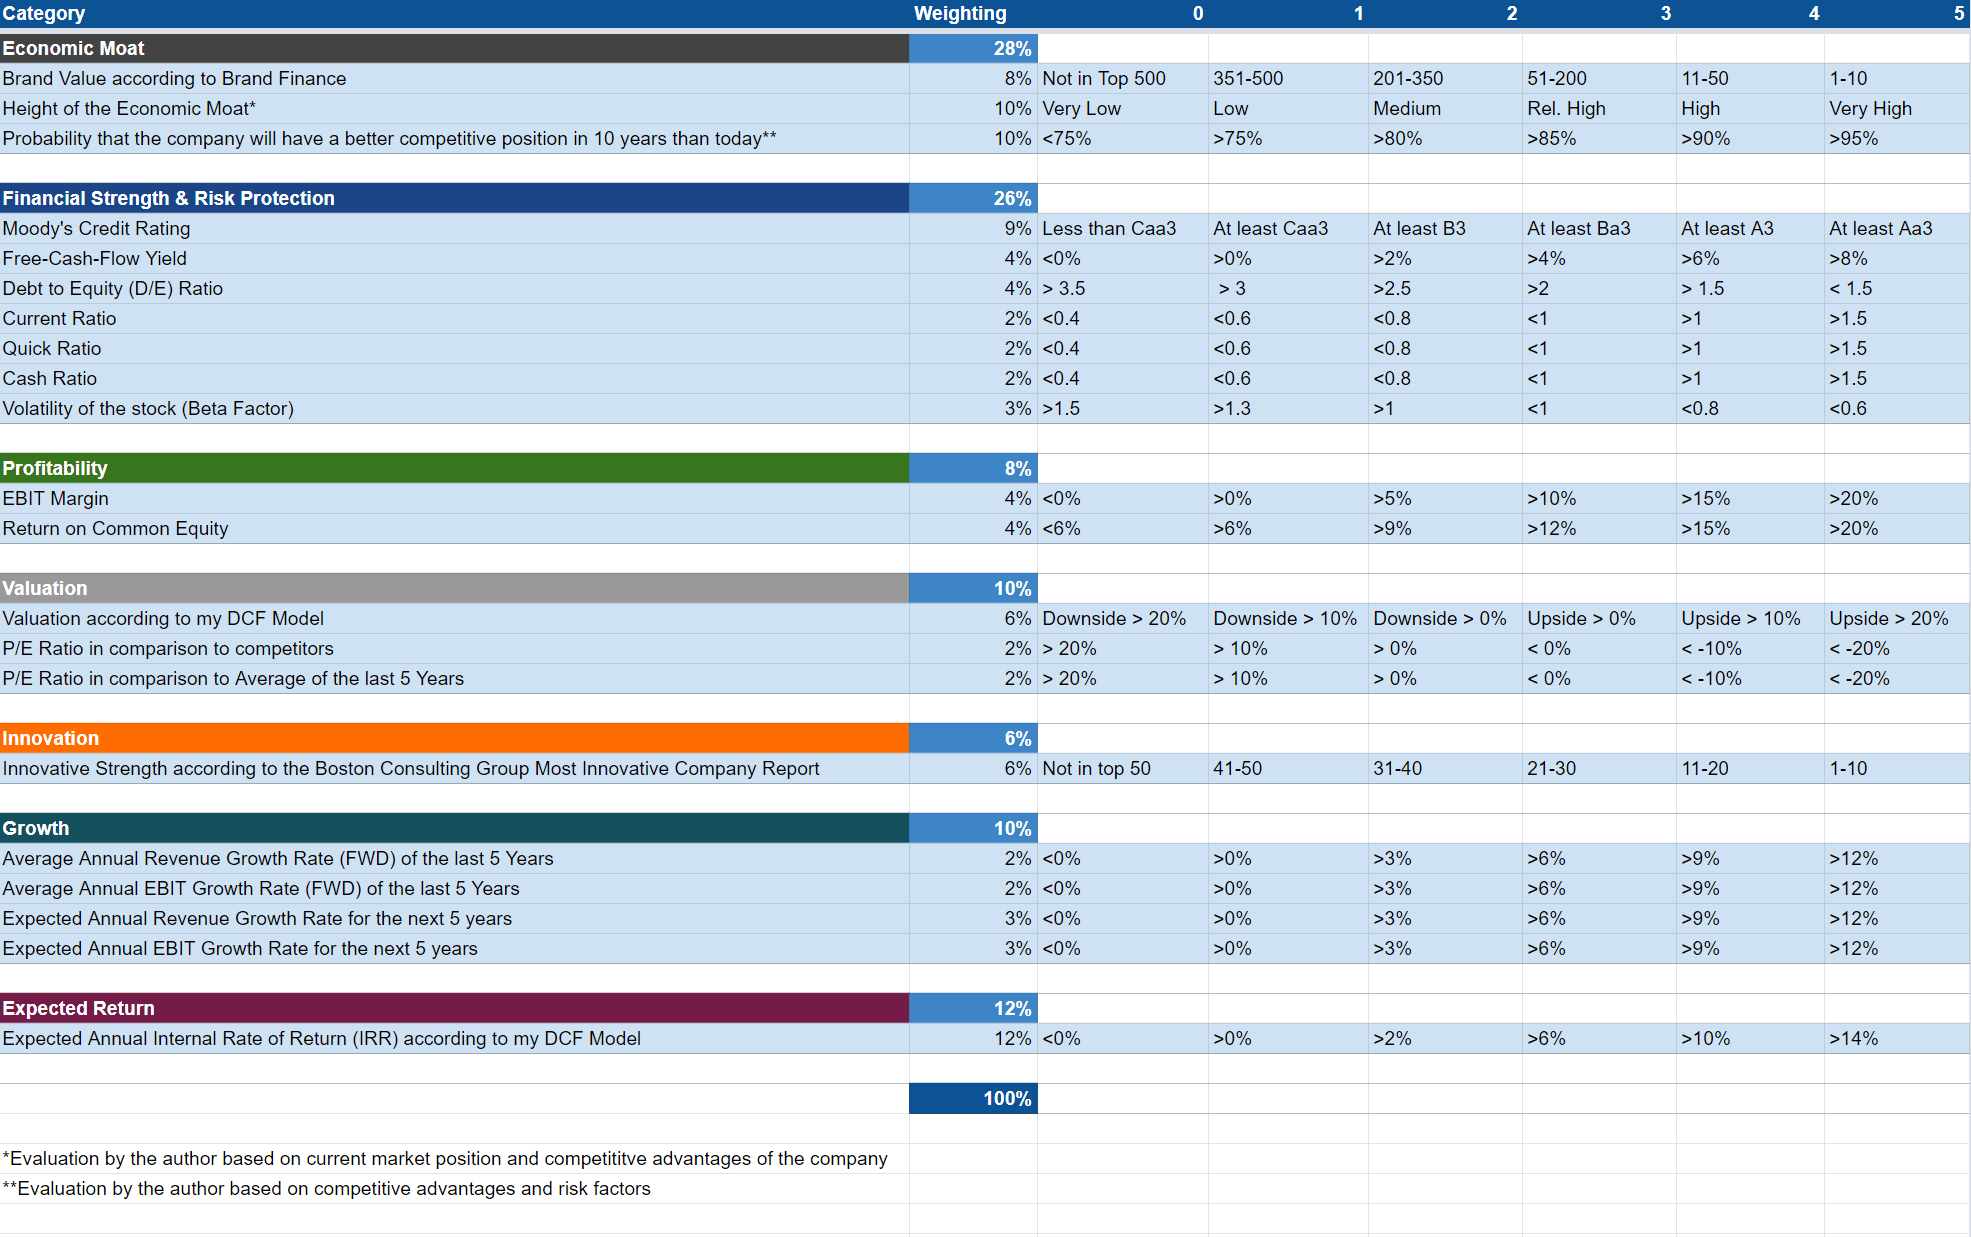
Exxon Mobil vs. Chevron According to the HQC Scorecard
Source: The Author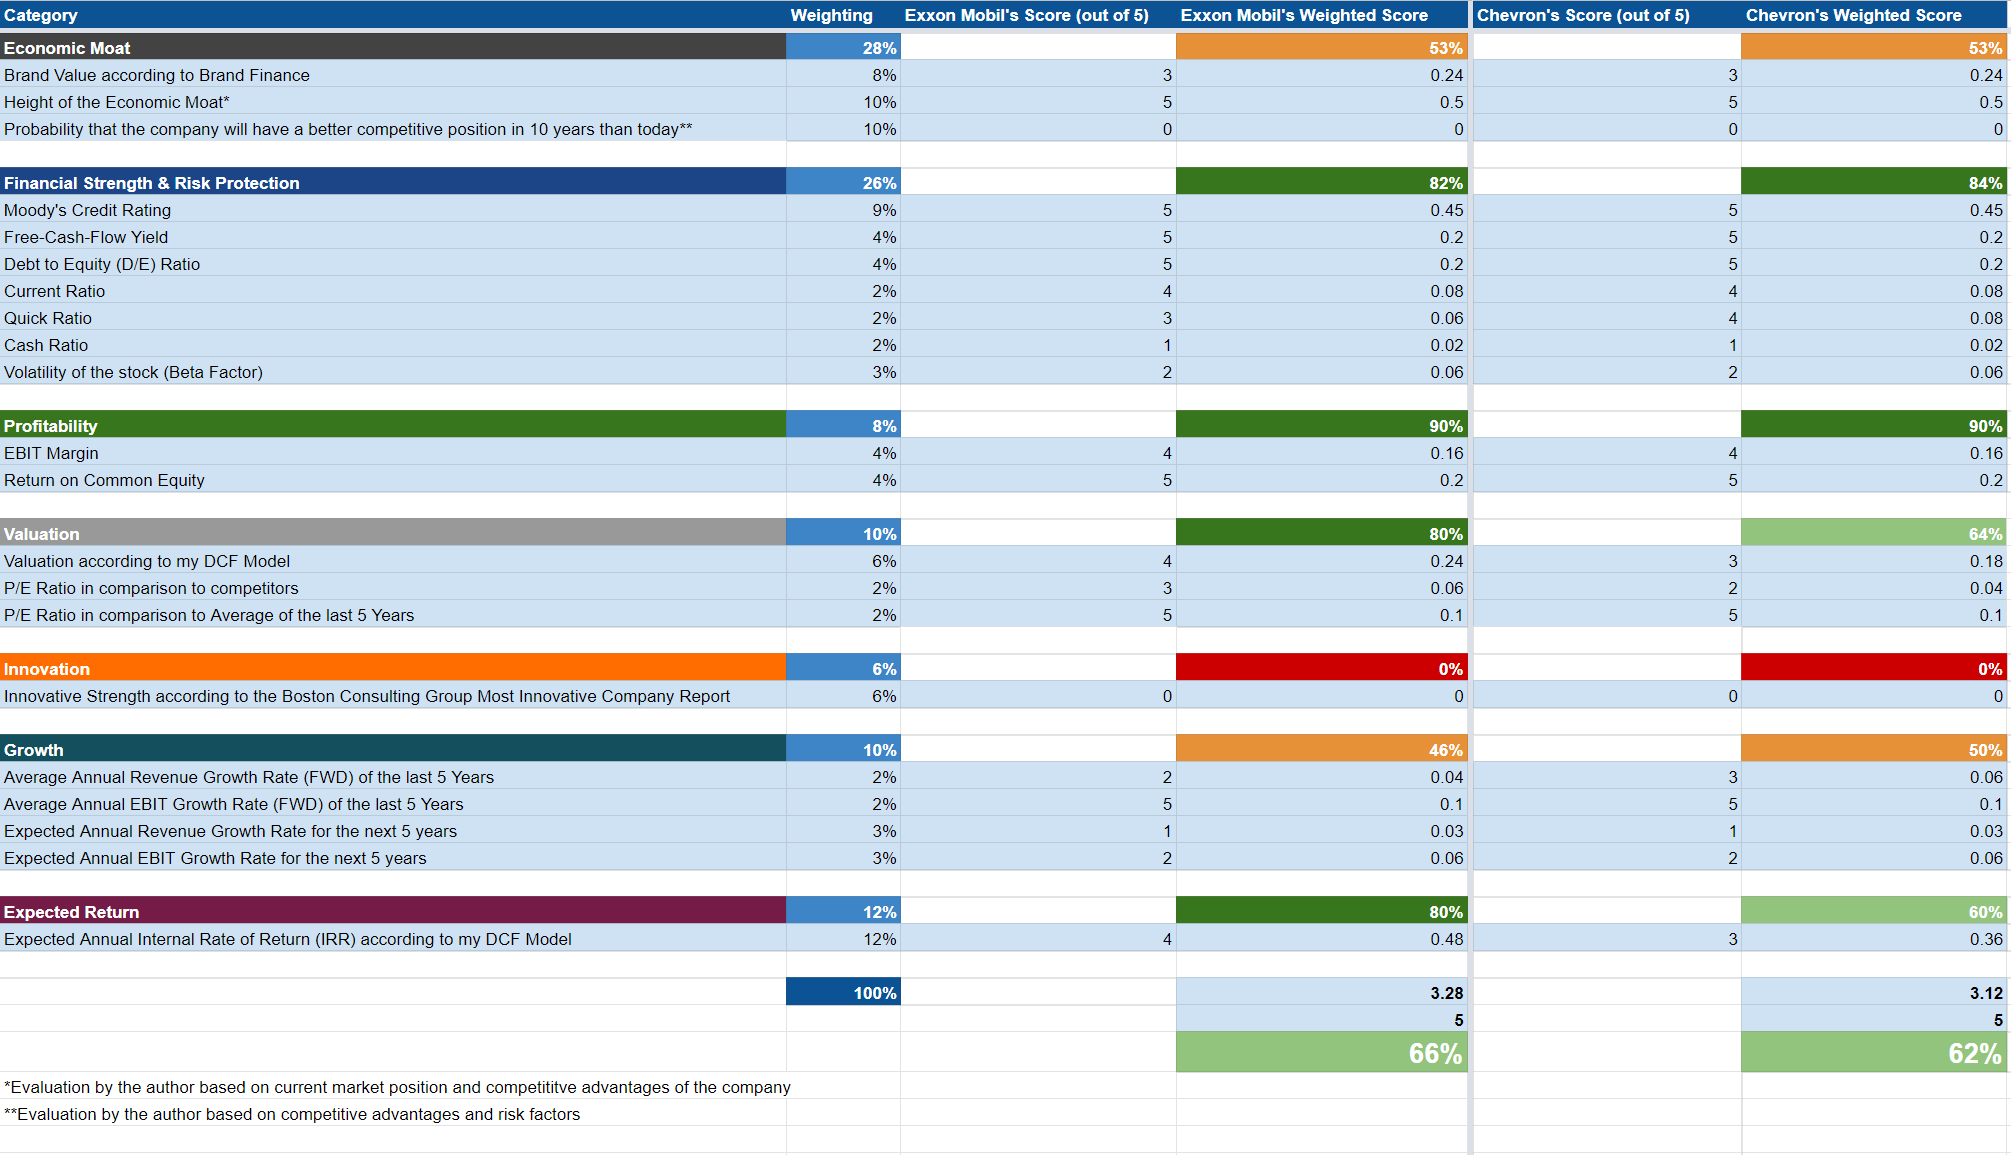
Although both companies receive an attractive overall rating in terms of risk and reward, Exxon Mobil is rated slightly higher (with an overall rating of 66/100 points while Chevron gets 62/100 points).
Particularly in the categories of Valuation (Exxon Mobil receives 80/100 points while Chevron gets 64/100) and Expected Return (80/100 points compared to 60/100 points), Exxon Mobil is rated as slightly more attractive.
Exxon Mobil’s slightly higher overall rating in terms of risk and reward as according to the HQC Scorecard confirms my opinion to prioritize the company over Chevron at this moment in time.
Exxon Mobil vs. Chevron according to the Seeking Alpha Factor Grades
Taking into consideration the Seeking Alpha Factor Grades, we get further confirmation that Exxon Mobil is currently slightly more attractive than its competitor Chevron. Exxon Mobil is rated with a C- in terms of Valuation while Chevron is rated with a D. For Momentum, Exxon Mobil receives an A- while Chevron gets a B-. For EPS Revisions, Exxon Mobil is rated with an A- and Chevron with a B-. The Seeking Alpha Factor Grades serve as an additional indicator that Exxon Mobil is currently the slightly more attractive choice of the two.
Source: Seeking Alpha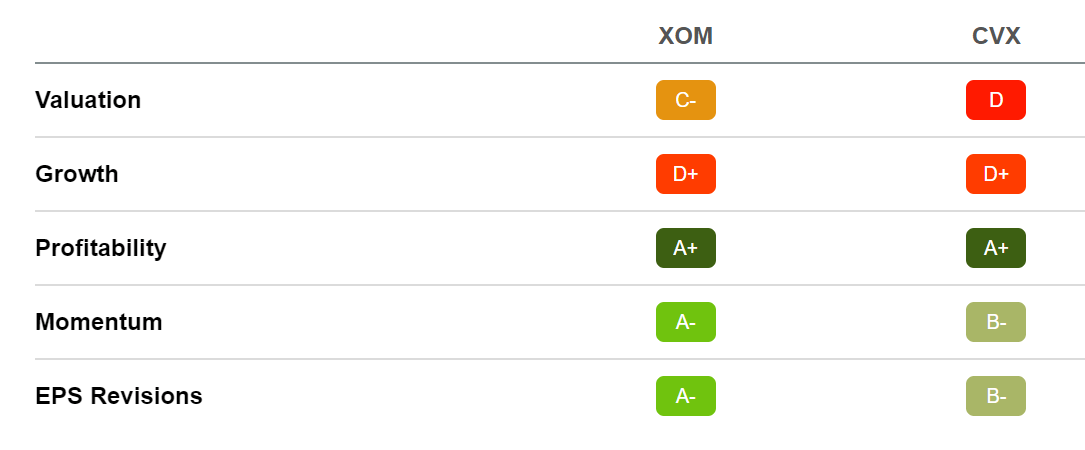
Exxon Mobil vs. Chevron according to the Seeking Alpha Quant Ranking
The same is confirmed by the Seeking Alpha Quant Ranking: Exxon Mobil is ranked 4th within the Integrated Oil and Gas Industry while Chevron is 9th (both out of 18). Within the Energy Sector, Exxon Mobil is ranked 46th and Chevron 63rd (both out of 246).
Source: Seeking Alpha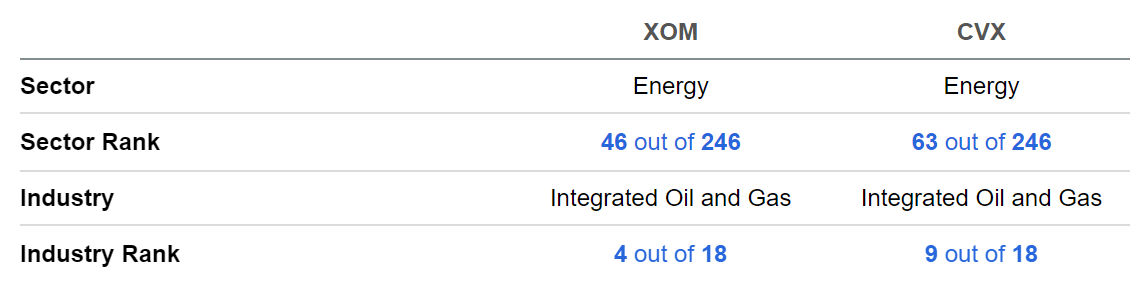
Risks
Some of the risk factors are the same for both Exxon Mobil and Chevron: their financial results are highly dependent on oil and gas prices.
For these reasons, I recommend that you see both companies as a long-term investment and I suggest to invest with a long-investment horizon while benefiting from the steadily increasing dividend payments that the companies offer. In neither case would I recommend that you speculate over the short-term.
In addition to that, the share price of both companies could fall significantly at any time as a result of falling oil and gas prices.
Therefore, I would recommend you benefit from steadily growing dividend payments to be less dependent from the oil and gas prices and also from the volatility of the companies’ stock prices.
For both Exxon Mobil and Chevron I consider the risk of bankruptcy to be low: one of the reasons are the companies’ credit ratings of Aa2 by Moody’s.
However, when deciding whether to invest in Exxon Mobil or Chevron, I see the Exxon Mobil investment as being slightly less risky when compared to Chevron: Exxon Mobil’s 24M Beta of 0.64 is slightly below the one of Chevron (0.65); the company’s 60M Beta of 1.12 is also lower than its competitor (1.19). Below you can find an overview concerning some risk factors of the companies.
Source: Seeking Alpha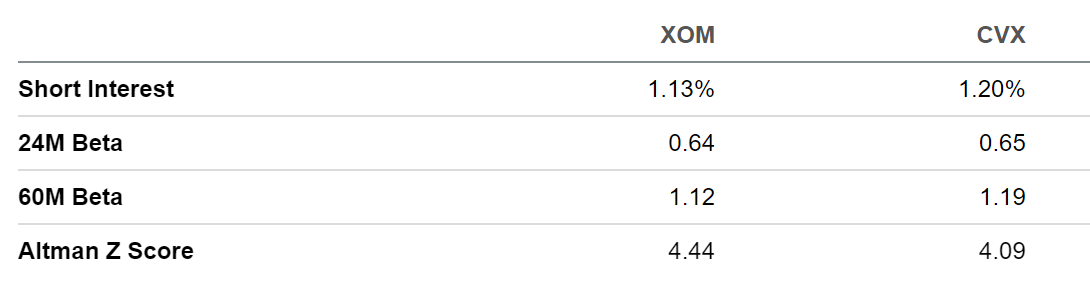
In addition to the factors mentioned above, Exxon Mobil’s Payout Ratio of 27.69% is slightly below Chevron’s (32.37%). This implies that the risk of a dividend cut is even lower for Exxon Mobil, strengthening again my investment thesis.
The Bottom Line
Dividends can help you in a simple way to generate an additional extra income that you can use for your monthly spending. By selecting companies for your portfolio with strong competitive advantages that are able to raise their dividend year over year, you can steadily increase this additional extra income from one year to another.
I consider both Exxon Mobil and Chevron to be among these kinds of companies that could provide you with an extra income in the form of dividends: both have strong competitive advantages and a wide economic moat, which makes them attractive choices for long-term oriented dividend income investors who aim to benefit from increasing dividend payments year over year. In addition to that, I consider both companies to be attractive in terms of risk and reward.
However, if I had to select one out of the two, I would go for Exxon Mobil: my decision is mainly based on the company’s slightly higher Dividend Yield [FWD] (3.48% compared to 3.37%) and lower Payout Ratio (27.69% compared to 32.37%) as well as the fact that I consider Exxon Mobil to be the more attractive choice in terms of Valuation: my DCF Model indicates an expected compound annual rate of return of 13% for Exxon Mobil while it shows one of 9% for Chevron. In addition to that, Exxon Mobil shows a higher Free Cash Flow Yield [TTM] of 13.39% while Chevron’s is currently 10.9%.
Due to limited growth perspectives, I would recommend that you do not overweight the companies in your investment portfolio, but to see them as an addition to your investment portfolio in order to generate additional income in the form of dividends.
Author’s Note: Thank you for reading and for providing any feedback on this comparative analysis! It would be great to hear which one you would select or do you already have one of these companies in your portfolio.
Disclosure: I/we have a beneficial long position in the shares of XOM, CVX either through stock ownership, options, or other derivatives. I wrote this article myself, and it expresses my own opinions. I am not receiving compensation for it (other than from Seeking Alpha). I have no business relationship with any company whose stock is mentioned in this article.