Summary:
- Exxon Mobil announced a new $50 billion buyback plan.
- That’s massive in absolute terms, but investors should look at shareholder returns on a relative basis.
- XOM is far from expensive — but many other energy names are even cheaper.

selensergen
Article Thesis
Exxon Mobil (NYSE:XOM) has executed very well in the current energy crisis environment and will generate highly attractive profits and cash flows this year. A strong balance sheet and rising cash flows allow Exxon Mobil to return a large amount of cash to its owners — the company has recently upped its buyback plan to $50 billion. That being said, the cash return isn’t overly high on a relative basis, at least compared to what many other energy names are offering today. Since Exxon Mobil is also trading at an above-average valuation, relative to many other oil and gas stocks, I give it a neutral rating for now, as competitors look even more attractive.
Execution Recap
For some years prior to the pandemic, Exxon Mobil had underperformed its peers on a share price basis, and its cash flows weren’t too strong. The company was upgrading its portfolio, however, and over time, break-even costs declined to lower and lower levels, thanks to growing exposure to attractive assets in Guyana, the Permian Basin, and so on. During the pandemic, Exxon Mobil cut expenses further, like many of its peers, and became even leaner and meaner.
When energy prices started to recover meaningfully over the last year or so, Exxon Mobil was perfectly positioned to benefit from that — the combination of low break-even prices and high energy prices made Exxon Mobil very profitable, and its cash flows soared. Over the last twelve months, Exxon Mobil generated operating cash flows of $76 billion:
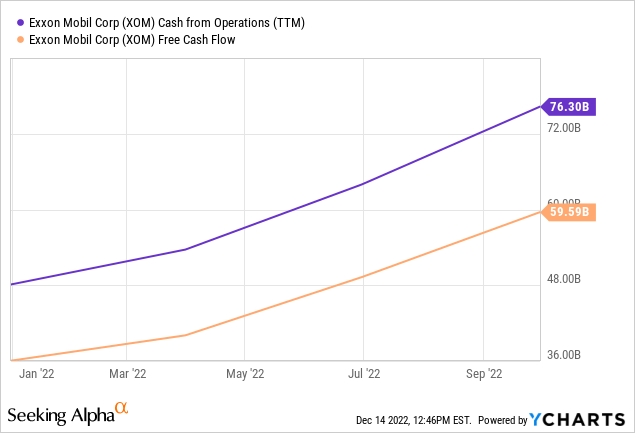
When we subtract the capital investments the company made over the same time frame, we get to free cash flows of almost $60 billion, which is excellent. Exxon Mobil used a substantial portion of that for deleveraging, which is why the company’s net debt position declined from $40 billion at the beginning of the current year to just $15 billion as of the end of the third quarter. By now, the net debt position is likely even smaller. That’s great news for investors, as Exxon Mobil had seen its balance sheet get weaker for a couple of years prior to the pandemic — that is now being reversed, and the company is now operating with a pretty strong balance sheet once again.
The company has recently stated that it sees $9 billion in structural cost savings by the end of 2023, relative to what the company spent in 2019. That’s largely the impact of the major cost-cutting efforts during the initial phase of the pandemic, when energy prices were pretty low and when energy companies were forced to become as efficient as possible. But the company sees some additional potential for further efficiency gains next year, which is a good thing — companies should thrive to be as efficient as possible even during good times.
Exxon Mobil has also guided towards a doubling of its cash flow potential relative to 2019 (see above link). Since the company has generated operating cash flows of around $30 billion in 2019, that indicates a $60 billion operating cash flow potential at comparable energy prices (lower than today). That’s not as much as XOM generated over the last year, but considering that the $60 billion operating cash flow number can be achieved at lower oil prices relative to what we have seen in 2022, it’s still a very solid result. Exxon Mobil has also been forecasting annual capital expenditures in the $20 billion to $25 billion range, which means that the company’s free cash flow potential would be around $35 billion to $40 billion per year in the future.
Shareholder Returns Are Growing, But How Good Are They On A Relative Basis?
Since deleveraging isn’t really needed any longer due to an already very healthy balance sheet, Exxon Mobil can return a substantial portion of those cash flows to the company’s owners. The dividend costs around $15 billion per year, thus $20 billion to $25 billion are left over for other purposes. A significant portion of that will be used for buybacks: The company has just announced that it would spend $50 billion on share repurchases through the end of 2024, which includes around $15 billion that is earmarked for buybacks in 2022 (inclusive of the amount already spent in Q1-Q3).
$50 billion in buybacks sounds like a massive amount of money. And it is a pretty large sum in absolute terms, of course. But when we take a closer look, it may not be as much as some investors think. The amount will be spent over three years, which pencils out to a little less than $17 billion per year on average (backloaded to some degree, as 2022’s buybacks will be a little lower, at $15 billion). Exxon Mobil is currently valued at $440 billion, which means that the $16.7 billion in annual buybacks are equal to around 3.8% of XOM’s current market value. Buybacks in the 3%-4% range are attractive — that’s comparable to the buyback pace Apple (AAPL) has had over the last decade. But buybacks in the 3% to 4% range are not an absolute gamechanger, and it is important to note that some other energy names are offering much higher buyback yields:
– Cenovus Energy (CVE), for example, has recently announced a new buyback program that covers 10% of its public float and that has a time horizon of one year, indicating that the share count reduction will be a lot higher, in relative terms, relative to what XOM will offer.
– Imperial Oil (IMO), in which Exxon Mobil owns a stake, has lowered its share count by 11% over the last year:
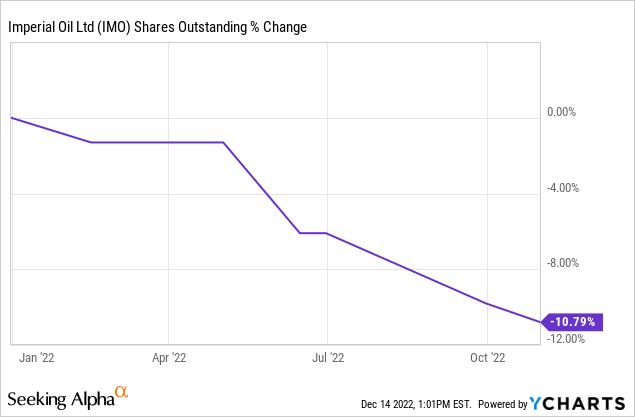
This does not yet include an additional 3% reduction caused by a recently-completed substantial cause issuer bid (tender offer).
-Exxon Mobil’s European supermajor peers Shell (SHEL) and BP (BP) have lowered their share count significantly more, relative to XOM, over the last year:
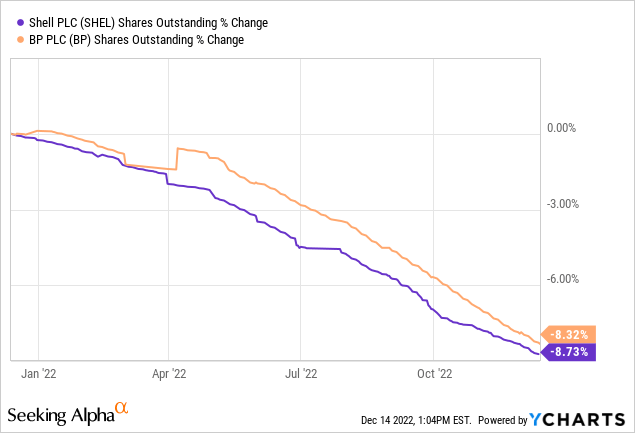
Shares outstanding dropped by close to 10% for both companies, and that was achieved despite deleveraging. Once net debt targets are hit, both might increase their buyback spending further.
– Suncor (SU), a Canadian integrated energy company, has a 10% target for share repurchases in 2022. At the same time, the company has also reduced its debt this year and offers a dividend yield of around 5%, which is higher compared to what investors get from Exxon Mobil today.
These examples show that integrated, low-risk energy companies offer way higher buyback yields than Exxon Mobil in some cases. Investors thus may not want to read too much into Exxon Mobil’s 3%-4% buyback yield — that’s good, but not outstanding. Non-integrated, higher-risk energy companies offer even higher buyback yields in some cases — Marathon Oil (MRO), for example, has reduced its share count by a hefty 15% over the last year.
Valuation: Not High, But Other Energy Names Are Even Better Value Picks
Exxon Mobil trades for 7.7x this year’s net profit, based on current analyst estimates. That is, by far, not a high valuation. It should be said, however, that 2022 will be an above-average year — the earnings multiple based on current EPS estimates for 2023 is 9.6, which makes for an earnings yield of a little more than 10%.
While Exxon Mobil is far from expensive based on these numbers, other energy names are considerably cheaper. SHEL and BP trade for 5.3x and 3.8x this year’s expected net profit, respectively, according to current analyst estimates. The aforementioned Cenovus and Suncor trade for 6.6x and 4.5x this year’s net profit.
Another way to look at a stock’s valuation is the EV/EBITDA multiple. This accounts for net debt usage, which makes it easier to compare companies with differing levels of indebtedness.
In absolute terms, Exxon Mobil does, again, look inexpensive, as it trades for 4.3x this year’s expected EBITDA today:
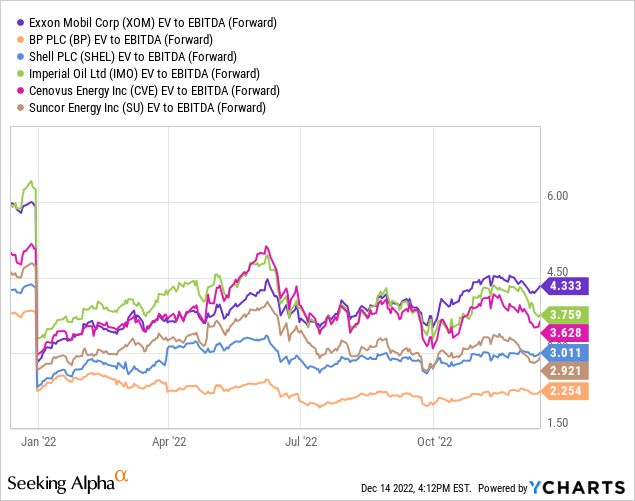
The other integrated energy companies mentioned in this article — these aren’t high-risk pure upstream plays — trade at just 2.3x to 3.8x this year’s EBITDA, however. XOM is, in other words, around 40% higher than the average of these companies. One can argue that XOM deserves a premium valuation: Its dividend growth track record, its international diversification, and the liquidity of its shares could be factors that warrant a higher valuation. But I do not think that a 40% premium is justified — this seems elevated to me.
So while Exxon Mobil is far from expensive in absolute terms, it is far from a bargain in relative terms. The energy industry is so cheap that Exxon Mobil is looking less compelling than many other quality names in this industry.
When we look at XOM’s current share price versus its 52-week trading range, we see that it trades just a couple of percent below its 52-week high. Other companies, such as Suncor, look like a better buy from a timing perspective, as Suncor currently trades 30% below the 52-week high it hit in the summer.
Takeaway
Exxon Mobil is a quality energy name with compelling assets. Profits and cash flows will be strong this year, and shareholder returns will be very substantial going forward. On a relative basis, these shareholder returns do not look too attractive, however — due to a lower valuation, many other energy names offer significantly higher shareholder yields.
Since XOM’s valuation is among the highest in the energy industry, its relative upside potential could also be subdued. I thus am neutral on XOM right here despite the new $50 billion buyback announcement, as other energy names offer a better value and fatter shareholder yields.
Disclosure: I/we have a beneficial long position in the shares of CVE, BP, SHEL, IMO either through stock ownership, options, or other derivatives. I wrote this article myself, and it expresses my own opinions. I am not receiving compensation for it (other than from Seeking Alpha). I have no business relationship with any company whose stock is mentioned in this article.
Is This an Income Stream Which Induces Fear?
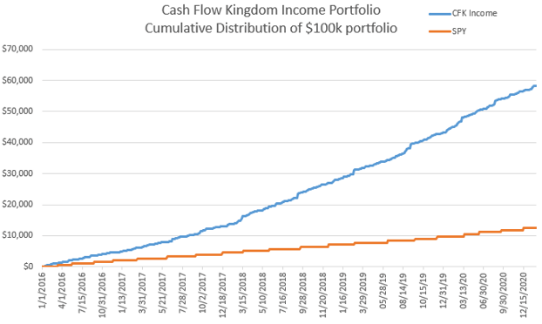 The primary goal of the Cash Flow Kingdom Income Portfolio is to produce an overall yield in the 7% – 10% range. We accomplish this by combining several different income streams to form an attractive, steady portfolio payout. The portfolio’s price can fluctuate, but the income stream remains consistent. Start your free two-week trial today!
