
Summary:
- Exxon has huge EBITDA and FCF numbers.
- Chevron has better Gross margin percentages.
- Combined Exxon and Chevron have committed to spending $125 billion on share buybacks.
- Quants seem to like Exxon better than Chevron.
DjordjeDjurdjevic
Overview:
Exxon Mobil Corp (NYSE:XOM) and Chevron Corp. (CVX) are two of the largest energy companies in the world with MV (Market Value) of $420 billion and $296 billion respectively. Both companies are based in Houston, Texas.
Both companies are Dividend Aristocrats having raised their dividend for 25 years in a row.
From an MV point, Exxon is the second largest behind only Saudi Aramco (ARMCO) and Chevron is the third largest.
Both companies were hugely successful in 2022 but now face lower oil and gas prices in 2023. Note that Exxon’s 2022 revenue of $398 billion is much higher than Chevron’s $236 billion.
Looking at the Total Return (including dividends) over the last year, XOM has done better with an increase of 22% versus CVX’s increase of 13%.
Seeking Alpha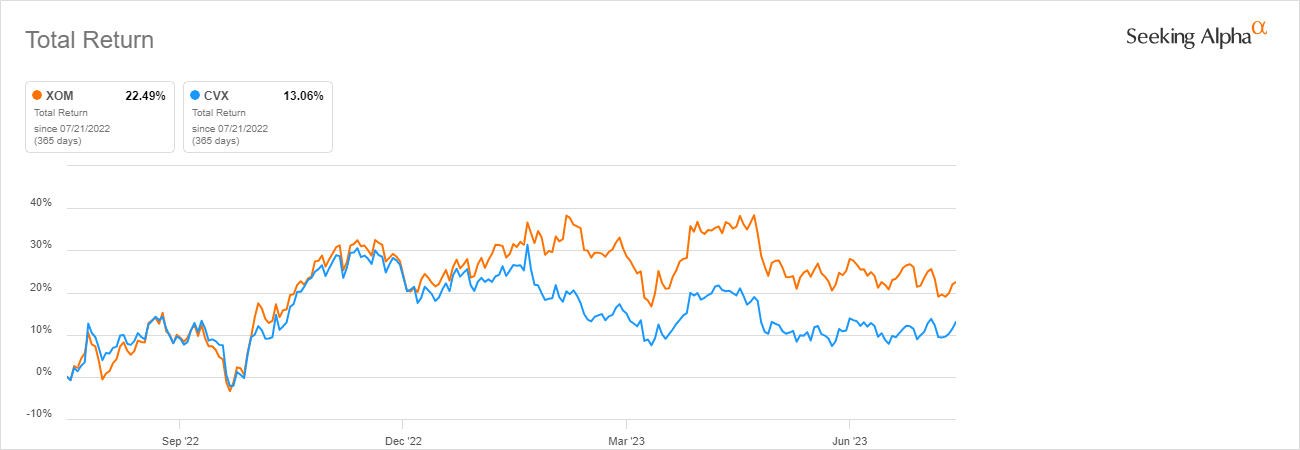
Looking at the maps of operations it is easy to see the magnitude of Exxon’s resources which are literally on every continent.
Exxon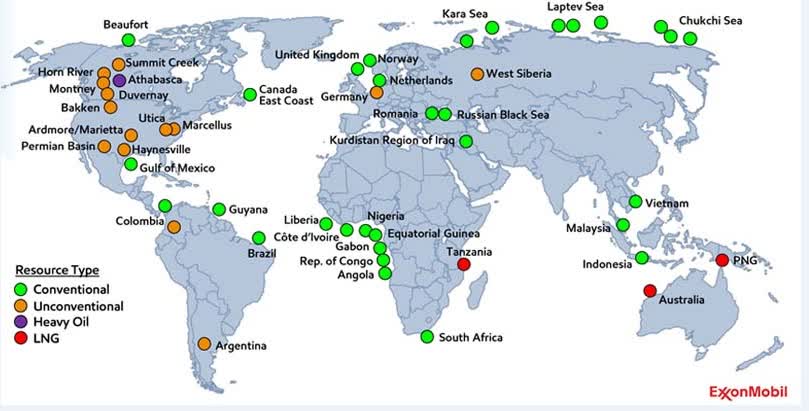
Chevron has a similar look, with operations on every continent but fewer in North America and Europe than Exxon.
Chevron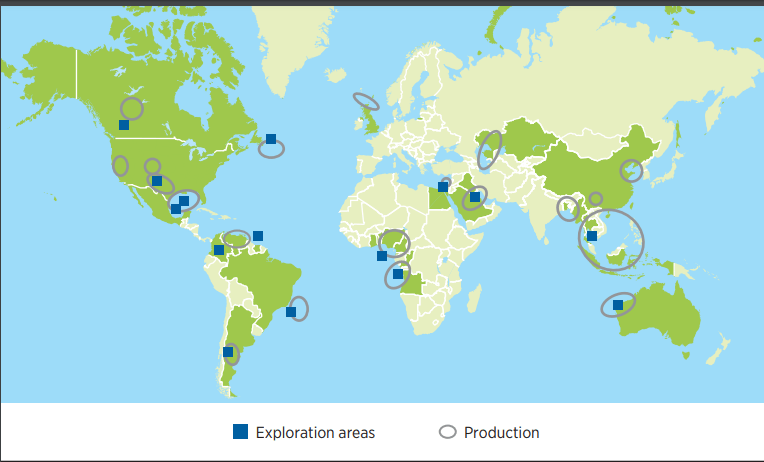
In this article, I will compare both companies to determine which one or both presents the best investment opportunity going forward.
Here are four points to consider before investing in either Exxon or Chevron.
1. Financial metrics
As anyone who follows the market knows, energy companies have underperformed the market over the last year. On a 2023 YTD basis, energy is one of the worst-performing sectors, up a paltry 2% over the last 12 months.
Trading Economics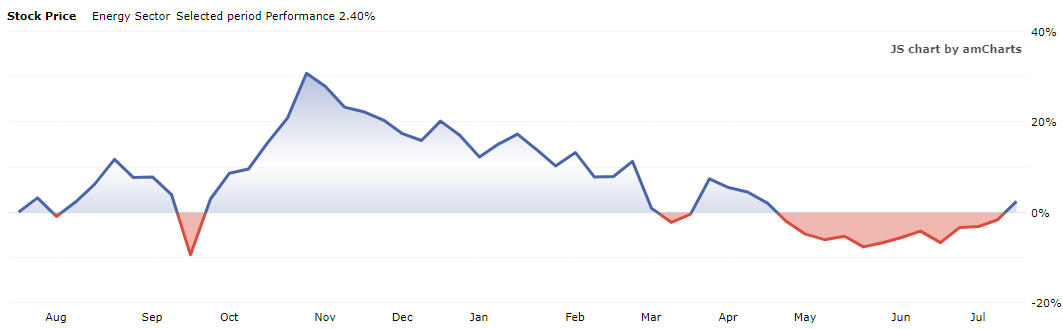
And looking at XOM and CVX individually, they both have performed quite well over the last 12 months.
Seeking Alpha and author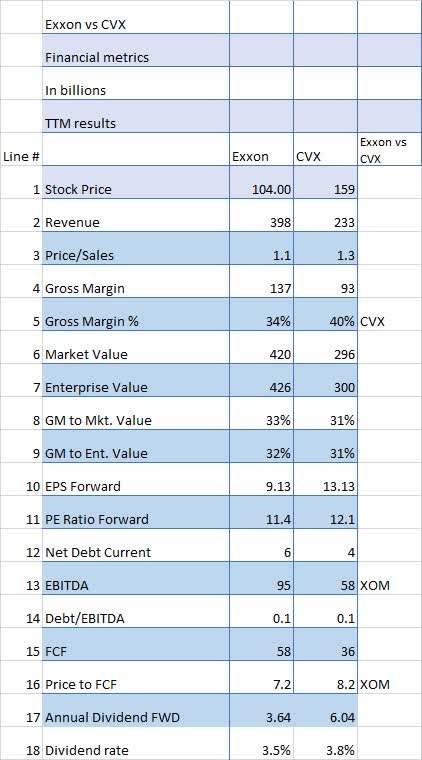
The first item is the Price/Sales ratio (Line 3) where Chevron’s ratio is slightly higher than Exxon’s. This could imply that Chevron is overpriced compared to Exxon.
But moving on to Gross Margin % (Line 5) which shows CVX with a rather large advantage of 40% to XOM’s 34%. The chart below shows CVX has had better margins over the last decade relative to XOM.
Seeking Alpha and author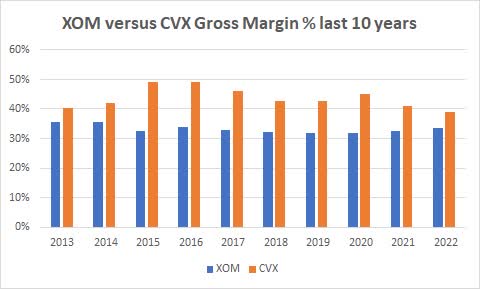
Obviously, CVX has consistently shown greater GM than XOM. Chevron has a high GM of 49% over the last 10 years compared to Exxon’s high GM of 36%.
Other financial metrics of interest include the PE Ratio (Line 11) which shows a small advantage to Exxon.
When it comes to EBITDA (Line13) Exxon shows a huge advantage of $37 billion. Ditto for FCF (Line 15) where Exxon outperforms again by $22 billion. That gives Exxon a lower Price to FCF (Line 16).
And finally, in terms of dividend rate, both are right around 3.5%.
Advantage: Exxon
2. What do analysts think?
Looking at how Wall Street analysts have rated the two shows Chevron with a slight advantage with 19 Buys and only 2 Sells compared to Exxon’s 16 Buys and 3 Sells.
Chevron also wins with more Strong Buys and fewer Holds than XOM.
Seeking Alpha and author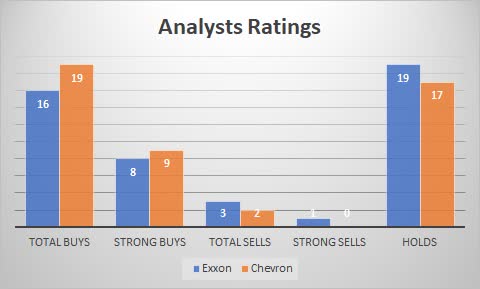
When it comes to the quants, they currently have Exxon as a Buy and Chevron as a Hold. But over the last year, Exxon had fairly consistent Buy ratings.
Chevron, on the other hand, has been a consistent quant Hold over the last 7 months.
Seeking Alpha Seeking Alpha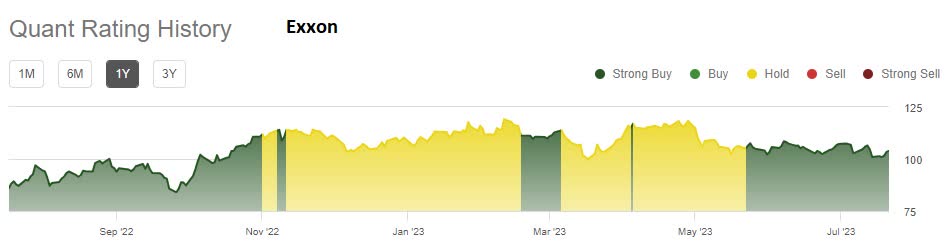
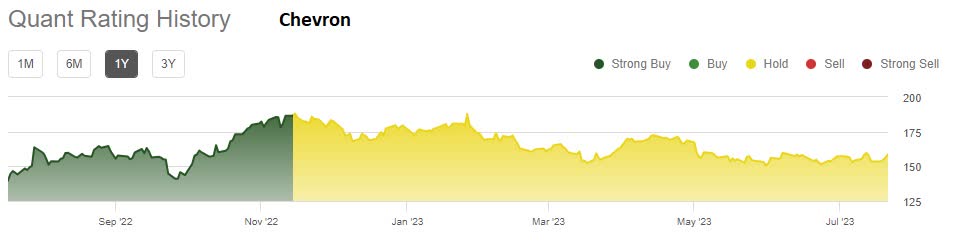
For some reason, the quant algorithms have been unable to find a reason to buy Chevron.
Advantage: Exxon
3. Share buybacks are a priority for both companies
With their enormous financial capabilities, both companies have announced policies to return excess cash flow back to the shareholders.
Exxon has upped its share buyback to $50 billion over three years, representing about 12% of Exxon shares.
Chevron recently announced a $75 billion buyback, which makes Exxon’s $50 billion buyback look a little paltry. Chevron’s $75 billion represents about 24% of its shares compared to XOM’s 12%. However, keep in mind that XOM’s buyback is for 3 years while CVX’s has no official end date so could theoretically be over 10 years compared to Exxon’s 3 years.
Neither company has bought back many shares over the last 10 years with XOM buying 4% and CVX only 1%.
Advantage: neither
4. Dividend increases are coming for both Exxon and Chevron
Exxon has increased its dividend every year for 25 years, but the last five years have been relatively meager with an average annual increase of less than 3% going from $0.77 per quarter to $0.91 per quarter.
Seeking Alpha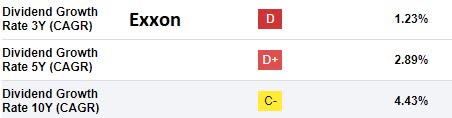
Chevron has increased its dividends at a faster rate than XOM over the last 3 and 5-year periods but they are about the same over the last 10 years.
Seeking Alpha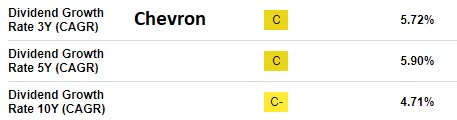
Advantage: neither
Conclusion:
The risk in any commodity-related investment such as oil and gas producers, is that the companies involved have no control over what the price of the commodity eventually is and thus have limited control over revenue and profits. The other issue all oil companies deal with is governmental regulations and the corporate push for ESG (Environmental, Social, and corporate Governance) although that appears to be less of an issue right now.
Comparing Exxon to Chevron shows a few differences, especially in the area of financial metrics.
Exxon shows superior EBITDA, and FCF compared to Chevron. But Chevron has a $25 billion (Exxon $50 billion vs. Chevron $75 billion) difference in future share buyback allocations.
On the other hand, Chevron could be considered somewhat overpriced looking at the Price to FCF ratio and the PE ratio.
Exxon is a Buy due to its superior financial metrics and quant Buy rating.
Chevron is a Hold.
Analyst’s Disclosure: I/we have a beneficial long position in the shares of XOM either through stock ownership, options, or other derivatives. I wrote this article myself, and it expresses my own opinions. I am not receiving compensation for it (other than from Seeking Alpha). I have no business relationship with any company whose stock is mentioned in this article.
Seeking Alpha’s Disclosure: Past performance is no guarantee of future results. No recommendation or advice is being given as to whether any investment is suitable for a particular investor. Any views or opinions expressed above may not reflect those of Seeking Alpha as a whole. Seeking Alpha is not a licensed securities dealer, broker or US investment adviser or investment bank. Our analysts are third party authors that include both professional investors and individual investors who may not be licensed or certified by any institute or regulatory body.
If you found this article to be of value, please scroll up and click the "Follow" button next to my name.
Note: members of my Turnaround Stock Advisory service receive my articles prior to publication, plus real-time updates.