
Summary:
- Adobe reports Q4 results on Dec. 15.
- The shares have risen since the sell-off after the announcement of the Figma acquisition.
- The Wall Street consensus rating is a buy, although the consensus price target is only about 10% above the current share price.
- The market-implied outlook (calculated from options prices) is slightly bullish to the middle of 2023, but neutral for the full year.

Santiaga
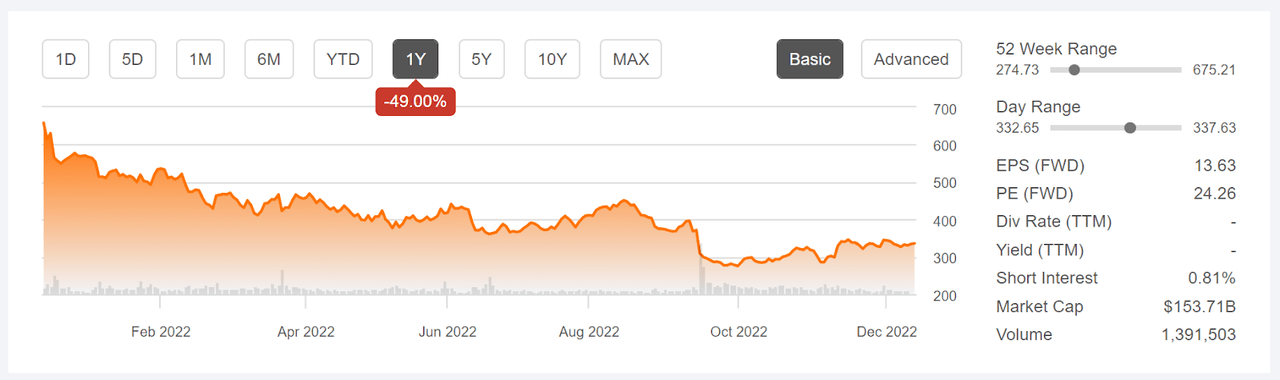
Adobe (NASDAQ:ADBE) reports FY 2022 Q4 results on Dec. 15. Adobe shares have been gaining over the past six weeks or so, but remain well below the level before the sell-off triggered by the company’s announcement that it was acquiring Figma. The shares are down 49% over the past 12 months. Most of this decline is due to the broad sell-off in the U.S. equity market, with larger drops for tech stocks. The Nasdaq 100 (QQQ), in which ADBE is the 16th-largest holding, is down 27.9% over the past 12 months. Given that ADBE has a beta of 1.23 vs. QQQ over the past three years, the drop in QQQ implies a 34% fall for ADBE.
Seeking Alpha
12-Month price history and basic statistics for ADBE (Source: Seeking Alpha)
The magnitude and abruptness of the share decline following the announcement of the Figma acquisition can explain much of the decline that’s not explained by the falling market for tech shares. I was not alone in writing that the market was being too negative about the deal. ADBE’s management has demonstrated consistent strong execution in growing the firm, and the immediate rush to judgment among market commentators seems especially premature in that light. As is typically the case for large acquisitions, there are potential regulatory hurdles to the deal closing, but the most common critique that I read was that Adobe was substantially overpaying for Figma.
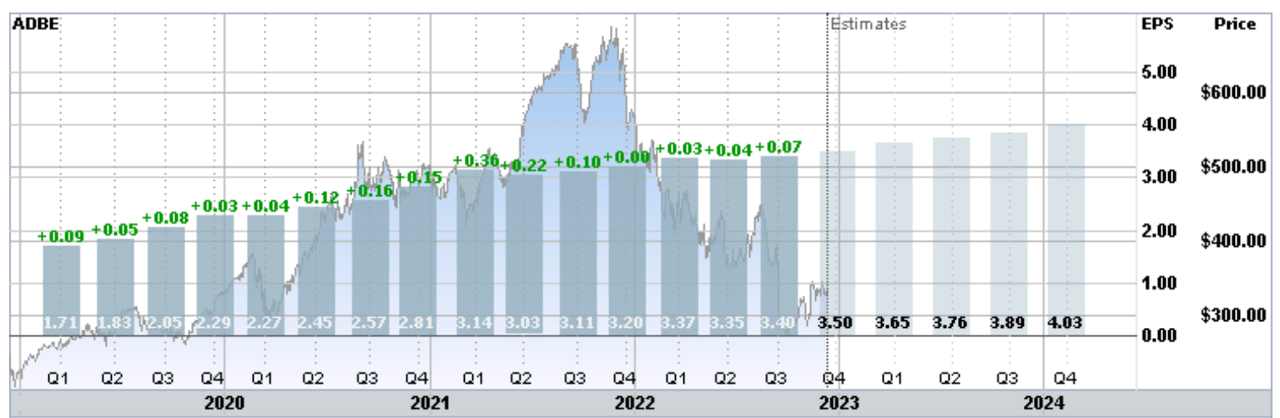
Adobe has grown earnings at a remarkably consistent rate in recent years. Perhaps equally important, management has guided the market expectations such that the company has been able to beat the earnings consensus in every quarter of the last four years. The earnings history shows a growth trajectory that reflects a disciplined growth strategy that has been executed well. The consensus outlook is for 14.3% annualized EPS growth over the next three to five years.
ETrade
Trailing (4 years) and estimated future quarterly EPS for ADBE. Green values are amounts by which EPS beat the consensus expected value (Source: ETrade)
While ADBE has gotten more expensive relative to earnings as the shares have recovered in the last six weeks, and Seeking Alpha gives ADBE a grade of D for valuation, it’s worth remembering that the shares traded at forward P/E ratios in the 50s during 2021. The current forward P/E of 24.3 looks quite reasonable to me. The TTM P/E is 32.6, which is the lowest level since 2013.
I last wrote about ADBE on Oct. 19, 2022, after the big drop following the Figma announcement, and I reiterated a buy rating on the shares. The forward P/E had fallen to 21.5, very low compared to historical levels. The Wall Street consensus rating was a buy, and the consensus 12-month price target implied an expected 22% to 24% gain over the next year. The market-implied outlook, a probabilistic price forecast that represents the consensus view from the options market, was slightly bullish to early- and mid-2023, with expected volatility of 42%-44% (annualized). As a rule of thumb for a buy rating, I want to see an expected return for a stock that is at least ½ the expected volatility. Taking the consensus price target at face value, met this criterion. In the (roughly) 7 1/2 weeks since this post, ADBE has gained almost 12%.

Seeking Alpha
Previous post on ADBE and subsequent performance vs. the S&P 500 (Source: Seeking Alpha)
For readers who are unfamiliar with the market-implied outlook, a brief explanation is needed. The price of an option on a stock is largely determined by the market’s consensus estimate of the probability that the stock price will rise above (call option) or fall below (put option) a specific level (the option strike price) between now and when the option expires. By analyzing the prices of call and put options at a range of strike prices, all with the same expiration date, it’s possible to calculate a probabilistic price forecast that reconciles the options prices. This is the market-implied outlook. For a deeper explanation and background, I recommend this monograph published by the CFA Institute.
Approaching the Q4 earnings report, I have calculated updated market-implied outlooks for ADBE and compared these with the current Wall Street consensus outlook in revisiting my rating.
Wall Street Consensus Outlook for ADBE
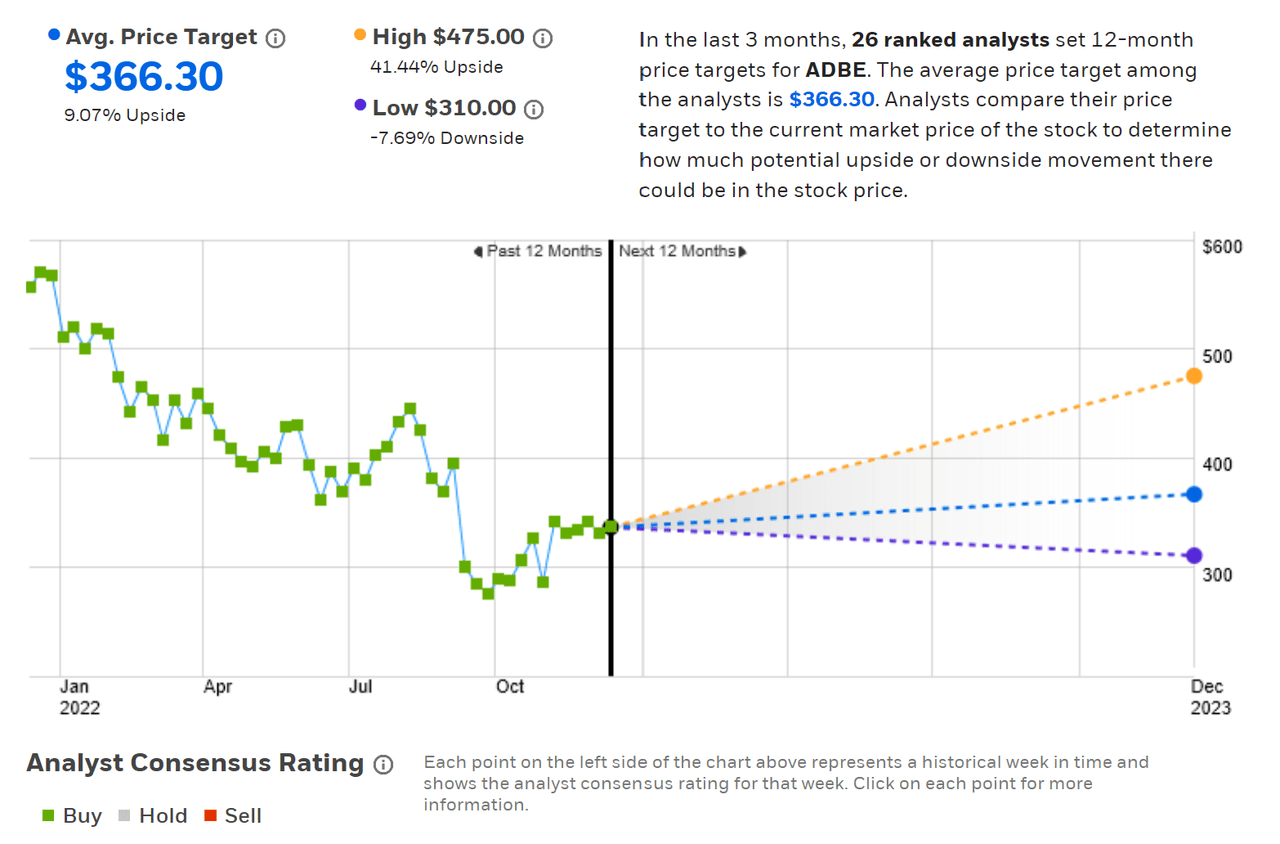
ETrade calculates the Wall Street consensus outlook for ADBE using the views of 26 ranked analysts who have published price targets and ratings during the last three months. The consensus rating is a buy, as it has been for all of the past year, and the consensus 12-month price target is 9.1% above the current share price. The consensus price target is just slightly lower than the value at the time of my Oct. 19 post, $367.22.
ETrade
Wall Street analyst consensus rating and 12-month price target for ADBE (Source: ETrade)
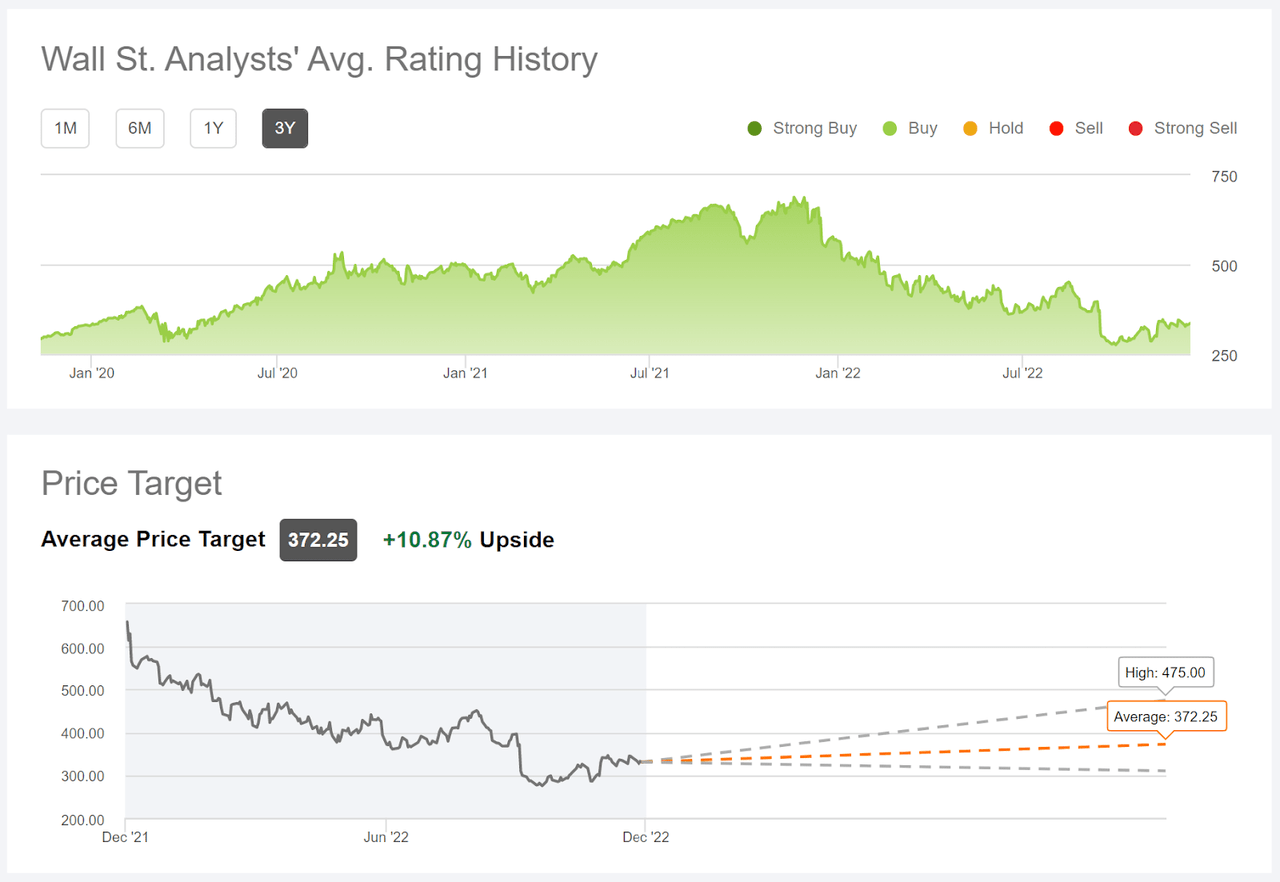
Seeking Alpha’s version of the Wall Street consensus outlook is calculated using ratings and price targets from 32 analysts who have published opinions within the last 90 days. The consensus rating is a buy and the consensus 12-month price target is 10.9% above the current share price.
Seeking Alpha
Wall Street analyst consensus rating and 12-month price target for ADBE (Source: Seeking Alpha)
The Wall Street consensus outlook continues to be a buy, although the expected return is modest. The question is whether this level of return is sufficient to justify the risk level. It is also notable that Seeking Alpha’s version of the consensus rating indicates that Wall Street analysts have, as a group, have tended to be too tolerant of very high valuations for ADBE.
Market-Implied Outlook for ADBE
I have calculated the market-implied outlook for ADBE for the 6.1-month period from now until June 16, 2023 and for the 13.2-month period from now until Jan. 19, 2024, using the prices of call and put options that expire on these dates. I selected these specific option expiration dates to provide a view to the middle of 2023 and through the entire year.
The standard presentation of the market-implied outlook is a probability distribution of price return, with probability on the vertical axis and return on the horizontal.
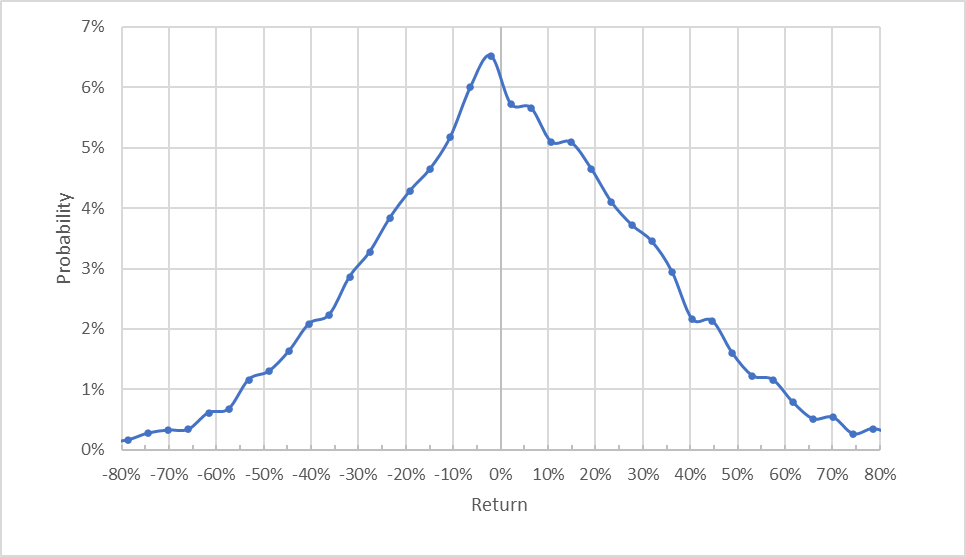
Geoff Considine
Market-implied price return probabilities for ADBE for the 6.1-month period from now until June 16, 2023 (Source: Author’s calculations using options quotes from ETrade)
The outlook to the middle of 2023 is generally symmetric with the peak in probabilities corresponding to a price return of -2%. The expected volatility calculated from the distribution is 43% (annualized), in line with the value calculated in October.
To make it easier to compare the relative probabilities of positive and negative returns, I rotate the negative return side of the distribution about the vertical axis (see chart below).
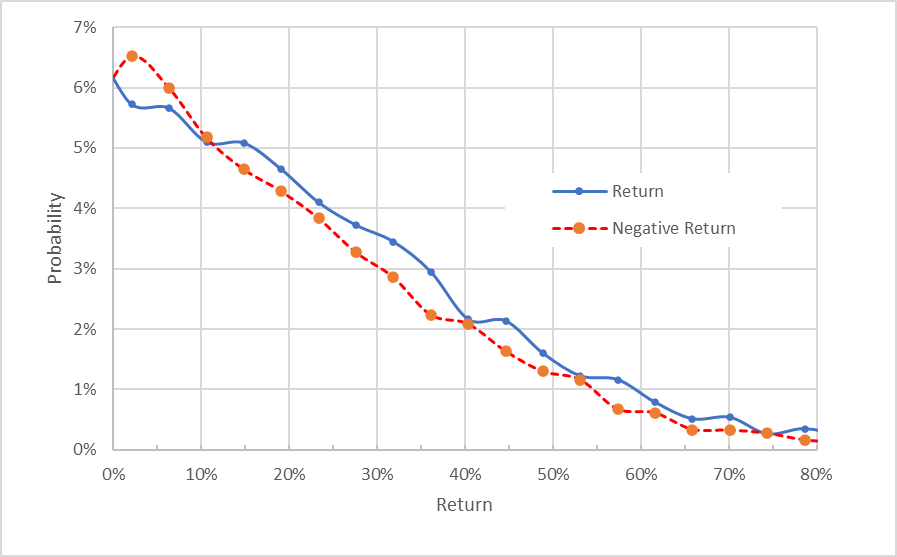
Geoff Considine
Market-implied price return probabilities for ADBE for the 6.1-month period from now until June 16, 2023. The negative return side of the distribution has been rotated about the vertical axis (Source: Author’s calculations using options quotes from ETrade)
This view shows that there’s a consistent, albeit modest, tilt in the probabilities to favor positive returns over a wide range of the possible outcomes (the solid blue line is above the dashed red line over most of the chart above). This is a slightly bullish outlook to the middle of 2023. This outlook is very similar to the outlook to the middle of 2023 that I calculated in October (linked above).
Theory indicates that the market-implied outlook is expected to have a negative bias because investors, in aggregate, are risk averse and thus tend to pay more than fair value for downside protection. There’s no way to measure the magnitude of this bias, or whether it is even present, however. The expectation of a negative bias reinforces the bullish interpretation of this outlook.
The market-implied outlook for the 13.2-month period to Jan. 19, 2024, is predominantly neutral. The probabilities of negative returns are higher than those for positive returns over a range of the most probable outcomes (the dashed red line is above the solid blue line over most of the left 1/3rd of the chart below). For the middle range of possible outcomes (the middle 1/3rd of the chart below), the probabilities of positive and negative returns match up quite closely. For the largest-magnitude returns (the right 1/3rd of the chart below), the probabilities of positive returns are elevated, but these outcomes are expected to occur with a very low overall probability. Given the expectation of a negative bias in the market-implied outlook, I interpret this view as neutral. The expected volatility calculated from this distribution is 41%.
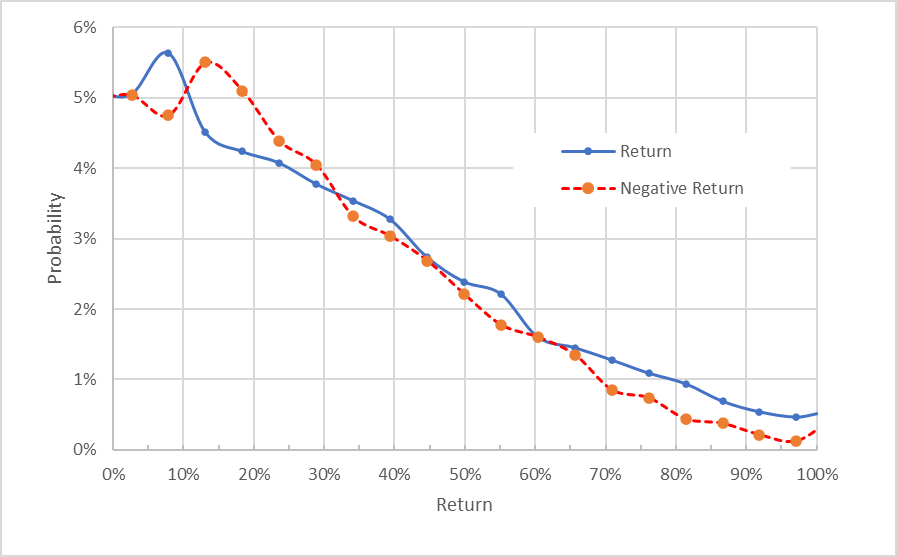
Geoff Considine
Market-implied price return probabilities for ADBE for the 13.2-month period from now until Jan. 19, 2024. The negative return side of the distribution has been rotated about the vertical axis (Source: Author’s calculations using options quotes from ETrade)
The market-implied outlook to the middle of 2023 is favorable and is very similar to the results I calculated in October. The outlook through 2023 is neutral. The expected volatility is consistent between these two outlooks, at 41% to 43%.
Summary
Adobe is a global leader in digital design and document management. The shares got very pricey in 2021, but have fallen 49% over the past 12 months. A significant part of this drop was due to the market’s negative reaction to the pending acquisition of Figma. The company has delivered notably consistent earnings growth in recent years. Today’s share price relative to current and estimated earnings makes the shares look quite attractive. The Wall Street consensus rating on ADBE continues to be a buy, but the consensus price target corresponds to a return of only about 10% over the next year. As discussed in an earlier section, I look for an expected return that’s at least ½ the expected volatility for a stock to be a buy. With expected volatility of around 42%, the Wall Street consensus price target suggests that ADBE does not provide an attractive return for the level of risk. The market-implied outlook to the middle of 2023 is bullish, consistent with the outlook from mid-October. The market-implied outlook to mid-January of 2023 is neutral. With the Wall Street consensus buy rating and the bullish market-implied outlook to the middle of next year, I’m maintaining my buy rating on ADBE as we approach the Q4 report.
Disclosure: I/we have a beneficial long position in the shares of ADBE either through stock ownership, options, or other derivatives. I wrote this article myself, and it expresses my own opinions. I am not receiving compensation for it (other than from Seeking Alpha). I have no business relationship with any company whose stock is mentioned in this article.