Summary:
- General Motors released its Q4 and full-year 2023 results, exceeding market expectations and its own guidance.
- GM’s revenue for 2023 was $171.8 billion, with a net income of $10.1 billion and adjusted EBIT of $12.4 billion.
- The company’s tight margins and high costs remain a challenge, but it has shown adaptability in controlling expenses compared to its competitors.
Editor’s note: Seeking Alpha is proud to welcome Pedro Goulart as a new contributor. It’s easy to become a Seeking Alpha contributor and earn money for your best investment ideas. Active contributors also get free access to SA Premium. Click here to find out more »
jetcityimage
My Thesis
First of all, I’m not ‘bullish’ or ‘bearish’ towards General Motors (NYSE:GM). The company has managed to maintain itself over the years despite the intrinsic competition that affects the automotive sector with tight margins. The decline in its market share, in my opinion, appears to be irreversible, however, this decline will be slow, gradual and, at some level, stationary. Dividends have shrunk by half and the outlook for the next decade remains unpredictable. But despite everything, I explain in this article that, despite the scenario being unfavorable for GM, it manages to maintain stability and predictability of Net Profit, unlike other peers such as Ford (F).
Scenario
On January 30, General Motors released its fourth quarter and full year 2023 results to the general public. Investors were keen to understand a little more about the intrinsic dynamics of GM and the automotive sector as a whole, after a slightly more positive third quarter than the rest of the year. Various labor imbroglios and intrinsic problems in the sector plagued and penalized its share prices in a sector that is already known for being excessively competitive and with tight margins
Yes, the economy remained resilient and performed amazingly resiliently if we take into account all the monetary tightening perpetrated by the Federal Reserve to contain inflationary pressures, there was significant growth especially in GDP and in the services sector. This resilience, caused by congestion in traditional monetary policy channels as a result of previous loosening, may have altered the economy’s reactive sensitivity to praxeological stimuli.
But despite all this resilience, it seems that for “orthodox” companies in the automotive sector the situation is not so positive, and the investor distrust was made clear by the low multiples at which they were being traded in comparison to the rest of the market. The increase in cost pressure, as we’ll see later in this analysis, is having a frontal impact on these companies, which have high COGS costs and very tight net and, above all, gross margins. In this way, the intensity of sector competition prevents pricing with a wider margin. Companies that maintain a certain dominance, a lasting competitive advantage, are more free to price without having to use their peers as a strict benchmark
Market Expectations And GM Guidance
Given this scenario, what were Wall Street’s expectations?
In the fourth quarter, many analysts predicted a 10.3% reduction in Gross Revenue, as well as a drop in adjusted profit compared to 2022 of around 45.3%. Many media outlets also reported a forecast that EPS in the fourth quarter would reach levels of $1.16, in line with the quarterly results from earlier this year.
In addition, many investors are looking to understand how the automaker’s cost management will cope with the additional costs arising from the union agreements. As I’ve said before, even before this, GM’s margins were already very tight (they’re less tight than Ford’s, of course), but it will still take efficient management of them to come out of this marginal increase unscathed. In any case, either from spillovers in costs or in production, it will be imperative to succeed in controlling your costs more efficiently if you want to maintain your market share.
GM itself has already disclosed in its third quarter guidance expectations adjusted on the basis of exogenous events. In the report in question, the company presented an annual forecast for net income attributable to shareholders of between $9.1 billion and $9.7 billion, or Earnings Per Share (EPS) ranging from $6.52 to $7.02. Additionally, GM’s estimates predicted adjusted earnings before interest and taxes of between $11.7 billion and $12.7 billion, with an adjusted EPS of between $7.20 and $7.70.
The share buyback program, which was estimated at around $10 billion, combined with the effects from the strikes, did not encourage the market much, even when the forecast was that the free cash flow projection was between $10.5 billion and $11 billion. For many who were interested in dividend payments, it seems that the times before the pandemic are behind us.
The share consolidation resulting from the buyback program will have its success defined from the threshold at which GM is able to maintain enough cash to increase its remuneration via dividends. Although the company is positioned for a flat/strained growth trajectory, it will need to define how it can remunerate shareholders in a sustainable way for the times to come.
In The End, It Was Better Than Expected
After the initial considerations, where we evaluated the market’s proxy in relation to GM’s projections, we now move on to analyzing the reported results.
In the fourth quarter of 2023, GM presented numbers above what the market expected, and in line with its guidance from the third quarter of last year. Its revenue in the fourth quarter was $43.0 billion, resulting in net income attributable to shareholders of $2.1 billion and an adjusted EBIT of $1.8 billion. These results positively surprised most analysts, exceeding expectations, especially from a revenue perspective, exceeding estimates by more than 11%.
Despite a marginal improvement in the fourth quarter compared to the third, it is important to indicate that due to the effect of intense competition in the sector, GM has been losing market share year after year. And what’s worse, GM lost market share compared to last year in all its operational centers, as shown in the following table:
GM’s market share in 2023 (GM)
For the full year 2023, GM reported revenue of $171.8 billion, net income attributable to shareholders of $10.1 billion and adjusted EBIT of $12.4 billion. As we can see, GM surpassed both analysts’ estimates and its own estimates, as we can see in the table below:
Comparison of the result reported in 2023 with the guidance for 2023 and forecasts for 2024 (GM)
It is important to highlight, before we actually analyze GM’s results, that we focused on annual results, seeking to identify long-term trends. This will allow us to have a consistently regular understanding of metrics that provide a glimpse into your long-term performance, the company’s results over time and its implemented strategies, as well as the analysis of your peers.
Performance in 2023
Revenue
Let’s begin our analysis of the Income Statement with General Motors’ Gross Revenue. During 2023, the company recorded gross revenue of $171.842 billion, establishing sustained growth from its organic operations of 9.6% compared to the previous year.
By broadening our view and calculating the CAGR of revenue over the past six years, we can identify a consistent upward trajectory. Revenue increased from $147.05 billion to the current $171.842 billion. When applying the CAGR formula, this analysis reveals an average annual growth rate of approximately 8.26%, with an average year-over-year growth of 4.5%.
Let’s compare this growth in Gross Revenue with other GM peers. Ford, for example, presented a gross revenue CAGR of approximately -0.7%, with an average growth in Gross Revenue of a paltry 0.48% year on year since 2015. The CAGR (Compound Annual Growth Rate ) of Toyota’s (TM) Gross Revenue, considering the last five years, is approximately 7%, with year-on-year growth of 5.91% p.a.
As I say in almost every analysis, a strong Gross Revenue is not synonymous with profitability, but it can be a first step.
COGS, What We Need To Keep An Eye On
Analyzing General Motors’ average COGS over the last five years, we have an average of US$114.026 billion, which represents approximately 66% of the company’s entire Gross Revenue. Ford allocates approximately 85% of its Gross Revenue to cover COGS (Cost of Goods Sold). Although these numbers do not represent much for our analysis, based on their percentage comparison with Revenue, we found a key indicator to understand how COGS is squeezing GM’s margins so much.
Many value investors consider the gross margin metric as a key indicator for identifying lasting competitive advantages. But how does this happen in practice?
When certain companies that have long-lasting competitive advantages price their products or services, they have relative freedom to set their pricing despite other players in the industry, and, thanks to the resistance of their revenues to these pricing strategies, they are able to create a comfortable margin between Revenue and Gross Profit.
In other words, they do not need to give up part of their slice of Gross Profit in a trade-off to gain market share.
Furthermore, the sober consideration and use of COGS, even maintaining or increasing your revenue, is based on a key concept in terms of cost management: Efficiency. The use of indirect goods, arising from an increasingly distant causal link, through technology applied to production processes can cauterize the possible expansionist impetus of COGS.
GM and F Gross Margin, in percentage (Author)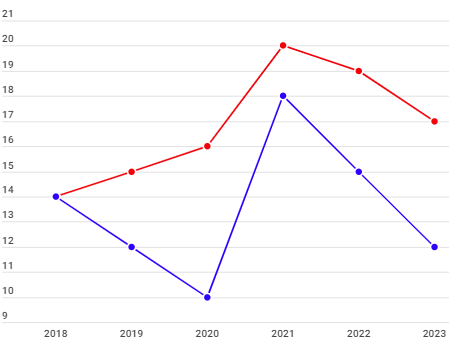
When we analyze GM’s Gross Margin over the last five years and calculate the CAGR, we find a multiple of 6.83%. This way, we can at least infer that we have at least found a positive gross margin trajectory.
But that doesn’t mean much, the tight margins show that operating costs put pressure on GM’s margins year after year. And this is not an intrinsic obstacle for GM, but an inherent problem in the automotive sector. Ford’s Gross Margin, compound annual average of about -2.18%.
For comparison purposes with a disruptive company such as Tesla (TSLA), its Gross Margin in the last five years was 16%, 21%, 25%, 25% and 16%. Even with an increase in revenue, in 2023 Tesla saw its cogs rise 30.53%, squeezing its gross margin that year. The volatile trend of increasing COGS also raises concerns about maintaining gross margins that match the company’s growing growth, as expansionary pressures on labor costs and inputs imported from abroad also arise.
Let’s use the Buffett parametric formula with these three companies and check whether, through the value investor’s perspective, we find quantitative evidence in the historical averages of the gross margins of the companies in question. Remember that comparing historical gross margins from the perspective of pre-defined multiples can be useful in verifying lasting competitive advantages and, in some way, can demonstrate how much is historically retained by COGS:
Average Gross Margin of the last five years from Buffett perspective (Author)
How do we interpret this data?
A gross profit margin of less than 20% indicates a company that does not have a competitive advantage in the medium/long term and that is barely sustainable in a highly competitive sector. In other words, these companies do not have the capacity to stand out positively when compared to other companies that have wider margins. This does not mean that these companies cannot surpass themselves in this period of time, but rather establish comparative dominance with the major players in the sector.
Both GM and Ford do not have good historical average Gross Profit Margin multiples. Even in the case of GM with the increase in Gross Revenue, there is no increase in the multiples analyzed. Tesla, on the other hand, has been showing a Gross Margin with a slightly less worrying dispersion (if we disregard the year 2023 and project growth based on what we saw in 2021/2022).
When we stock pick for the buy-side, we essentially look for gross profit margins greater than 40%. This is the ideal situation. Now, of course there are great companies with tighter gross margins, but this is an indication that this company in question does not necessarily have a competitive advantage, relatively speaking.
Therefore, based on my assessment, GM (despite not being in precarious situations) should begin implementing COGS smoothing policies as soon as possible. And this becomes more evident when we adopt cyclical perspectives not only of the growth of COGS, but also of the decrease in future revenue. After all, resilience will not last forever, economic cycles come and go, regardless of monetary policy, cycles of accumulation and realization occur independently of a monetary authority, they are praxeological.
Even though the domestic inflationary momentum has been contained, macro-based uncertainties still remain in the exogenous environment. Therefore, a probable second wave of inflationary movement should not be ruled out. And if that happens, the costs, from the producer’s end, could resurface. These are just guesses, but either way, containing operational costs is something that should not be underestimated.
The idea is to always pay attention to SG&A expenses, research and development costs and high interest costs on debts. In the case of GM, its biggest problem is controlling COGS, and, when we put into perspective a marginal increase in operational labor costs, we have to consider whether the marginal growth rate of revenue in the near future will be able to cover this possible macro spillover.
Selling General And Administrative Expenses: How To Evaluate?
Now, let’s turn to SG&A. What will be our maximum? Our perspective here is that when a company’s sales are significantly dependent on SG&A for support, it indicates a vulnerability and strict dependence on capital expenditure to complete sales and manage operations.
SG&A expenses can often seem harmless when viewed from the perspective of a company like GM. It turns out that compared to COGS since GM is a company in which almost all of its costs are based on capital goods and inputs for its goods manufacturing operations, the SG&A analysis may seem less important. However, as shareholders, any and all deductions from gross profit are an additional deduction that could be paid in the form of dividends, or even repurposed for GM’s share buyback program.
More than the containment and sobriety of SG&A expenses, we must value their adaptability. Containment or correct handling of SG&A expenses can often contain the expansionist impetus of COGS, which, due to the fact that it is intrinsically linked to production and fundamental to the achievement of the company’s core activity, cannot be managed with precision that SG&A can.
Therefore, when we think about SG&A adaptability, we ultimately think about maintaining constant profit for reinvestment in the business and shareholder remuneration.
What we see in competitive industries is the dependence on SG&A spending to establish a certain type of dominance in the markets where the company operates. Therefore, companies that need, for survival purposes, to have high expenditure on this type of expenditure, can be phenomenally identified as intrinsically non-dominant, and, every year, they spend a lot of money to maintain their market share.
Let’s examine the SG&A of GM, Ford and Tesla compared to their respective Gross Profits in the table below. Remembering that here we use a historical average with a limited sample of a decade:
Percentage of Gross Profit that is used in SG&A historically (Author)
The table above shows how much each company uses its gross profit in SG&A. From these numbers, we can have an expanded view of this dynamic in the sector. Because the gross margin is already tight, any expenditure on SG&A, even more so if it remains constant and not adaptive, will be more significant for the company’s profitability.
Here, I highlight Ford’s terrible numbers, which spends an average of 90% of its entire Gross Profit on SG&A expenses. And this becomes more evident when we note that the average growth rate in Ford’s SG&A spending averages -0.8% per year. In other words, Ford’s SG&A expenses are not increasing, they remain stable, however, they are not malleable when adjusting to revenue conditions. A marginal decrease in revenue, as we saw in 2020 and 2021, did not translate into a reformulation aimed at preserving the company’s profitability in that period. COGS in the same period, as it is directly related to the costs of productive operations, showed a retraction, following gross revenue
The good news for GM is that it has been reducing year after year the amount of its Gross Profit spent on SG&A during the sales contraction phase. In other words, GM demonstrated greater adaptability than Ford in controlling SG&A expenses in times of lower revenues. I’m not saying this is a lasting competitive advantage, but at least it’s an important comparative advantage.
Tesla, in the last three years, managed to boost its numbers without depending on high SG&A expenses. Yes, your spending on this type of expense doubled from 2019 to 2023, but your income almost quadrupled. In terms of SG&A/Gross Profit, we can see a stabilization trend at levels of 45%.
When we are looking for healthy SG&A to Gross Profit multiples, I give preference to companies that have an SG&A/Gross Profit ratio of less than 30%, this is the ideal multiple. In many situations, however, we can find companies with multiples between 30-65% that are profitable. Everything will depend on your ability to flexibly control SG&A when circumstances tighten your profit margins.
Research And Development: What Are We Looking For?
Other important points that we can highlight here are: GM’s investments in R&D in recent years, totaling a CAGR of 6.68%, while Ford’s have been declining at a rate of -1.44% in recent years, pressured by its tiny margins and Tesla’s 28.65%, in this case, R&D expenses are supported by the increase in your Gross Profit over time.
On average, GM spends around 30% of its Gross Profit per year on R&D. Ford spends about 35%. Although your R&D spending remains flat/declining over time, which appears to be a fixed amount in your budget, this number is not flexible, with 2020 R&D spending rising to 55% of your gross profit. Tesla’s R&D expenses grow year on year, but they are safeguarded by the increase in Gross Profit, ranging from 15-20% on average.
Despite the sector being highly dependent on R&D spending, the three companies appear to maintain relatively constant levels of this spending. Ford, however, has proven particularly problematic in adjusting its costs in times of weak revenue. GM, despite maintaining a more stable revenue rotation, appeared to control its R&D/Gross Profit margins between 2019/2020, when its margins became tighter.
Here, we don’t care much about the expansion/contraction of R&D spending, but whether this spending is keeping up with the growth trend in margins. In our analysis, we saw that Ford does not have control over its expenses when its revenues decrease, GM, in turn, has relative control, not very accurate and assertive, but much better than Ford’s. About Tesla, it’s still too early to say, but the year 2023 could have been a turning point to keep an eye on in the coming quarters.
Net Profit: Is It Profitable Or Not?
Now, getting to the crucial point for GM shareholders: Net Profit. First, let’s analyze whether there is any historical growth trend. This way, we will be able to evaluate the consistency of these companies. The table below shows the growth trend in Net Profit over the last five years:
Net profit of the three companies analyzed, in billions (Author)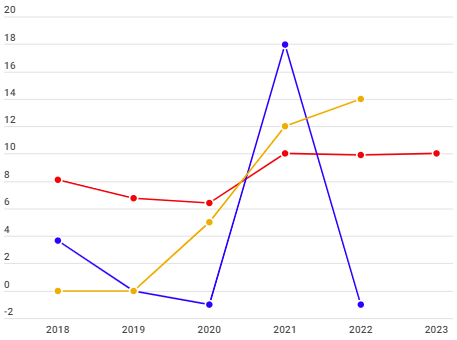
First of all, it is important to highlight that in 2021, Ford recorded an amount of $15.77 billion in Non-Operating Revenue. Therefore, for a balanced analysis of the Net Profit trend, we must disregard this result for the purposes of evaluating profitability.
When examining the graph, a “red flag” immediately stands out for Ford, which presented inconsistent results during the analyzed period.
On the other hand, GM, despite recording a marginal increase in Net Profit in 2021 and presenting relatively stable profits in recent years, remember, it is losing market share, in an extremely competitive sector like this, GM will need to bear more SG&A costs to maintain some type of comparative advantage with more traditional automakers. The pressures arising from greater expenses with COGS, which could impact your margins in the future, as already mentioned in the section of the text where I talked about COGS, but. However, I do not identify significant threats for GM in the very short/short term.
Tesla, since 2019 (when its last annual loss was reported) in which it had a loss of 870 million, has grown in net profit year after year, on average around 256.71%. These numbers are impressive, even when we put into perspective the “plateau” that its net profit seems to have reached, at least for now.
Let’s analyze the Net Profit Margin comparatively:
GM, F and TSLA Net Margin, in percentage (Author)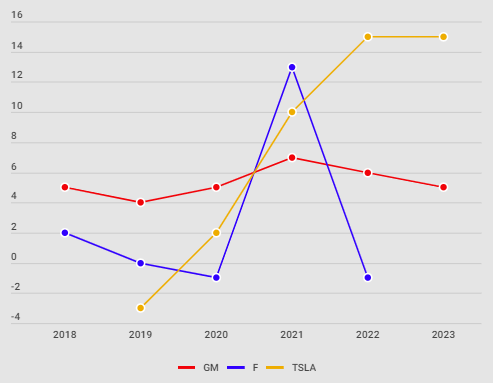
First of all, we need to understand that understanding the movement of margins is a more crucial task than analyzing just Net Profit, since in Net Profit Margin we can measure the operational efficiency of the company as a whole. Companies with durable competitive advantages have a higher percentage of net profit relative to total revenue than their competitors. Generally, I tend to explain this phenomenon, predominantly on two distinct “fronts”:
The first lies in the ability of these companies to effectively manage their operating costs and expenses, which results in comparatively higher productive efficiency.
The other phenomenological aspect is the company’s ability to price its products with greater freedom, due to its strong intrinsic position in the market, which contributes to looser and more comfortable margins for the company to reinvest capital or remunerate shareholders.
The position in the market is achieved through a comparative advantage, always determined by the choice of consumers in a free market, this is the greatest ‘asset’ that a company can have. Regulatory advantages and circumstances are ethereal and may disappear in the dead of night. Operational efficiency follows a cycle of factors, such as: optimized production processes, efficient supply chain, constant innovation and adequate management of costs and expenses, minimizing waste.
These two factors are imperative when we are evaluating stocks with durable comparative advantages for the buy-side. In my assessment, a good Net Profit Margin ranges (depending on the industry) from 18-25% net profit. In the automobile sector, a constant net margin of 20% can be considered healthy and an indication that the company maintains a comparative advantage over the majority of its competitors.
Remembering that the aforementioned multiple is not an indication of market dominance, but rather of the health and stability of a company
Valuation
Let’s now evaluate the fair value of General Motors based on the results presented, using some valuation metrics:
Note: We will use GM’s discount rate, calculated as the cost of equity, using the formula Risk Free Rate + Beta x ERP. Currently, the discount rate is at 9.26%. The Beta, which indicates the volatility of the stock in relation to the market, is 1.14. Meanwhile, the current Risk-Free Rate, based on government bond yields, is at 4.05%, and the ERP, which measures the additional return over the risk-free rate demanded by investors, is 4.57%.
The estimate for GM, and what had been used in our ‘proxy’ for the DCF model, was a free cash flow of 11 billion dollars. I considered the values of Cash and Equivalents at $18.853 billion and Total Debt at $115.666 billion. Therefore, within our DCF model, we project three distinct scenarios:
In a pessimistic (“bearish”) scenario, we assume lower growth than expected by GM, both based on the market and the company’s guidance. In an expected scenario, we consider the projections to be in line with the expectations of the market and the company itself, without many surprises. And in a scenario. Now, in an optimistic (“bullish”) scenario, we will consider growth above that expected by the market and by the company itself.
‘Bearish’ Scenario
Taking into account the average growth expectation for the next five years, estimated at 3.45% p.a. by analysts, and the company’s guidance indicating growth of approximately 1-4% for 2024, in the most pessimistic (“bearish”) scenario, we will adopt a growth rate 50% lower than the average of these forecasts. Therefore, we will use a growth of 1% p.a. in this scenario.
‘bearish’ scenario for GM (Author)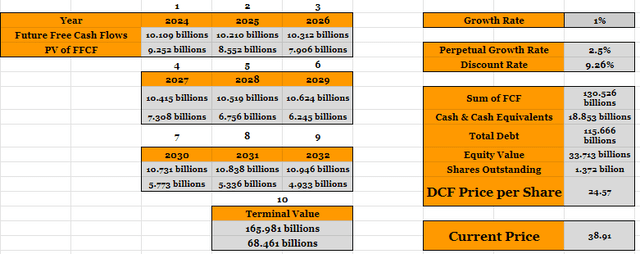
Expected Scenario
We will choose a concordance between analysts’ forecasts and the most conservative estimate of the ‘band’ indicated by the guidance. This approach will allow us to present a more cautious perspective on pricing. Therefore, let’s consider growth of 2.5% per year.
Therefore, we model a small marginal growth, taking into account the additional expenses predicted by analysts, which will be incurred mainly with COGS and VGA. This consideration reflects a realistic approach aligned with market projections and expectations.
Expected scenario for GM (Author)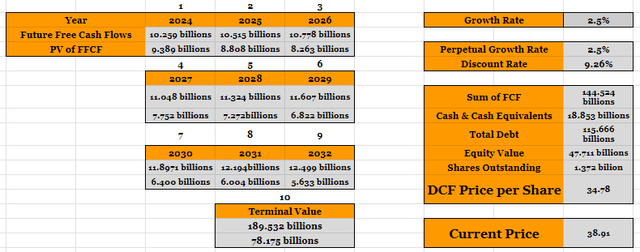
‘Bullish’ Scenario
At this point, we will consider growth of 3.5%, a forecast that I consider optimistic given the regulatory and macroeconomic scenario projected for the coming years. This approach reflects a more positive vision and is aligned with favorable prospects for the company. We have to take into account that in addition to the labor imbroglios, the Federal Reserve has not yet managed to contain wage inflation, which could continue to put more and more pressure on the company’s margins.
‘bullish’ scenario for GM (Author)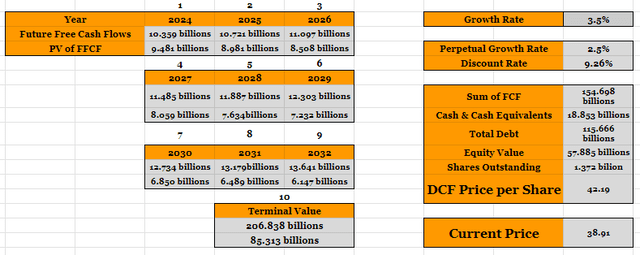
We will also use other forms of valuation, such as Peter Lynch, Benjamin Graham and Discounted Dividends.
Graham’s Model
Graham’s Model Valuation (Author)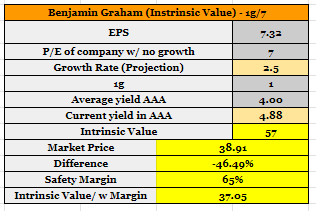
Applying a safety margin of 65%, the Graham Model indicates that the stock is very close to its fair value. I chose to use the same growth rate used in the “expected scenario” (g = 2.5%). It is worth noting that, even adopting a more conservative version compared to Benjamin Graham’s original approach, the model suggests that the share is undervalued.
Lynch’s Model
Peter Lynch’s Valuation Model (Author)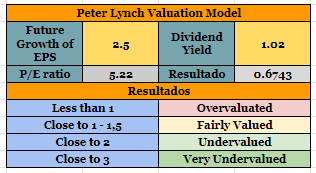
Analysis using the Peter Lynch Model, considering the P/E of 5.22 (Share price = 38.17 divided by EPS = $7.32), dividend yield of 1.02% and growth of 2.5%, indicates that GM is currently overvalued according to the Lynch’s Model.
But why is the stock close to its fair price according to the Graham Model and overbought compared to Lynch? We have to understand that each valuation method examines a different facet of the imputed data.
The Graham Model takes preponderantly into account yield conditions at the time of valuation, a “benchmark” growth rate and EPS, or Earnings per Share. Therefore, changes in the share price are not analyzed in the same way as in other models that incorporate factors such as the P/E ratio.
The Lynch Model equates its results based on the P/E ratio, the dividend yield and growth, being more oriented towards identifying opportunities in companies with growth potential and that also offer a return to shareholders through dividends. Therefore, it can react more quickly to changes in market expectations (price changes and fluctuations in expectations and present economic conditions) and the company’s endogenous prospects.
Dividend Discount Model
Dividend Discount Model Valuation (Author)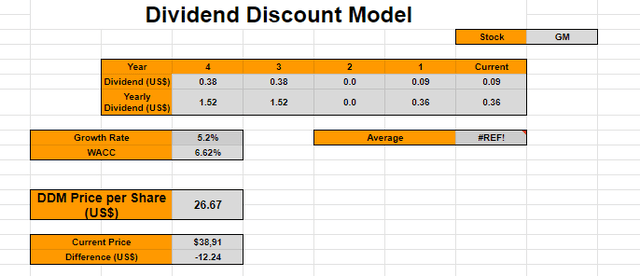
Given that GM suspended dividend payments in the years 2020/2021, we project an increase in dividends in the coming years from $0.36 to $0.38. In other words, we plan a base scenario of dividend growth of around 5% p.a. Based on this forecast, we conclude that the stock is overbought, and the fair price is estimated at $26.67.
Furthermore, it is important to highlight that the Discounted Dividend Model (DDM) operates with the assumption of a constant flow of future dividends, which may not fully reflect GM’s reality, considering recent years of interruption in dividend payments.
Definition Of Fair Value
Let’s consider the possibility of averaging different valuation methods to arrive at a more complete estimate of the share’s fair value.
Valuation analysis is a mix of art and science, therefore, if we consider the most likely scenarios, we may be able, by balancing the possible scenarios envisioned, to find a target price based on our expectations. Therefore, a ‘poetic license’ is necessary when evaluating possible scenarios and, through the average between them, we try to balance these compiled expectations.
Fair Value (Author)
Therefore, considering the content of the analysis, my target price for GM is $33.05, with a percentage margin of error of 5% (we round to the band of $31.43 -$34.73).
Conclusion
As we can see, despite being below ideal, GM’s multiples are not all bad. The company is able to maintain predictability of Net Profit and Cash Flow. We need to monitor how GM will deal with labor costs and how this will affect its remuneration to shareholders, how competition in the sector will affect its margins, the amount of investment that GM will need to spend in SG&A to obtain market share and other uncertainties that only time can tell us.
Ideally, I would like to see dividends like those of the last decade as a way of remunerating shareholders, I think the size of the company allows such payment.
Therefore, I reiterate my “Hold” opinion for GM at current price and conditions. I believe that there is an interesting window to acquire GM, close to its fair value that we found above.
If you want to be even more cautious, you can use a “safety margin”. In 2023, we had two ideal opportunities to acquire GM shares, one in May and another in November, when the company was being sold well below its fair value. Note that the price of approximately $33 was established by the market in 2022 as an important support and it continues to represent this role for GM. If you are interested in swing trading, I also recommend a buy price of $33, with the target price in a band of $40-$45.
Analyst’s Disclosure: I/we have no stock, option or similar derivative position in any of the companies mentioned, and no plans to initiate any such positions within the next 72 hours. I wrote this article myself, and it expresses my own opinions. I am not receiving compensation for it. I have no business relationship with any company whose stock is mentioned in this article.
Seeking Alpha’s Disclosure: Past performance is no guarantee of future results. No recommendation or advice is being given as to whether any investment is suitable for a particular investor. Any views or opinions expressed above may not reflect those of Seeking Alpha as a whole. Seeking Alpha is not a licensed securities dealer, broker or US investment adviser or investment bank. Our analysts are third party authors that include both professional investors and individual investors who may not be licensed or certified by any institute or regulatory body.
