
Summary:
- Google has been consistently losing market share in the Digital-Advertising market.
- The costs associated with Bard’s LaMDA learning model will diminish profit margins.
- The Other Bets segment’s continued decline in operating profit will create challenges for headwinds for future profitability.
- Google Cloud has the potential to generate higher profit margins and increase profitability in the future.
- Alphabet’s relative valuation indicates the company is trading at a discount to peers.
LICreate
The hype and attention from AI have created immense volatility for Alphabet (NASDAQ:GOOG, NASDAQ:GOOGL). AI could affect Google’s search engine dominance, margins, and profitability, especially with ChatGPT as a new competitor. Furthermore, the AI wars are not the only risk involved with the company. Alphabet has struggled in the past to maintain its online advertising market share, and the company continues to burn cash to fund unicorn projects that inevitably fail. Yet Google Cloud is steadily driving growth, and GOOG stock’s valuation is undervalued relative to peers.
Loss of Market Share
Since 2015, Google has held a dominant market share in the U.S. digital advertising space. The digital advertising space grew at a CAGR of 25.2% over the past five years, and with Google holding the dominant market share, it was able to grow search revenue by over 136%. While this is strong growth, Google underperformed the overall industry by 5% per year, and Google’s market share declined by 11% to 26.4%.
Wall Street Journal 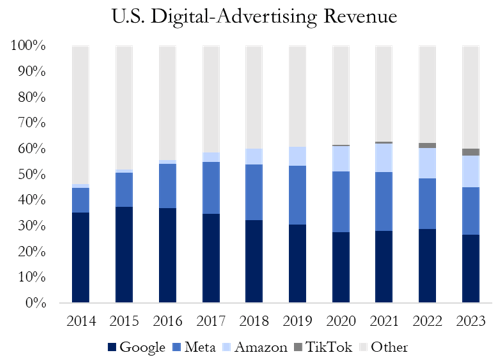
The industry has significantly changed, and Google is no longer at the forefront of growth. Apple’s new privacy policy crippled the effectiveness of Google’s ads while new entrants such as TikTok began to eat away at its market share. The fundamental changes in the industry created a window for faster growth for Walmart (WMT), Amazon (AMZN), and Netflix (NFLX). As shown by the chart below, Digital advertising spending growth will slow, providing additional headwinds for future growth. Considering these factors, Google’s market share will continue to dimmish, and growth will significantly underperform peers such as Amazon and TikTok.
Statista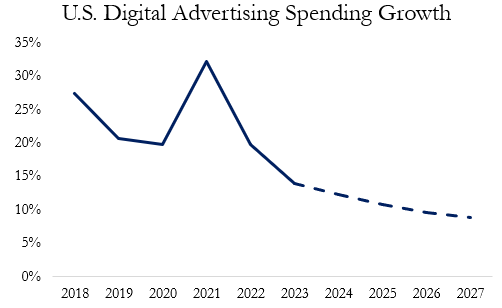
AI Wars
Alphabet has been in the spotlight recently due to Microsoft (MSFT) implementing ChatGPT into its Bing search engine. Alphabet countered this adoption by releasing its own AI, known as Bard. ChatGPT relies on NLP (Natural Language Processing), which trains ChatGPT on historical data such as books, articles, and websites. Bard is built on LaMDA (Language Model for Dialogue Applications), which can pull real-time data from the web instead of using historical data. This slight difference gives Alphabet an advantage in the long run as its AI searching can be implemented for more real-time data.
One of the risks associated with the AI wars is Google losing its market share. Google retains around 85% of the search engine industry. The dominance of Google’s brand name and the habitual actions of its customers has allowed it to retain market share. However, Microsoft’s addition of ChatGPT into Bing poses considerable risks of losing market share. While Google will not likely lose much of its market share, a 1% drop could equate to over $500 million in lost revenue. Small losses in market share to Bing could add up quickly, diminishing overall growth.
Statista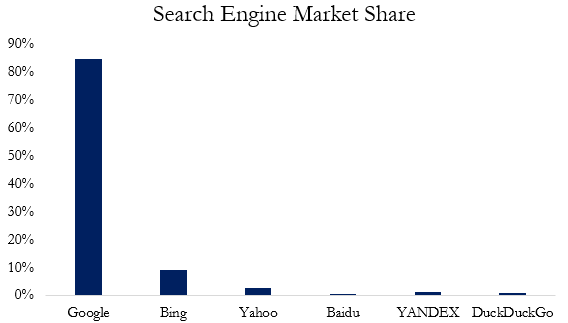
The second and most important risk with the AI wars is the cost of switching searches to Bard. Theoretically, if Google could retain its 85% market share and Microsoft’s implementation of ChatGPT fails, Google still faces significant reductions to its bottom line. As shown by the chart below, if Google were to utilize Bard for 50% of search queries and of those searches, Bard returned an average of 50 words, it would increase expenses by $6 billion. Bard will become more efficient, expenses will significantly decrease, but near-term margins will diminish. AI wars will crunch top-line revenue through loss of search engine market share and diminish profitability through higher costs associated with Bard’s LaMDA model.
Reuters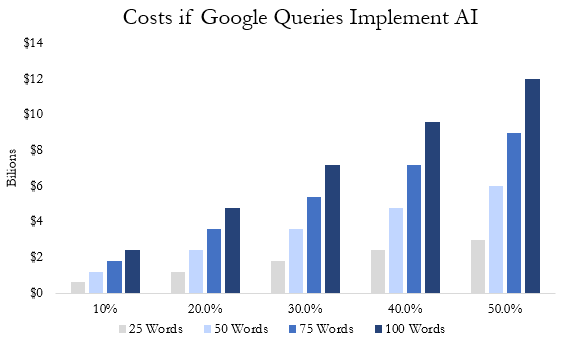
Cash Burning
Alphabet is considered a cash cow generating an FCF margin above 15% for the past three years. The company generates extraordinary margins and cash flow from its main business lines. However, over recent years, Alphabet has begun burning cash on unicorn projects such as Waymo, Stadia, and Google Glasses. Individually, Google Glasses never gained widespread adoption and ultimately was a failure. Google Glasses had issues with bans due to privacy concerns, it was too expensive for customers; it had limited functionality, an unappealing design, and poor marketing. Waymo, Alphabet’s self-driving car, faced industry-wide problems, with self-driving cars struggling to become mainstream. Also, Waymo faced safety and liability concerns along with an expensive process. Finally, Stadia, a cloud gaming service, struggled greatly with a limited game library, games lagging due to being streamed over the internet, and Alphabet cutting production of its in-house game development studios.
These items are considering Other Bets within Alphabet’s financial statements. The chart below shows that Other Bets have been burning cash and producing significant losses. Since 2017, losses associated with Other Bets have increased 122% to $6 billion. With economic risk rising, Alphabet should focus its cash flow on more profitable and growth-oriented segments such as Google Cloud.
Bloomberg, Alphabet 10-K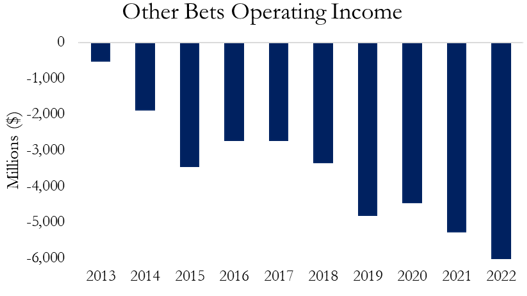
Google Cloud Expansion
Google Cloud is an opportunistic opportunity for growth. This segment has consistently grown revenue by more than 30% and is becoming profitable. The chart below shows that Google Cloud has quickly increased its overall revenue and is trending to become profitable by late 2023. Over the long term, this segment will drive profitability and growth for Alphabet.
Refinitiv, Alphabet 10-K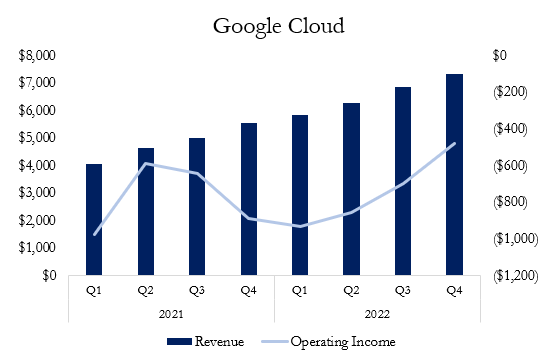
Google Cloud is growing rapidly, but it has a smaller market share compared to competitors. As shown by the chart below, Google Cloud holds around 13% of the cloud computing market share, which has grown from nearly 7% in 2018. However, as shown below, Microsoft Azure’s growth and market share has outpaced Google Cloud. Additionally, Amazon’s AWS has retained its overall market share and consistently grew revenue by over 30%. The overall cloud computing market is slowing, and Azure, AWS, and Google Cloud’s revenue growth is beginning to ease, presenting a problem for Amazon, Alphabet, and Microsoft’s valuations.
Synergy Research Group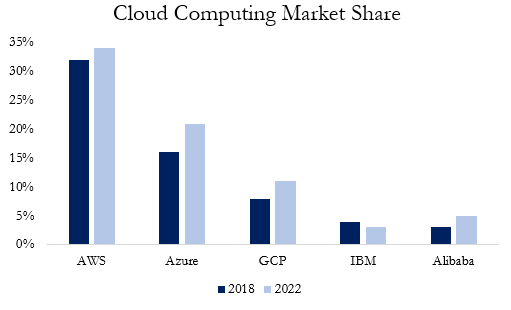
Valuation
I recommend a hold for Alphabet with a 12-month price target of $106.18 derived from a discounted cash flow model (50%), EBITDA exit multiple (20%), and a relative valuation (30%).
Author Estimates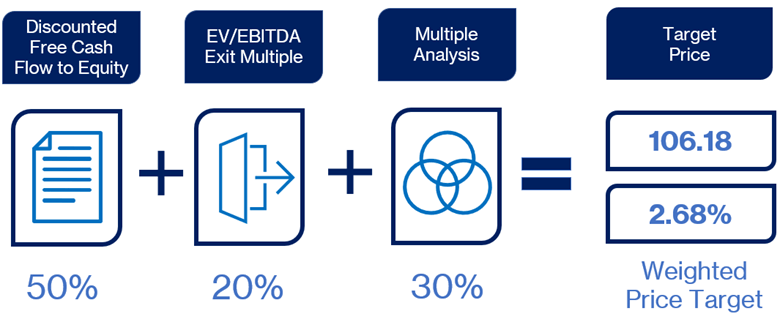
I forecasted Alphabet’s revenue for each segment and further simplified its google services segment. I estimated google services revenue to slow in 2023 as ad demand has been bleak. For the remaining years, I forecasted growth below the overall online ad industry, with google services revenue generating a 5-year CAGR of 7.09%. I projected continued revenue growth for google cloud but much slower than the historical rates of 30%. To reflect these estimates, I forecasted an 8.17% 5-year CAGR from 2022 revenues. This revenue growth captures the resilient brand of Google and the expansion of Google Cloud.
Author Estimates, Bloomberg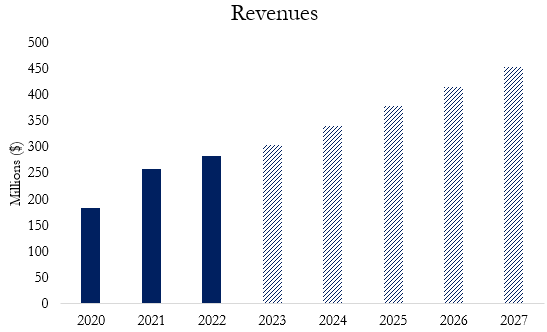
I estimated that Alphabet would improve its margins (Operating margin increase of 300bps), reflecting cost efficiencies and better cash flow utilization. I estimated a slight decrease in margins in the short term (2023-2024) and margin expansion in (2024-2025). I expected G&A and R&D to decrease as a percentage of revenue over this time frame. However, I estimated cost of revenue as a percentage of sales to initially increase due to the adoption of Bard.
Author Estimates, Bloomberg, Alphabet’s 10-K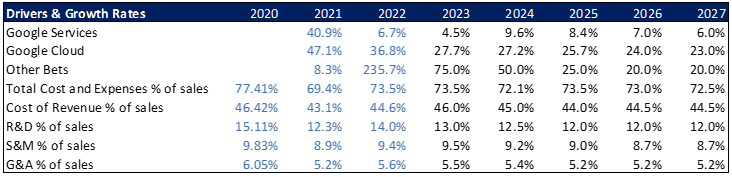
I used a terminal growth rate of 2.65%, representing the long-term upside potential. For the WACC calculation, I arrived at a WACC of 8.39%. I calculated the risk-free rate by using the 10-year treasury. The cost of equity was 8.48% generated from the CAPM formula. The market risk premium was the 15-year average return of the S&P 500 adjusted for inflation. The cost of debt was calculated by adding Alphabet’s debt rating implied corporate spread to the risk-free rate.
Image created by author with data from WSJ, Bloomberg (Author Estimates)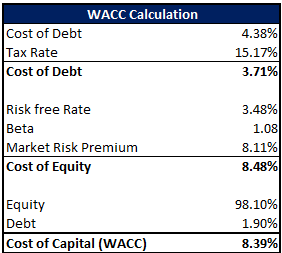
The discounted cash flow model produced a price target of $102.06. I ran a sensitivity analysis varying the WACC and terminal growth rate. As shown by the graph below, it produces a slightly skewed price target towards the downside.
Author Estimates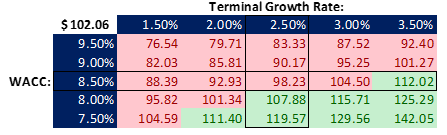
For the relative valuation, I arrived at a price target of $108.66 derived from the average of the below multiples. The competitors chosen are of similar size and compete directly with one or all of Alphabet’s segments. Due to the industry Alphabet operates in, competitors’ valuations can be extreme. Therefore, I ignored the outliers (shown in red) to get a better estimate of the multiples of competitors.
Bloomberg, Refinitiv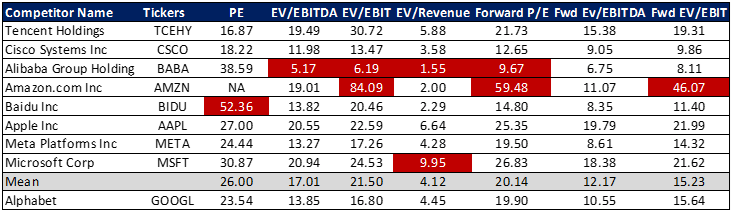
From a relative valuation perspective, Alphabet is considerably undervalued, trading below the average of its peers in 5 of 7 multiples. Specifically, current EV/EBITDA and EV/EBIT multiples indicate that Alphabet is trading at a significant discount. The tornado analysis shows that Alphabet is trading towards the bottom of current EV/EBITDA, EV/EBIT, and P/E. However, looking at the forward multiples, Alphabet is trading in line with competitors’ averages.
Bloomberg, Refinitiv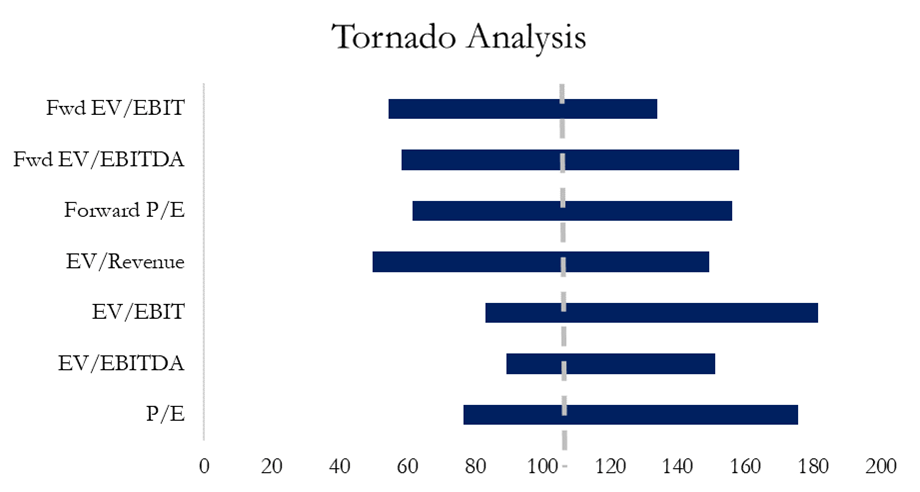
Conclusion
Alphabet faces significant risks moving forward from past ad and cash spending trends. The company’s most profitable segment could generate smaller margins and lose market share. On the other hand, Google Cloud could drive future growth, and Alphabet’s valuation looks attractive compared to its competitors. In conclusion, Alphabet’s valuation is attractive compared to peers, but limited upside and high uncertainty with AI warrant a hold for now.
Disclosure: I/we have no stock, option or similar derivative position in any of the companies mentioned, and no plans to initiate any such positions within the next 72 hours. I wrote this article myself, and it expresses my own opinions. I am not receiving compensation for it (other than from Seeking Alpha). I have no business relationship with any company whose stock is mentioned in this article.