
Summary:
- Income investors shouldn’t forget that hyper-growth stocks are valuable and can turbocharge long-term income.
- Google, Meta Platforms, and two Ultra-Yield Ultra SWANs in the last 11 years beat the market with 16% annual returns while delivering 26% annual income growth.
- Going forward, they yield a very safe 4.2% yield, 14% growth potential, and 15% to 20% expected income growth, doubling your dividends every 3 to 5 years.
- Meta’s growth outlook has doubled in the last few months, powered by fantastic cost-cutting and overcoming iOS data issues to successfully monetize Reels.
- Google’s growth outlook is up 30% since it overcame Microsoft Bing’s challenge to its search dominance, and it has only further widened its moat with the best AI-search bot on the market. Meta is now growing about 25% and Google 18%, and both are Buffett-style “wonderful companies at fair prices” with 45% to 65% upside by the end of 2025.
master1305
Meta Platforms, Inc. (NASDAQ:META) and Alphabet Inc. (NASDAQ:GOOG, NASDAQ:GOOGL) aka Google are beloved growth stocks, and for good reason.
YCharts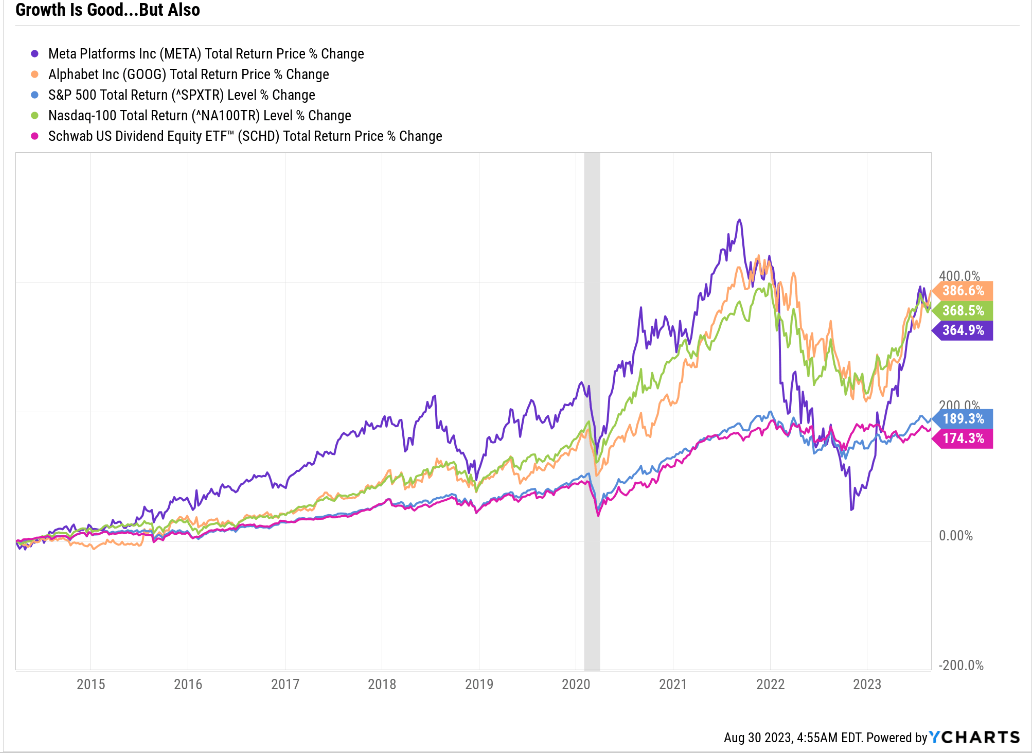
Many people will say, “Dividend Sensei has no business talking about growth stocks that pay no dividends.”
To which I respond with…
Historical Returns Since 2012
Portfolio Visualizer Premium 
British American Tobacco (BTI) and TC Energy (TRP) are both trading near their best valuations in 25 years!
- It’s The Best Time In 23 Years To Buy 8% Yielding TC Energy
- Buy Like Buffett: British American’s 9.3% Yield Is The Highest In 23 Years.
But guess how that happens? By sales, earnings, cash flow, and dividends going up while the price doesn’t. For 11 years, investors in BTI and TRP made no money adjusted for inflation.
If you aren’t willing to own a stock for ten years, don’t even think about owning it for ten minutes.” – Warren Buffett.
Even the great Buffett might struggle not to sell in disgust after 11 years of flat returns.
But if you combined ultra-yield Ultra SWANs like BTI and TRP with GOOG and Meta? Hyper-growth Ultra SWANs? Then you beat the market during one of the hottest tech bull markets in history.
How much FOMO did you feel? How tempted were you to sell BTI and TRP out of pure disgust even though they were doing exactly what management said they would, and their fundamentals remained sound and their thesis intact?
Portfolio Visualizer Premium 
The average rolling return of hyper-growth + ultra yield beat the market in every time period: no FOMO, no selling in disgust, no breaking the income compounding cycle.
No FOMO = Buy And Hold Ultra-Yield As Long As It Takes To Get Rich
Portfolio Visualizer Premium 
What do you think is easier for an investor to do? Own BTI or TRP in terrible bear markets that last for years? Just keep buying and DRIPing and ignore all the bears screaming how these are value traps. All while the S&P screams higher seemingly every day?
Or owning hyper growth along with ultra-yield resulting in periods of only minor underperformance at worse and usually identical or better returns to the market?
Oh, and let’s not forget this.
Growth + Yield = Max Dividend Growth And Income Over Time
Portfolio Visualizer Premium 
If you’re in your 80s or 90s and don’t have any kids or don’t plan to leave your money to anyone, then pure ultra-yield blue-chips are fine.
If you are in your 70s and thus have a 30+ year time horizon or want to leave your heirs incredible income-generating power, then hyper-growth + ultra-yield is the most powerful strategy you can use.
2013
- BTI: 4.7% yield
- TRP: 4.5% yield
- BTI + TRP + GOOG + META: 2.2% yield
2022
- BTI: 10.7% yield on cost = 9.6% income growth
- TRP: 10.6% yield on cost = 10.0% income growth
- BTI + TRP + GOOG + META: 17.1% yield on cost = 25.6% income growth.
Some key takeaways. Anyone who says BTI and TRP are “value traps” because they have been flat for a decade is factually incorrect.
No investment that generates double-digit income growth for a decade while not losing money can be a value trap.
Second, anyone who says “income investors should own only dividend stocks” ignores the hyper-income compounding power of growth + yield.
Now, let me deliver on the promise of this article’s title, showcasing why Google and Meta combined with BTI and TRP are a great way to earn an X% yield today while generating around X% to Y% long-term income growth.
How To Earn 4.2% Yield On GOOG and Meta And Potentially Change Your Retirement Future
| Investment Strategy | Yield | LT Consensus Growth | LT Consensus Total Return Potential | Long-Term Risk-Adjusted Expected Return | Long-Term Inflation And Risk-Adjusted Expected Returns |
| Meta | 0% | 28.70% | 28.7% | 20.1% | 17.8% |
| Meta + GOOG + BTI + TRP | 4.2% | 14.6% | 18.8% | 13.2% | 10.9% |
| Alphabet | 0.0% | 18.20% | 18.2% | 12.7% | 10.5% |
| TC Energy | 7.8% | 7.00% | 14.8% | 10.4% | 8.1% |
| British American Tobacco | 8.9% | 4.60% | 13.5% | 9.5% | 7.2% |
| Schwab US Dividend Equity ETF | 3.6% | 9.70% | 13.3% | 9.3% | 7.1% |
| Nasdaq | 0.8% | 11.2% | 12.0% | 8.4% | 6.1% |
| Vanguard Dividend Appreciation ETF | 1.9% | 9.7% | 11.6% | 8.1% | 5.9% |
| REITs | 3.9% | 7.0% | 10.9% | 7.6% | 5.4% |
| Dividend Champions | 2.6% | 8.1% | 10.7% | 7.5% | 5.2% |
| Dividend Aristocrats | 1.9% | 8.5% | 10.4% | 7.3% | 5.0% |
| S&P 500 | 1.4% | 8.5% | 9.9% | 6.9% | 4.7% |
| 60/40 Retirement Portfolio | 2.1% | 5.1% | 7.2% | 5.0% | 2.8% |
(Source: FactSet, Morningstar, YCharts.)
BTI and TRP are fantastic buys right now; they are the best buys in 23 years if you like those companies.
Each is expected to beat the S&P 500 (SP500) over time, the Nasdaq (COMP.IND), and almost any competing investment strategy.
Private equity strives for 12% to 20% long-term returns, and both BTI and TRP offer that kind of return potential with a very safe 8% to 9% yield on day one.
But when you combine with Meta and GOOG? Then suddenly you get a still very generous 4.2% yield that leaves SCHD in the dust AND potentially delivers Buffett-like return potential of 19% long-term AND income growth of 15% to 20%!
- Potentially Double your income every three to five years!
And what if BTI and TRP never recover their historical higher multiples, a P/E of 13 for BTI and 10X cash flow for TRP?
What if they stagnate at current valuations, a P/E of 8 for BTI and 6X cash flow for TRP?
Why do you think the income growth was 26% while total returns were just 16%?
- The hyper-growth stocks were being rebalanced into new shares of BTI and TRP at steadily better valuations.
If BTI and TRP’s prices were to stay flat for the next few years while they both steadily grow their cash flows and dividends, then META and GOOG would fund exponentially more BTI and TRP purchases, driving another layer of income compounding.
Meta’s Growth Outlook Doubles After Earnings
FactSet Research Terminal 
Bottom line up front this is what Meta’s growth outlook now looks like after earnings according to the median consensus estimate of 62 analysts who cover it for a living.
That’s up from 12% pre-earnings so let’s do a few things to check how reasonable that is.
All 62 Analysts Have About 20% Margin of Error On Meta
FAST Graphs
First how accurate are those 62 analysts? If analysts expect hypergrowth from Meta, can investors expect it will actually deliver hypergrowth? Historically the answer is an emphatic “yes.”
Normalizing by dropping the biggest beat and biggest miss, we can see that analysts are usually never off by more than 20% to the downside and about 60% of the time Meta beats expectations by at least 20%.
OK, so all 62 analysts in the FactSet consensus are bullish, and apparently their Meta growth models are excellent.
2nd Opinion From YCharts: Hyper-Growth Confirmed
YCharts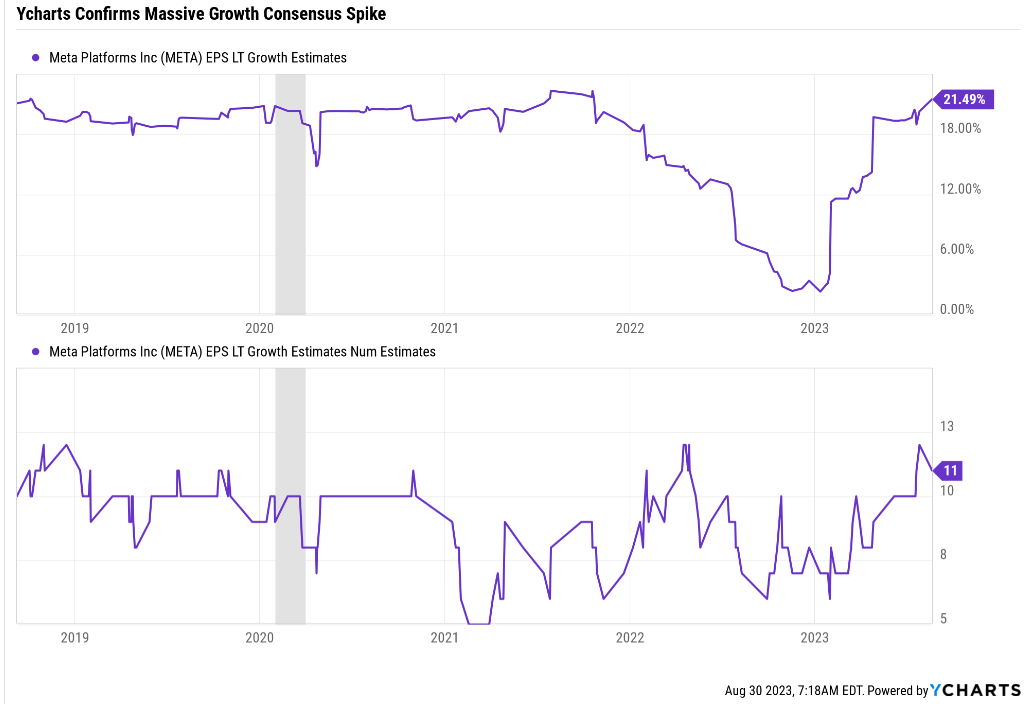
YCharts’s consensus, which uses a slightly different combo of analysts confirms a massive recovery in Meta’s growth outlook, this one from 11 analysts.
3rd Opinion 37 Analyst FactSet Consensus 27% Growth
FAST Graphs, FactSet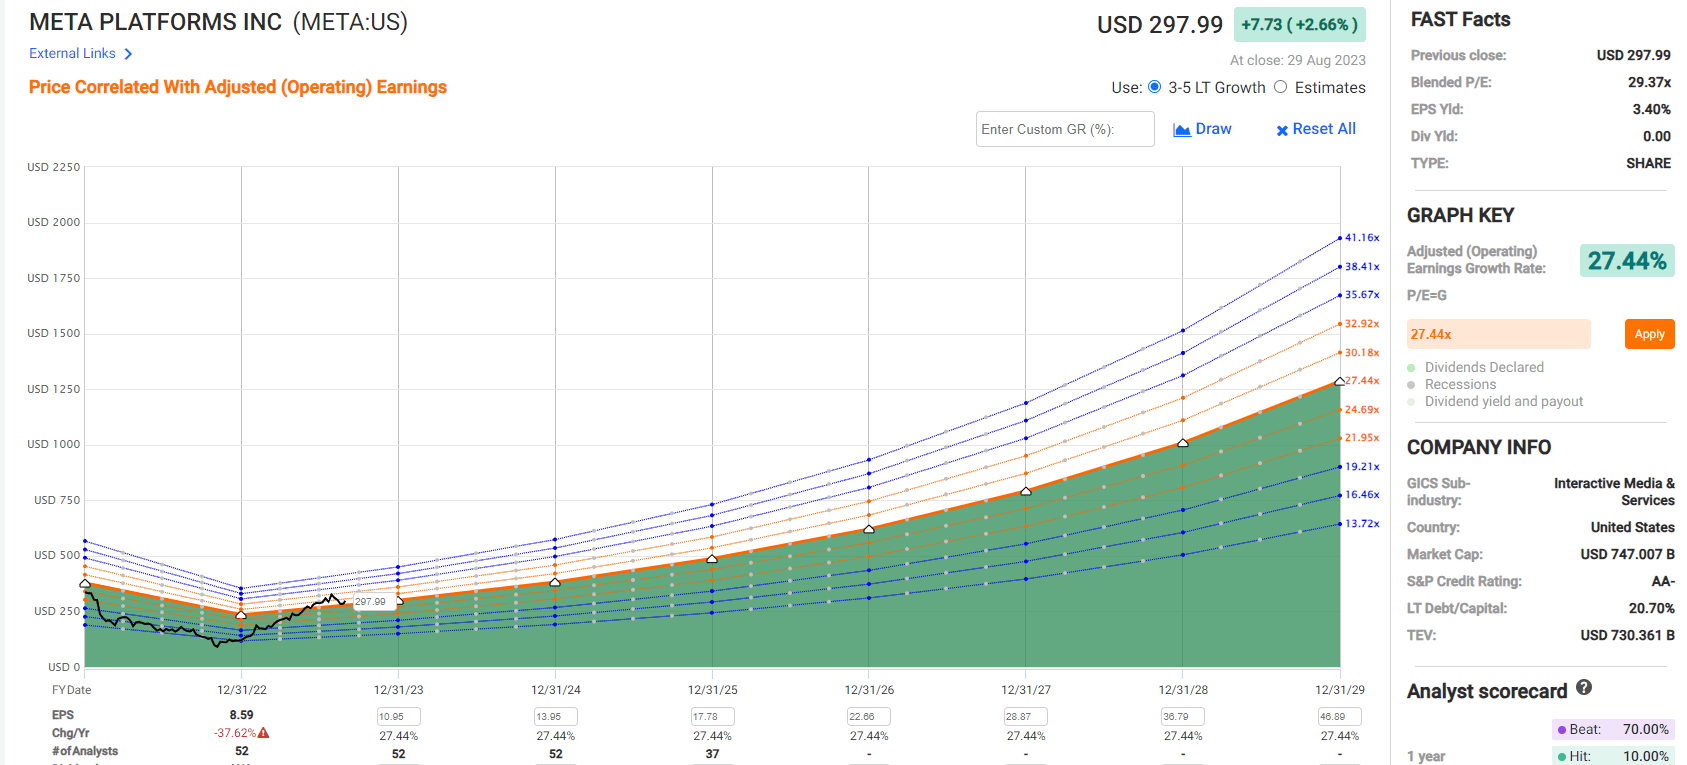
There are 62 analysts covering Meta, but FAST Graphs is pulling its long-term growth estimate from the average of just 37 of them.
- 37 analyst average growth outlook 27%
- 62 analyst median growth outlook 29%.
Ok, how about a 3rd opinion? From Reuters, which is what Yahoo Finance uses?
36 Analyst Reuters Consensus
Yahoo Finance, Reuters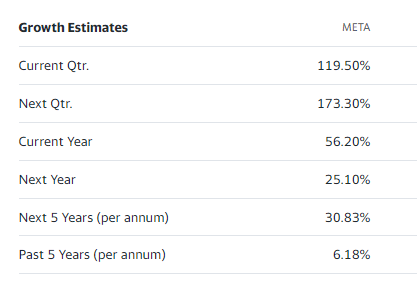
- FactSet: 29%
- Reuters: 31%
- FAST Graphs: 27%
- YCharts: 21%.
Ok, so Meta’s growth outlook is confirmed a lot better than pre-earnings.
Why am I starting out with a review of the analyst consensus from four trusted sources?
Medical Science Evidence Pyramid
Cochrane Collaboration 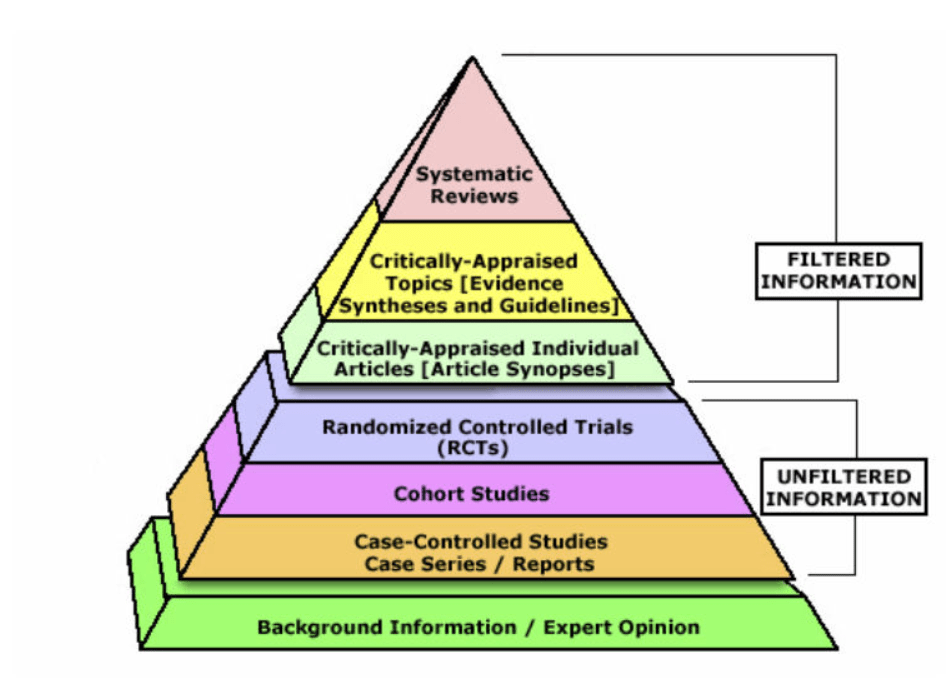
The meta analysis (systemic review) of other studies is considered the gold standard of science.
One quality study is great, analyzing 12 quality studies to see what the preponderance of statistically significant evidence says is best.
The same is true in financial science. One analyst can be very wrong, or exactly right about a company. But 62 analysts? Who collectively have never missed Meta’s earnings since IPO outside of a 7% margin of error?
Those 62 analysts + rating agencies + the bond market collectively know Meta better than CEO Mark Zuckerberg himself. Possibly even better than he does.
This expert consensus is what I consider the gold standard of evidence-based data about Meta’s past, present, and likely future.
And guess who said that analyzing the past, present, and likely future, via a purely mathematical (quantitative) and also qualitative (the “story” behind a company) framework, was optimal?
Ben Graham, the father of securities analysis, valuation, and Buffett’s mentor, plus one of history’s greatest investors in his own right.
Rating Agency + Bond Market Confirmation
S&P rates Meta AA- stable. Here’s what that means.
S&P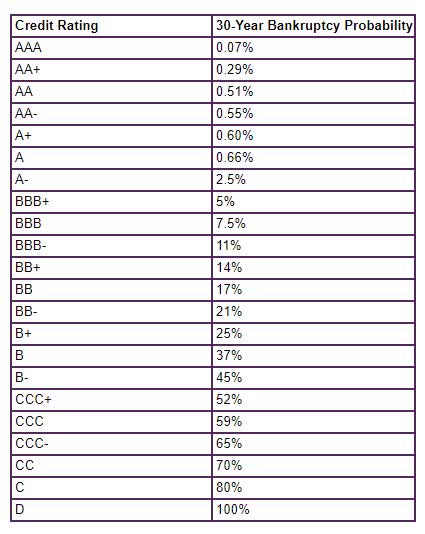
That’s a 0.55% fundamental risk of losing all your money in the next three decades.
FactSet Research Terminal 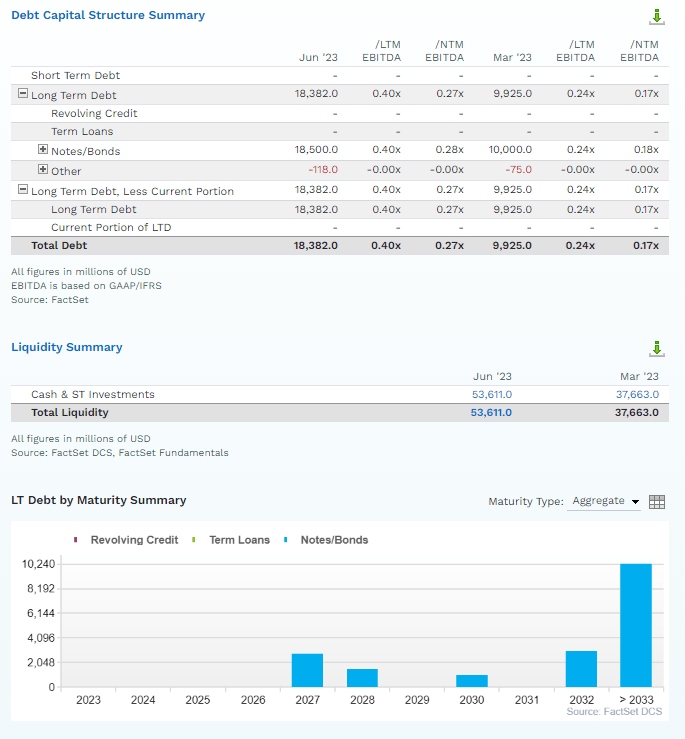
Because Meta has three times more cash than debt and is generating $30 billion in annual free cash flow, a sum that’s growing by the year.
FactSet Research Terminal 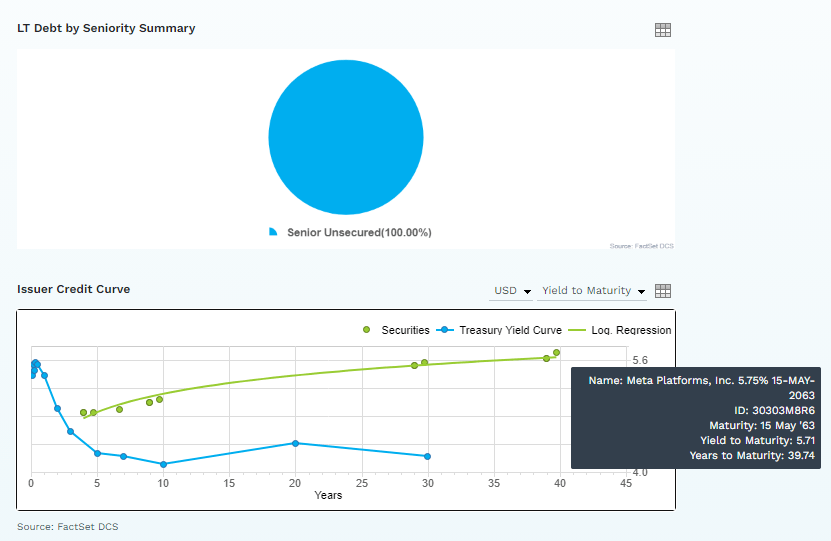
The bond market trusts Meta’s growth outlook so much that it’s willing to lend to it for 40 years at 5.7%, terms it won’t even give the AA+ rated US government.
Ok, so the expert consensus loves Meta’s long-term growth outlook. But let’s confirm with a medium-term growth check.
Checking To See Whether That Spike In Growth Is Reasonable
- from 2022 through 2028 23% EPS growth per the 62 analyst median consensus.
That’s certainly doubling of growth, but not quite 28%. It’s within the 21% to 31% growth consensus range.
- full growth range on Meta is 3% to 31%.
What about the medium term outlook on different kinds of fundamentals?
Medium-Term Growth Consensus
| Year | Sales | Free Cash Flow | EBITDA | EBIT (Operating Income) | Net Income |
| 2022 | $116,609 | $18,439 | $53,348 | $28,945 | $23,200 |
| 2023 | $131,562 | $29,380 | $69,827 | $42,122 | $34,253 |
| 2024 | $147,825 | $35,018 | $81,459 | $52,179 | $42,167 |
| 2025 | $164,739 | $41,026 | $92,831 | $59,573 | $48,362 |
| 2026 | $182,227 | $40,746 | $101,967 | $68,573 | $56,165 |
| 2027 | $208,638 | NA | $125,737 | $83,962 | $69,465 |
| 2028 | $228,184 | NA | $139,470 | $92,714 | $77,837 |
| Annualized Growth | 11.84% | 21.92% | 17.37% | 21.41% | 22.35% |
| Cumulative 2023-2028 | $1,063,175 | $146,170 | $611,291 | $399,123 | $328,249 |
(Source: FactSet Research Terminal.)
While 28% to 31% growth is probably a bit optimistic, there is no question that low 20% growth is possible in fundamentals other than earnings.
Consensus Margin Consensus
| Year | FCF Margin | EBITDA Margin | EBIT (Operating) Margin | Net Margin |
| 2022 | 15.8% | 45.7% | 24.8% | 19.9% |
| 2023 | 22.3% | 53.1% | 32.0% | 26.0% |
| 2024 | 23.7% | 55.1% | 35.3% | 28.5% |
| 2025 | 24.9% | 56.4% | 36.2% | 29.4% |
| 2026 | 22.4% | 56.0% | 37.6% | 30.8% |
| 2027 | NA | 60.3% | 40.2% | 33.3% |
| 2028 | NA | 61.1% | 40.6% | 34.1% |
| Annualized Growth 2022-2028 | 9.05% | 4.95% | 8.56% | 9.40% |
(Source: FactSet Research Terminal.)
Analysts expect steady improvements in margins courtesy of reduced spending on the Metaverse and steadily rising economies of scale.
Almost $200 Billion In Buybacks Expected By 2028
(Source: FactSet Research Terminal)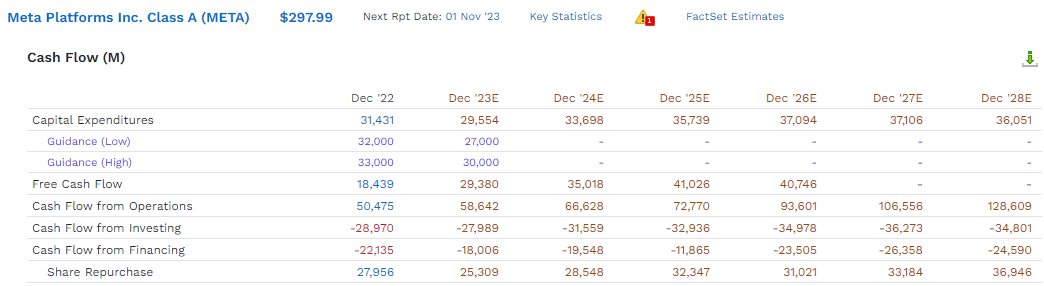
Meta is a $730 billion market cap company that is expected to repurchase $187 billion in stock by the end of 2028.
- 26% of shares at current valuations
- 4.9% of shares per year.
What about stock-based compensation (“SBC”)? How much of that $187 billion will be offsetting stock dilution via options given to management and employees?
Morningstar 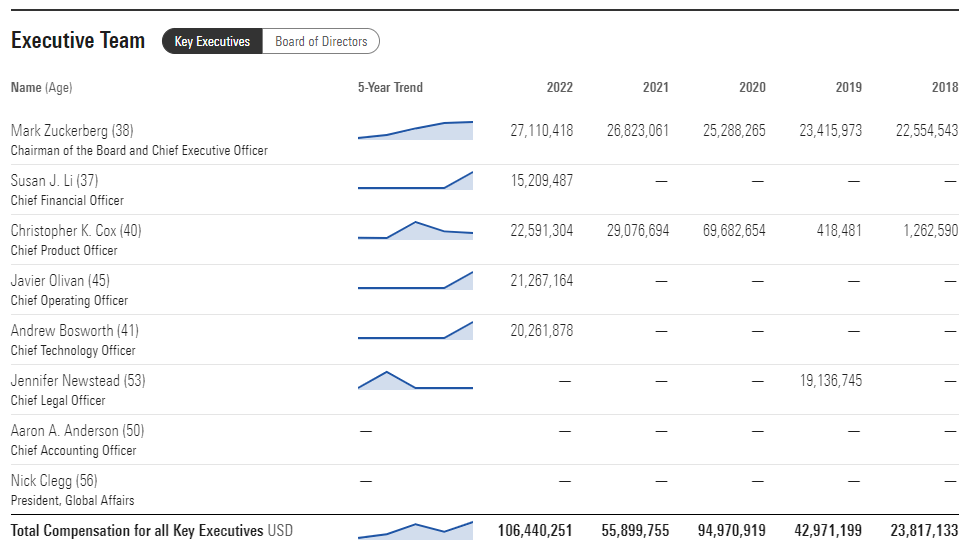
Last year, Meta plunged as much as 70% at one point and paid management $106 million. Investors were a bit upset.
Zuckerberg technically earns $1 per year, though $27 million in “other” compensation.
Morningstar 
About 90% of management’s pay is from stock options, running around $90 million per year.
What about all stock-based comp? Meta has tens of thousands of employees and they are getting stock options, too.
YCharts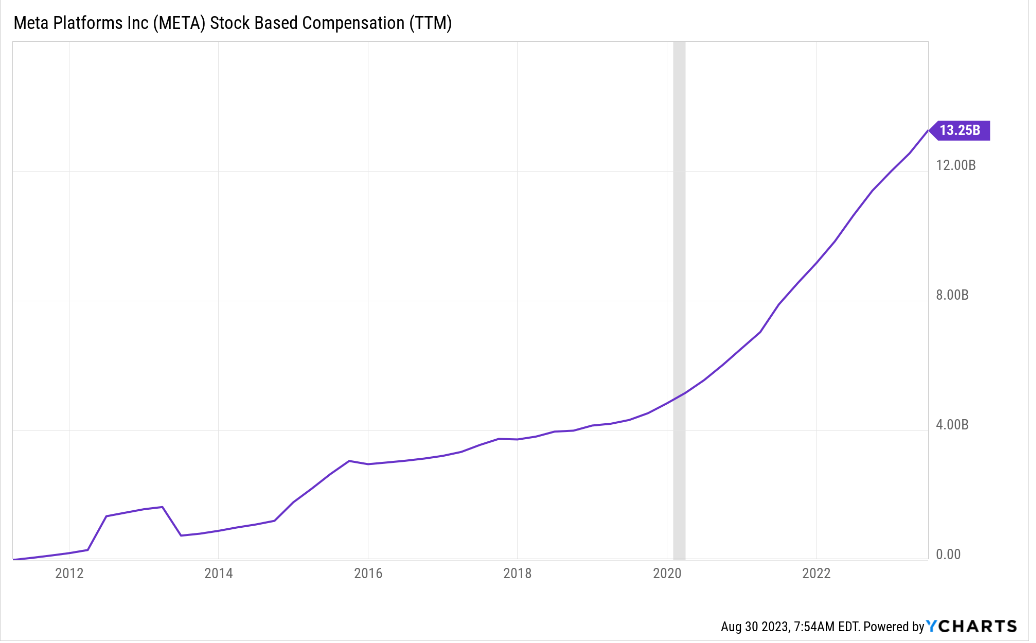
Last year, 43% of buybacks went to offsetting share printing the company did for stock-based comp.
Assuming a similar long-term norm for buybacks, that means that Meta’s share count should fall about 2.75% per year (at current valuations).
YCharts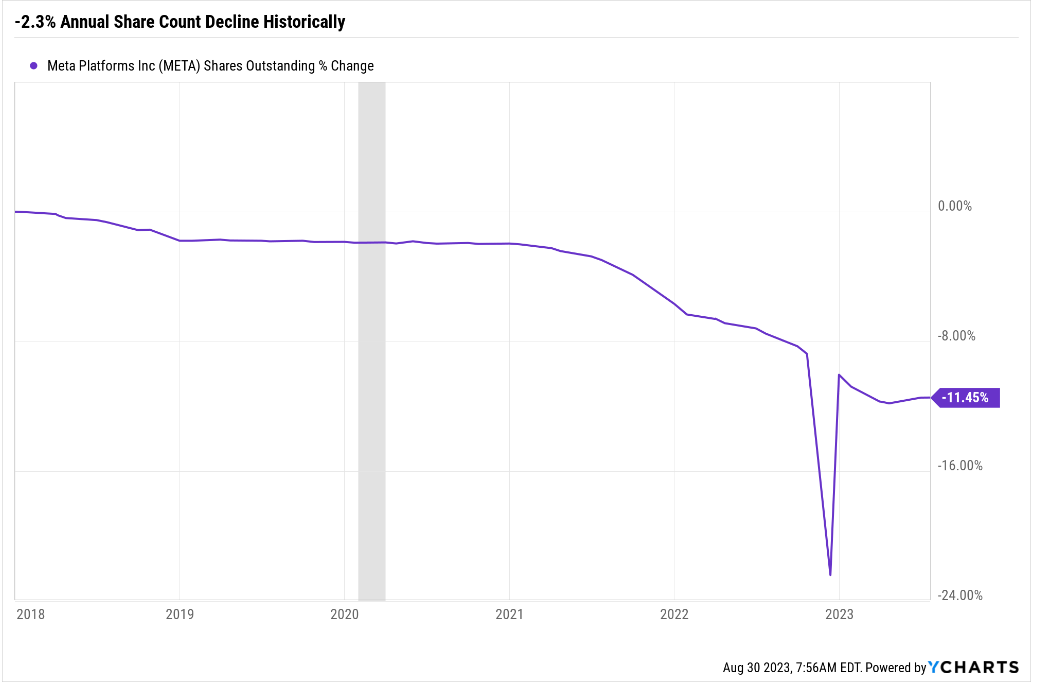
Since Meta began buying back stock in 2018 shares have fallen 2.3% per year, confirming that 2% to 3% per year is a reasonable net EPS boost to expect from buybacks.
- 22% net income growth through 2028
- + 2% to 3% EPS boost from buybacks
- 24% to 25% realistic EPS expectation based on best-available data.
Yes, indeed, Meta does appear to have doubled its growth potential.
The Story Behind Why Meta Is Thriving Once More
Meta again displayed its strong network effect moat source as its user base across all apps increased, engagement remained healthy, and monetization improved further during the second quarter. Advertisers are gaining confidence in Meta’s enhanced and artificial intelligence-powered campaign planning and measurement capabilities, and spending more. Unsurprisingly, Reels monetization keeps improving. We also applaud the firm’s continuing focus on cost control and overall efficiency, which resulted in year-over-year margin expansion for the first time since second-quarter 2021. We think margin expansion likely will continue through 2027, albeit with continuing losses at its Reality Labs.” – Morningstar (emphasis added).
Ok, so that’s the qualitative reason why Meta is thriving, so let’s confirm Morningstar’s take on the last few quarters.
FactSet Research Terminal 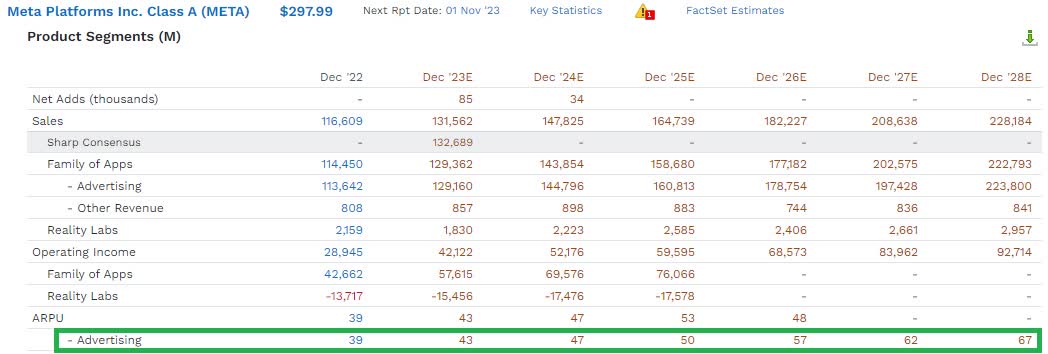
Analysts expect revenue per user to grow 11.4% through 2028, soaring 72% all the way to $67 per year.
Remember that Meta has a userbase of 3 billion. Isn’t that userbase shrinking, though?
FactSet Research Terminal 
Nope, Meta’s userbase is growing slowly but steadily. Mind you, 27,000 net new users on 3 billion is basically no growth at all, but analysts expect modest growth over time.
FactSet Research Terminal 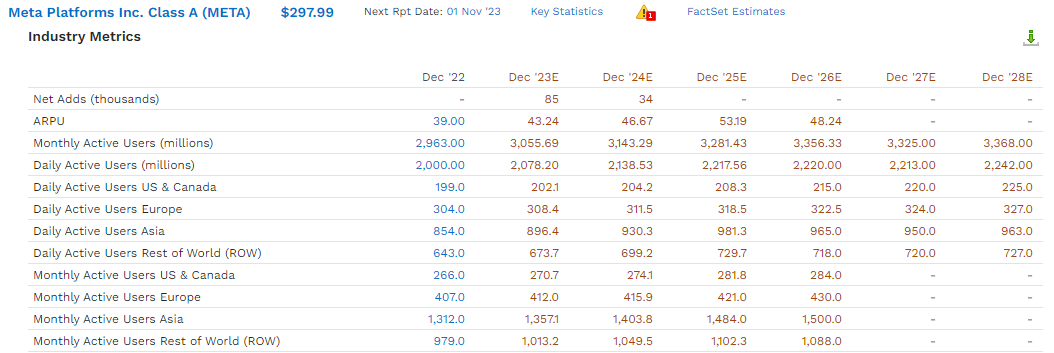
The userbase is expected to grow at 2.2% annually through 2028 to almost 3.4 billion. That might not sound like much growth, but keep in mind it represents about 400 million people.
- U.S. population is 340 million.
Google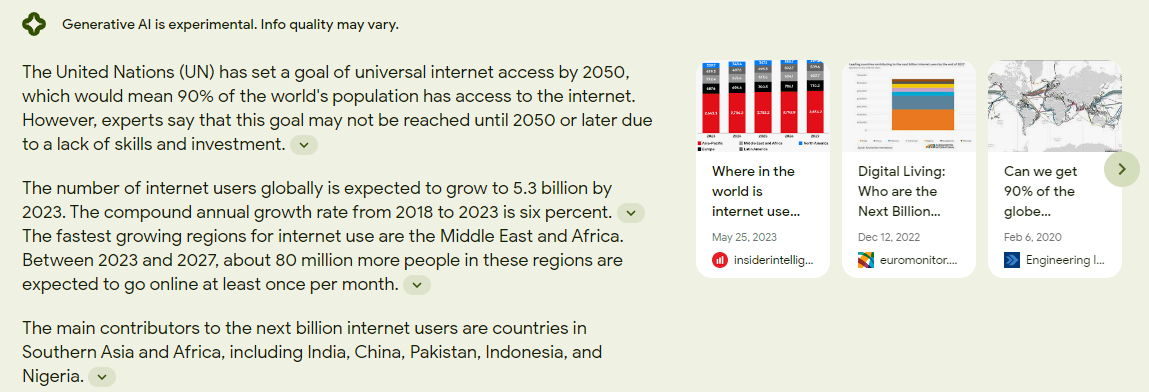
By 2050, the UN estimates the world’s population will be 10 billion and 90% of people will be online.
There are currently an estimated 5.3 billion internet users (66% of people int he world).
So from 5.3 billion users in 2023 to about 9 billion by 2050 is 2% annual growth in internet users.
Compared to Meta’s 2.2% growth rate indicating that it’s growing at approximately the rate of the world’s internet userbase.
That implies that by 2100 with 11 billion people in the world and approximately 100% internet penetration about 1% for the next 77 years.
Wait, don’t people hate Facebook and Instagram and Reels? Don’t they all hate Zuckerberg and no one but old folks use Meta’s platforms?
Statista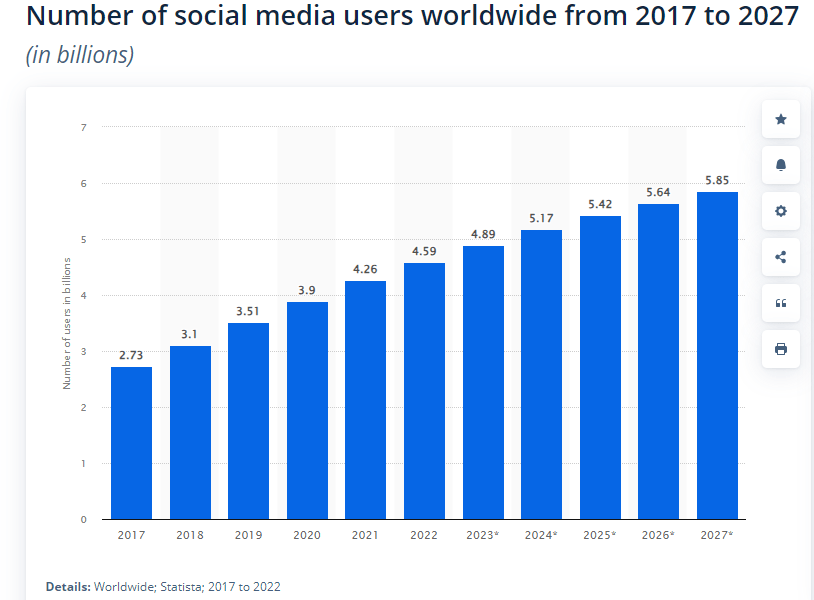
We all claim to hate Social Media, yet 92% of Internet users use it.
We all claim to hate Facebook and yet somehow Facebook is growing.
The plural of anecdote is anecdote, not data.” – Brian Dunning, Skeptoid.
Whether you or I personally like Facebook or Mark Zuckerberg is irrelevant. The fact is that the platform is still growing slowly but steadily and they are monetizing their platforms better.
Apple’s iOS data interruption? They overcame that apparently. The numbers speak louder than any story you might see on Bloomberg, CNBC or YouTube ever could.
- Your blood tests are more important than how you feel
- you could feel wonderful but your cholesterol might be sky high, your liver might be failing and your kidneys might be shutting down.
The same is true for companies. Your personal opinion about a company should never stand in the way of the objective data. That’s the difference between investing by the seat of your pants, and financial science.
Alphabet’s Growth Outlook Up 30% After Earnings After Earnings
Ok, so Meta is thriving now, proving that 2022’s turn down the Metaverse blind alley isn’t likely to doom the company.
- Meta’s qwikster moment if you will
- Netflix recovered and is thriving once more.
What about Google, though? Didn’t the growth outlook take a wallop in recent quarters?
YCharts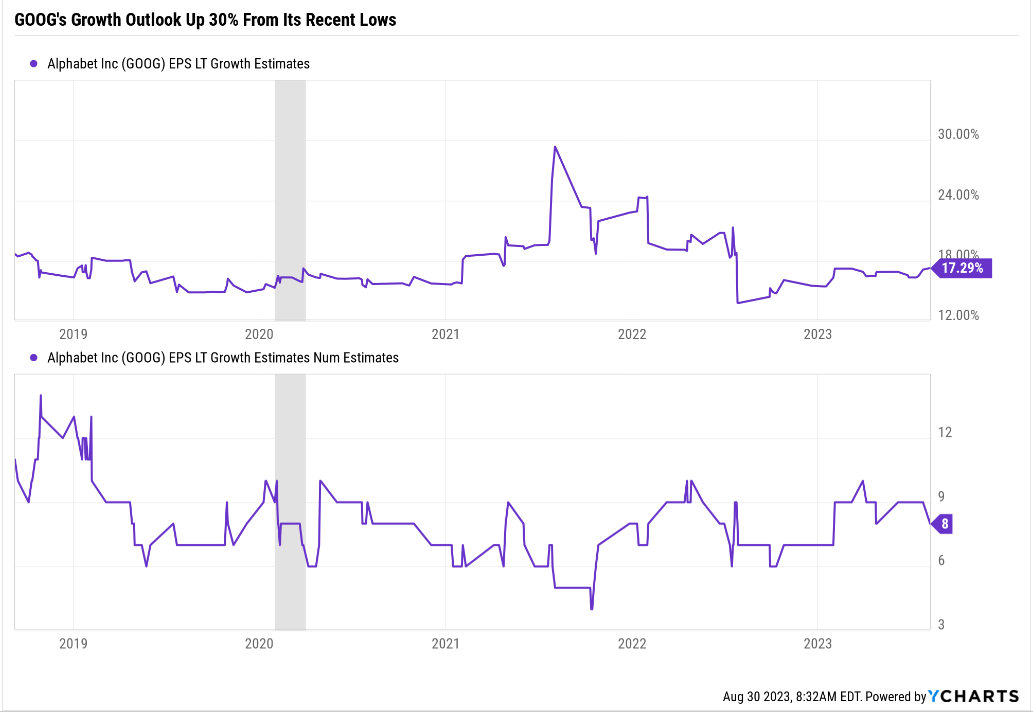
The growth outlook fell mostly during the advertising recession of 2022.
Now that the industry is recovering, the growth consensus is recovering as well.
FactSet Research Terminal 
The 57 analyst median consensus is 18.2% growth; 8 of them have 17%, and the range of all 62 is 14% to 19.6%.
FAST Graphs, FactSet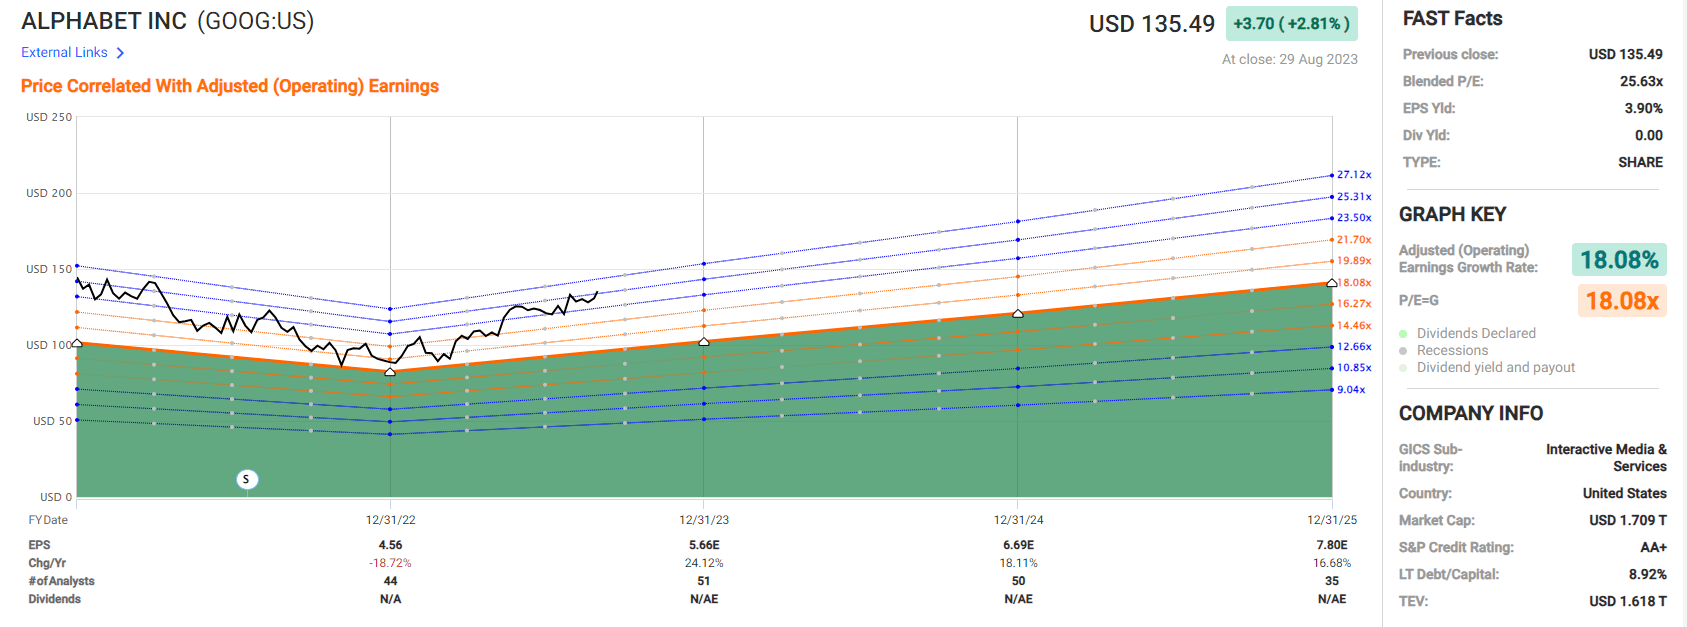
35 out of 57 analysts expect 18% growth in the medium term, and 30 analysts in the Reuter’s consensus say 15% growth for the next five years.
Yahoo Finance, Reuters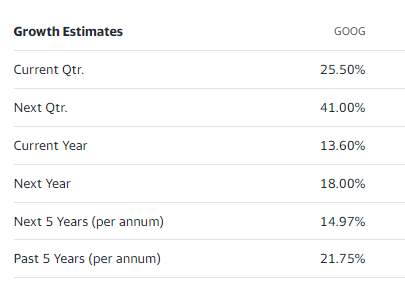
So, the range of growth estimates is 15% to 18%, with a full range of 14% to 20% among all 57 analysts.
How accurate are analysts for GOOG? How well do they understand the business? How accurate are these forecasts that our GOOG model is built around?
10% Normalized Margin Of Error On GOOG
FAST Graphs, FactSet
Analysts know GOOG’s business very well, which is why it meets or beats expectations for the last decade.
Medium-Term Growth Outlook Check: Does 18% Growth For Google Make Sense?
From 2022 through 2028, the EPS is expected to grow from $4.56 to $12.53
- 18.4%
- right in the middle of the consensus range from all sources.
What about the other fundamentals other than EPS?
Consensus Medium-Term Growth Consensus
| Year | Sales | Free Cash Flow | EBITDA | EBIT (Operating Income) | Net Income |
| 2022 | $282,836 | $60,010 | $110,132 | $74,842 | $59,972 |
| 2023 | $304,296 | $74,020 | $121,040 | $84,952 | $71,645 |
| 2024 | $339,262 | $87,896 | $137,389 | $98,447 | $83,080 |
| 2025 | $376,274 | $100,457 | $159,429 | $111,994 | $95,268 |
| 2026 | $411,304 | $114,535 | $174,592 | $122,527 | $104,229 |
| 2027 | $436,139 | $149,000 | $192,782 | $134,336 | $116,489 |
| 2028 | $497,207 | $167,819 | $221,758 | $156,706 | $136,825 |
| Annualized Growth 2022-2028 | 9.86% | 18.70% | 12.37% | 13.11% | 14.74% |
| Cumulative 2023-2028 | $2,364,482 | $693,727 | $1,006,990 | $708,962 | $607,536 |
(Source: FactSet Research Terminal.)
So, looks like steady margin expansion is expected at GOOG for the foreseeable future.
| Year | FCF Margin | EBITDA Margin | EBIT (Operating) Margin | Net Margin |
| 2022 | 21.2% | 38.9% | 26.5% | 21.2% |
| 2023 | 24.3% | 39.8% | 27.9% | 23.5% |
| 2024 | 25.9% | 40.5% | 29.0% | 24.5% |
| 2025 | 26.7% | 42.4% | 29.8% | 25.3% |
| 2026 | 27.8% | 42.4% | 29.8% | 25.3% |
| 2027 | 34.2% | 44.2% | 30.8% | 26.7% |
| 2028 | 33.8% | 44.6% | 31.5% | 27.5% |
| Annualized Growth 2022-2028 | 8.04% | 2.29% | 2.96% | 4.44% |
(Source: FactSet Research Terminal.)
And an impressive $700 billion in cumulative free cash flow by 2028.
Which means lots of buybacks.
Almost $500 Billion In Buybacks Expected By 2028
(Source: FactSet Research Terminal)
$483 billion in cumulative buybacks are expected from GOOG out of that almost $700 billion in free cash flow, for a $1.6 trillion company.
- 30% of outstanding shares not counting stock comp
- 5.8% of shares each year.
What is GOOG’s stock dilution each year?
YCharts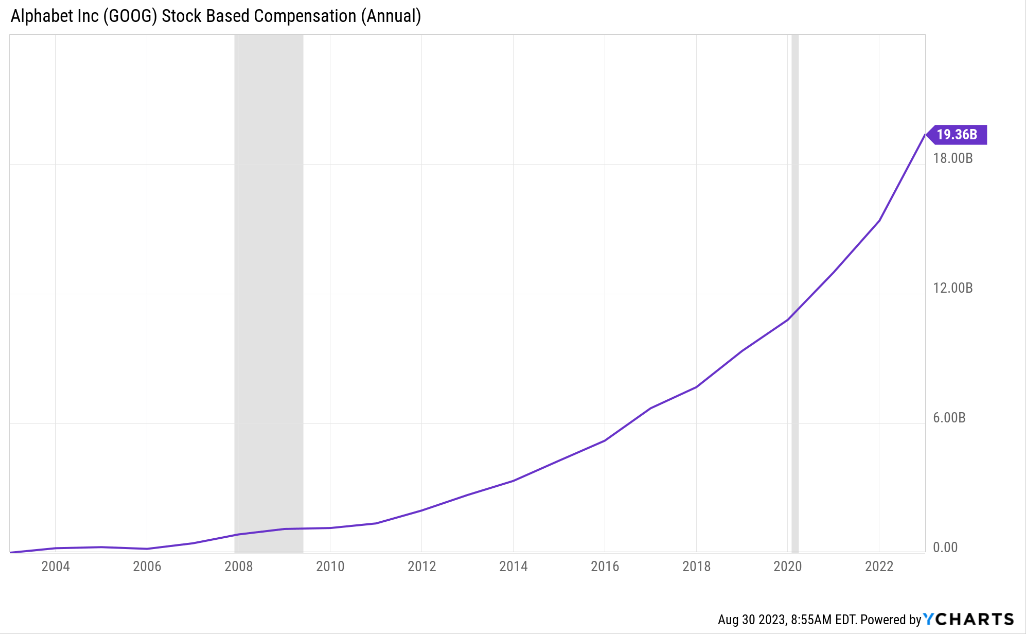
GOOG’s stock dilution is 33% of annual buybacks, so 3.8% is what you might expect in terms of net share decline based on the current valuation.
YCharts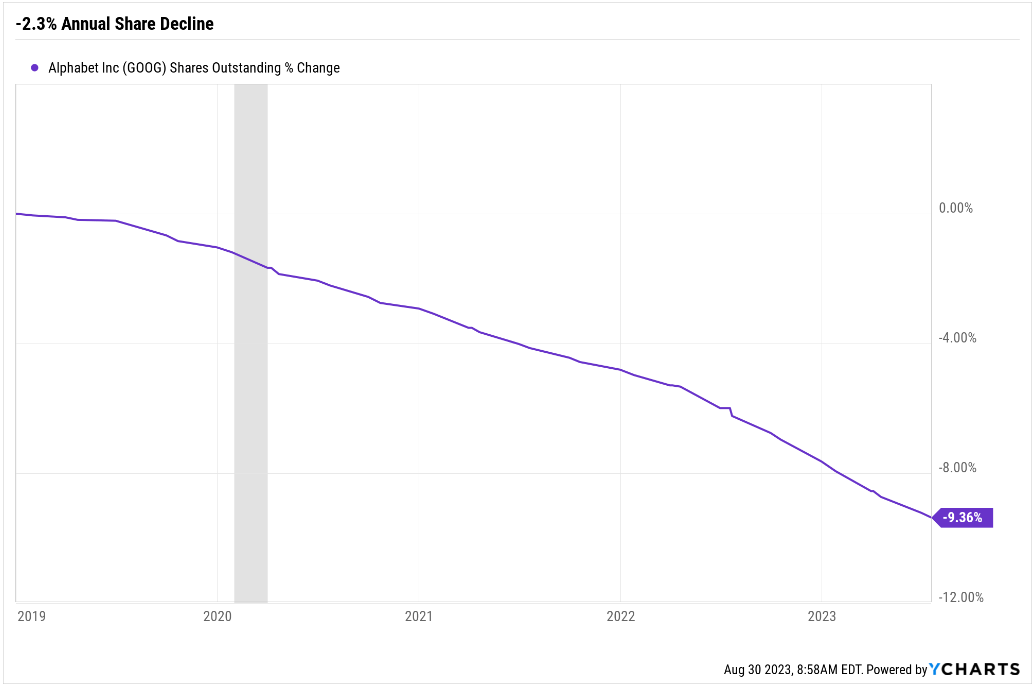
2% to 3% annual net buybacks is what can be expected from GOOG, boosting net income growth of 14% to 15% for a total of 16% to 18% long-term growth based on the best meta-analysis of consensus data.
So the current consensus is supported by the facts.
The Story Behind Google’s Improved Growth
So here’s the basic summary of GOOG’s current business results.
Accelerating growth in Google’s core search business demonstrated that the segment’s network effect moat source is intact despite threats from Microsoft and OpenAI. Also, as we expected, YouTube ad revenue returned to growth due to a more balanced mix of broad-based and direct response ad demand, improvement in YouTube Shorts monetization, and increasing demand for ads on connected TVs. We were surprised by another revenue decline in Google’s advertising technology offerings, but expect that segment to improve as economic uncertainty lessens and ad spending across the internet picks up.” – Morningstar (emphasis added).
And now here’s the evidence backing up Morningstar’s assessment of the quarter.
Statcounter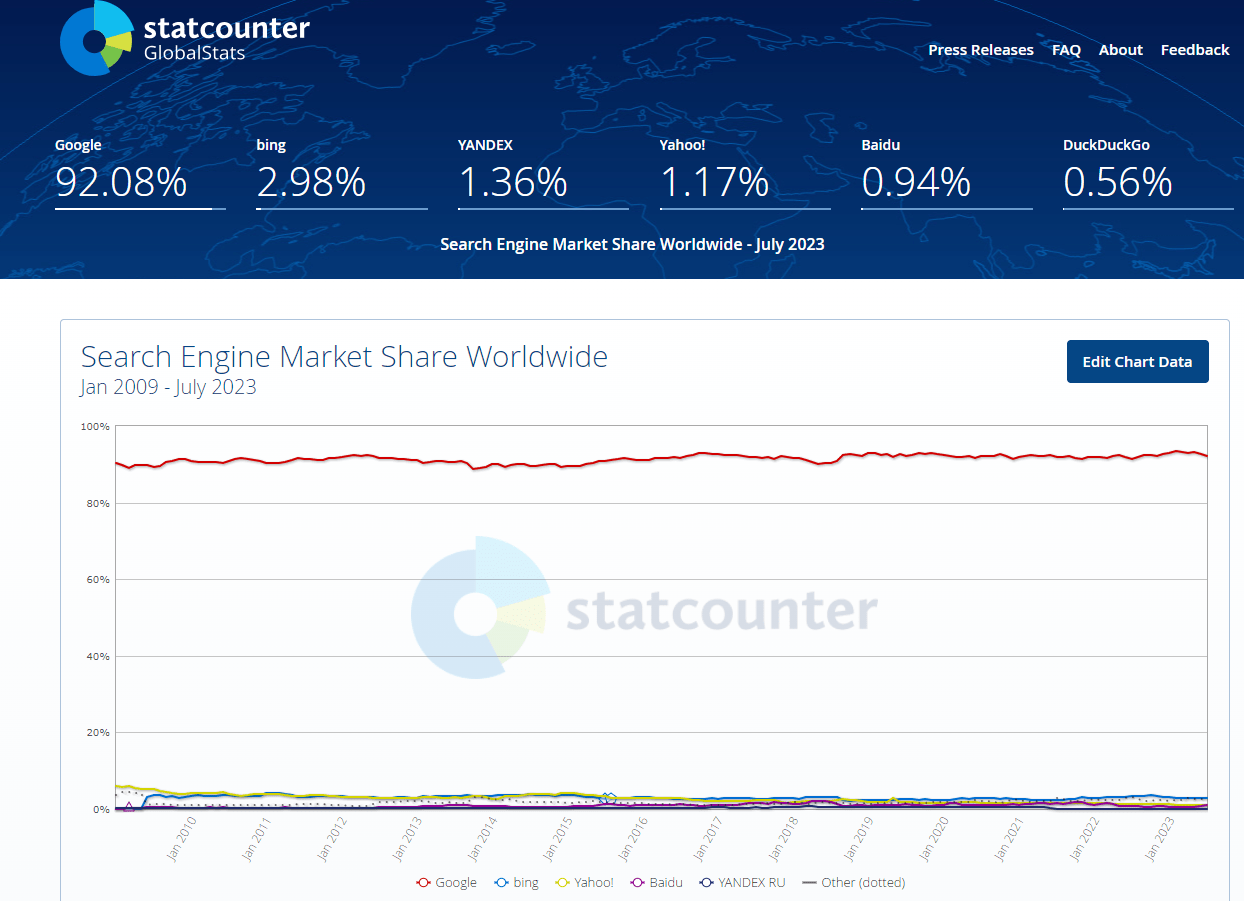
GOOG’s market share was 89% in 2009 and 91% in October 2022, right before OpenAI introduced ChatGPT and Microsoft added it to Bing.
GOOG’s market share in global search is 92% right now and has been stable for a decade.
GOOG’s reign as the king of search remains mostly unchallenged for now.
How worried should you be about ChatGPT overturning the global search market?
Google
Google has greatly improved Bard, its ChatGPT fighter, and now incorporates an even better version into search.
You can search a question in Google like “What are the UAW’s contractual demands with the Big 3 Automakers” and get the following.
Google
Unlike Bard, which gives incredible life advice (it’s the ultimate life-coach) but can make significant errors in facts, Google’s new AI-powered search appears far more accurate and comes with instant sourcing.
This is what Microsoft was trying to build with Bing and ChatGPT but failed to create anything significantly useful. Google tried and quickly achieved success and has probably cemented its global dominance in search for the foreseeable future.
Google’s Dominance In AI Might Come At A Cost
Searching costs GOOG almost nothing the traditional way since it has been optimizing the process for over 20 years.
- less than 0.4 cents which is what Google Cloud charges.
Morgan Stanley
AI is much more expensive, and Morgan Stanley estimates that if GOOG had to run every search through Generative AI averaging 100-word answers, it would cost it an extra $24 billion in operating costs.
- a 40% reduction in current profits.
FactSet Research Terminal 
That’s not actually expected to happen, with search-related traffic costs only rising from $49 billion to $80 billion by 2028.
That sounds like a lot, but remember, sales are expected to rise by over $200 billion compared to a $31 billion increase in search-related costs.
Google Cloud, which is running all this, and powering the data that makes the Google search bot so darn useful (and Bard, the ultimate life coach), is expected to go from a $3 billion operating loss last year to $18 billion in operating profits by 2027. And by 2027, it should be generating about $50 billion in EBITDA or just over 25% of all EBITDA for GOOG, whose EBITDA margin is already 40%.
Or, to put it another way, GOOG is an ultimate cash machine, Google Cloud is growing so quickly, and its economies of scale are improving so fast, that within four years, a large part of its cash flow will be cloud-based.
Bottom Line: Alphabet And Meta, Combined With Ultra-Yield Blue Chips, Can Get You A 4.2% Yield And Possibly Change Your Life
If you’re a dividend investor, you should still invest in GOOG and Meta, because maximizing long-term income growth and thus income over time, is supercharged by combining yield + hypergrowth.
Right now, BTI and TRP make great combo partners for GOOG and Meta, creating a 4.2% yielding quadruple threat with 14% to 15% long-term expected growth and 15% to 20% long-term income growth potential.
Show me an ETF or stock with that kind of income growth potential.
OK, other than the Warren Buffett of alternative asset management companies.
The point is that if you want generous safe yield today and monster income growth in the future, combining wide-moat Ultra SWAN world-beaters like GOOG, Meta, TRP, and BTI is a great strategy.
Much of the tech world is overvalued today. BTI and TRP are trading dirt cheap. What about GOOG and Meta?
Both remain reasonably to attractively valued.
FAST Graphs, FactSet
Both Meta and GOOG are classic Buffett-style “wonderful company at fair prices” despite their remarkable rallies this year.
FAST Graphs, FactSet
If you want to buy top quality world-beaters growing at impressive rates, to power income growth that can help you retire in safety and splendor, GOOG and Meta are reasonable choices to combine with Ultra Yield Ultra SWANs like BTI, TRP, ENB, MO, or many others.
Analyst’s Disclosure: I/we have no stock, option or similar derivative position in any of the companies mentioned, and no plans to initiate any such positions within the next 72 hours. I wrote this article myself, and it expresses my own opinions. I am not receiving compensation for it (other than from Seeking Alpha). I have no business relationship with any company whose stock is mentioned in this article.
Seeking Alpha’s Disclosure: Past performance is no guarantee of future results. No recommendation or advice is being given as to whether any investment is suitable for a particular investor. Any views or opinions expressed above may not reflect those of Seeking Alpha as a whole. Seeking Alpha is not a licensed securities dealer, broker or US investment adviser or investment bank. Our analysts are third party authors that include both professional investors and individual investors who may not be licensed or certified by any institute or regulatory body.
—————————————————————————————-

Dividend Kings helps you determine the best safe dividend stocks to buy via our Automated Investment Decision Tool, Zen Research Terminal, and Correction Planning Tool.
Membership also includes
-
Access to our 13 model portfolios (all of which are beating the market in this correction)
-
my correction watchlist
- my family’s $2.5 million charity fund
-
50% discount to iREIT (our REIT-focused sister service)
-
real-time chatroom support
-
real-time email notifications of all my retirement portfolio buys
-
numerous valuable investing tools
Click here for a two-week free trial, so we can help you achieve better long-term total returns and your financial dreams.