Summary:
- INTC continues to perform relatively weak while the semiconductor industry is leading the technology sector’s reversal.
- The stock dropped 11% after its latest quarterly report, while it also achieved partially recovering its intraday losses.
- In this technical article, I show important price levels and metrics that investors could consider for gaining an edge on the stock’s likely price action.
- By considering multiple outcomes and setting up an adequate contingency plan, investors are less inclined to act driven by emotions, as this could come at a higher cost.
- While I continue to rank INTC as a long-term hold position, I also discuss a very interesting short-term trading opportunity.
DNY59
Investment thesis
Intel Corporation’s stock (NASDAQ:INTC) continues to perform weakly as expected, extending its losses after the most recent quarterly report and a worrying outlook. But despite the massive intraday losses, the stock could retrace part of it, while now facing even more overhead resistance. In this update on INTC, I explain an actionable trading opportunity from a short-term perspective, while I continue to rank the company as a hold position for more long-term oriented investors.
A quick look at the big picture
After being among the worst performers in the past year, the US technology sector has marked a significant rally since the beginning of 2023. Semiconductor manufacturers have been leading the strong reversal, showing significant relative strength, after being among the laggards on a yearly basis. The industry can finally see some relief in its supply chain bottlenecks as covid restrictions in most parts of the world are lifted, shipping costs have significantly dropped, and the industry’s most relevant commodities’ prices are gradually normalizing. Although some light is in sight, the semiconductor shortage is still affecting many of the estimated 169 impacted global industries and limiting their growth potential.
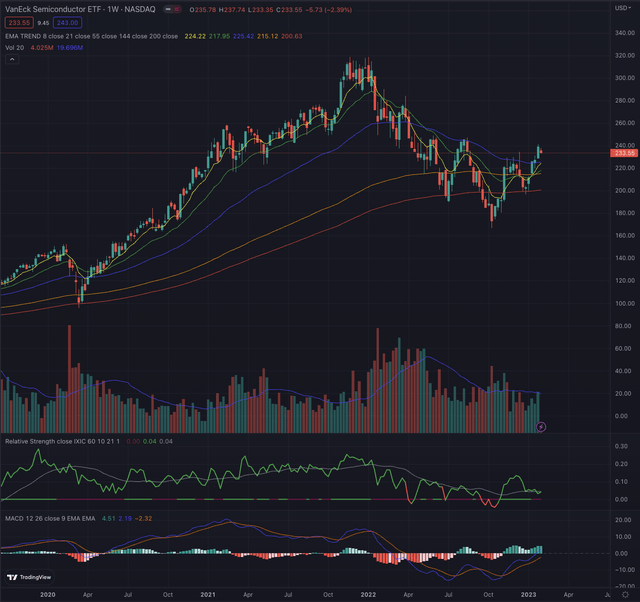
The industry reference VanEck Semiconductor ETF (SMH) has been testing the long-term EMA200 for the past 6 months, while briefly breaking under it and bottoming on October 13, 2022. SMH has since achieved to rise over its most important resistances and is now confirming its price level above the EMA55 on its weekly chart, a strong trailing resistance that has been rejecting SMH since the beginning of its mid-term downtrend. On its daily chart, the industry reference has significantly overcome its EMA200, marking the breakout from its long-term downtrend, while its relative strength lost some steam over the past few weeks when compared to the broader technology market, the Nasdaq Composite (IXIC), or more narrowly the Nasdaq-100 tracked by the Invesco QQQ ETF (QQQ).
Where are we now?
In my former article “Intel: Bottom Fishing Is Not An Investment Strategy” published on November 29, 2022, I discussed my expectation of seeing INTC continue to weaken in the short term, and in fact, the stock lost about 13% in the few weeks after the article’s publication, extending almost until its bottom. More recently INTC retraced part of its losses and now stands a few percentage points under the price level of my last analysis.
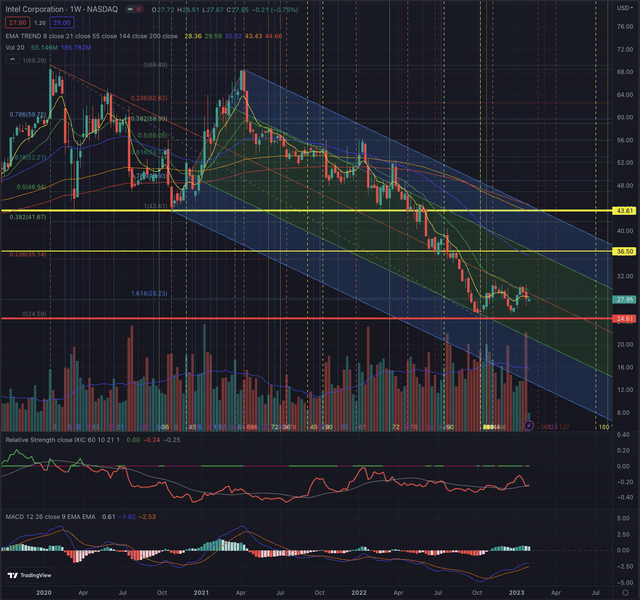
The stock had substantial distribution days in the past few weeks and is still reporting significant relative weakness when compared to the Nasdaq Composite (IXIC), while its price has been rejected at every attempt to overcome its EMA21. As I underscored in my former analysis, the problem with a stock in its stage four is the massive technical, but also psychological, overhead resistance that the stock has to overcome before possibly setting up a new uptrend, and INTC is exactly in this situation.
On January 27, 2023, INTC collapsed by 11% intraday as the company reported disappointing Q4 results and the Q1 guidance greatly missed the street’s expectations. However, the stock quickly recovered part of its losses during the trading session on significant buy-side volume, a situation that cannot be ignored as it could mean that the worst of the bad news has been digested. Another rather positive sign is the resilience observed in the MACD on INTC’s weekly chart, which is now forming a positive divergence. But more important than its past performance and the actual situation, are the hypotheses of the stock’s most likely future developments.
What is coming next?
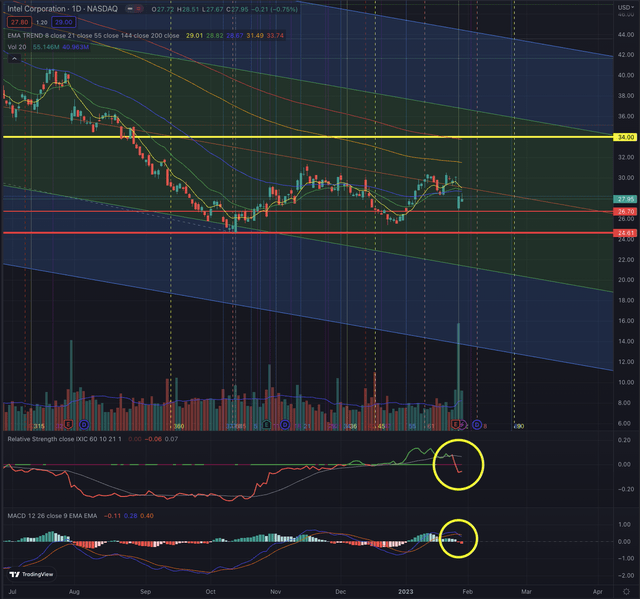
On its daily chart, INTC is now facing again its EMA55, and despite the massive volume of the two last days, the stock hasn’t yet achieved to overcome this resistance. I usually welcome steep distribution days where the stock recovers intraday, as we saw on January 27, as it cleans up many short positions and defines a support level. Despite that, I continue to expect the stock to perform relatively weaker than its reference in the short term.
The MACD just crossed negatively and the drop under the EMA55 and the support at $28.23, are hinting at more overhead resistance to conquer, while the stock is tracing the central part of the downtrend channel. Investing at this point means going stubbornly against heavy headwinds, while the odds of seeing lower lows are now increasingly high.
I, therefore, continue to rank INTC as a hold position, and would not initiate any new position in this situation; as a stockholder, I would consider setting my stop-losses between the low of January 27, and the low marked at the end of the year, respectively between $26.70 and $25.50. Under those levels, the risk of INTC testing its bottom and possibly even dropping further is too high. If INTC continues to move sideways, the stock could transition into stage one, where it would consolidate until it finds enough interest from investors to build up strength and break out from the strong overhead resistance. Although, as discussed in my former analysis, the bottoming process can extend over a significant amount of time, and even after an initial rally, long-term losing investors tend to sell the stock as soon as it recovers to their break-even price or any price that psychologically seems a justified trade-off, while longing for turning the page on a massive loss.
Before I could consider INTC as a long-term buy position, I want to see the stock breaking out from its EMA200 on its daily chart, from its EMA55 on its weekly chart, while confirming those price levels on noteworthy volume, and consistently reporting significant relative strength.
From a short-term perspective, I could consider INTC if the stock breaks out significantly over its EMA55 on its daily chart and hints at wanting to reach its EMA200 towards $34. This could offer an interesting trading range with an initial risk/reward ratio of 2, and I would raise my stop-loss at break-even, if the stock overcomes its EMA144, in order to generate a risk-free trade opportunity.
The bottom line
Technical analysis is not an absolute instrument, but a way to increase investors’ success probabilities and a tool allowing them to be oriented in whatever security. One would not drive towards an unknown destination without consulting a map or using a GPS. I believe the same should be true when making investment decisions. I consider techniques based on the Elliott Wave Theory, as well as likely outcomes based on Fibonacci’s principles, by confirming the likelihood of an outcome contingent on time-based probabilities. The purpose of my technical analysis is to confirm or reject an entry point in the stock, by observing its sector and industry, and most of all its price action. I then analyze the situation of that stock and calculate likely outcomes based on the mentioned theories.
The semiconductor industry has been outperforming the other industries in the technology sector in the past few weeks, breaking out from its long-term downtrend and extending over its EMA55 on its weekly chart. In market downturns, as we experienced in the past year, some historical leaders revert, while others struggle to recover, giving space to new leaders in their industry. INTC is still struggling to emerge from its sell-off, and despite the company being a technological and market leader in some of its segments, it’s not the time for investors to be exposed to the company until the stock isn’t able to confirm a new uptrend. Under the observed circumstances I continue to rank INTC as a hold position, while I would consider the discussed actionable contingency plan in the short term, as it could offer an interesting trading opportunity.
Disclosure: I/we have no stock, option or similar derivative position in any of the companies mentioned, and no plans to initiate any such positions within the next 72 hours. I wrote this article myself, and it expresses my own opinions. I am not receiving compensation for it (other than from Seeking Alpha). I have no business relationship with any company whose stock is mentioned in this article.
Additional disclosure: All of my articles are a matter of opinion and must be treated as such. All opinions and estimates reflect my best judgment on selected aspects of a potential investment in securities of the mentioned companies, as of the date of publication. Any opinions or estimates are subject to change without notice. I am not acting in an investment adviser capacity, and this article is not financial advice. I invite every investor to do their research and due diligence before making any investment decisions. I take no responsibility for your investment decisions but wish you great success.


