Summary:
- Medtronic’s Q1 FY 2024 financial performance shows positive growth, driven by innovation and strategic implementation.
- Key sectors like Cardiovascular and Neuroscience portfolios saw marked increases in revenue.
- Technical analysis suggests a potential short-term decline in stock price, presenting entry points for long-term investors.
JHVEPhoto
Medtronic plc (NYSE:MDT)’s financial performance for Q1 FY 2024 showcases a positive start to the new year, with revenues seeing a noticeable growth. This upward trend is ascribed to various factors, including innovation, strategic implementation, and enhanced foundational measures. Key sectors like the Cardiovascular and Neuroscience portfolios witnessed marked increases, with notable progress achieved in the Medical Surgical and Diabetes sectors. This article examines Meditron’s financial results and conducts a technical analysis of its stock price to forecast potential future trends and identify investment opportunities for long-term investors. Notably, the stock price has breached crucial thresholds, indicating the potential for further downward movement, which could present appealing entry points for long-term investors.
Medtronic’s Impressive Financial Performance Breakdown
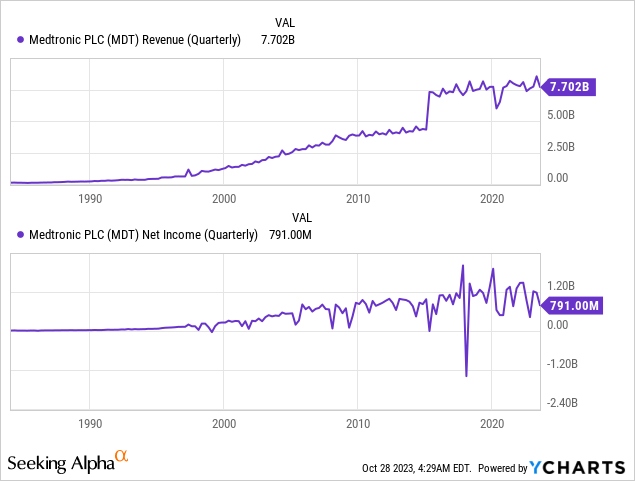
The company showcased robust growth, with a worldwide revenue reaching $7.702 billion in Q1 2024, as shown in the chart below. This is a marked increase of 4.5%, as reported, and 6.0% organically. Such growth is attributed to strategic execution, innovation, and improved foundational metrics. Notably, the reported growth does not account for revenue from business separations like Renal Care Solutions or the divestiture from Patient Care.
Moreover, the GAAP net income for Q1 2024 stood at $791 million, with diluted EPS at $0.59, marking decreases of 15% and 16%, respectively. In contrast, non-GAAP figures reported a net income of $1.596 billion and an EPS of $1.20, up by 6%. Geoff Martha, the company’s CEO, expressed satisfaction with the start of the fiscal year, highlighting the 6% organic revenue growth across all four segments.
The cardiovascular portfolio reported revenue of $2.850 billion, up by 5.5% as reported and 6.2% organically. The Cardiac Rhythm & Heart Failure (CRHF) division experienced mid-single-digit growth in several areas, including Micra™ transcatheter pacing systems. The Structural Heart & Aortic (SHA) saw growth driven by adopting the Evolut™ FX, among other factors. Moreover, the Neuroscience portfolio segment revenue stood at $2.219 billion, marking a 4.9% growth as reported and 5.6% organically. Significant milestones were achieved in Spine & Biologics growth, aided by the Aible™ ecosystem and the Mazor™ robotics. Additionally, the Medical Surgical portfolio includes the Surgical & Endoscopy (SE) and Patient Monitoring & Respiratory Interventions (PMRI) divisions, which reported revenue of $2.039 billion, up by 5.5% as reported and 6.1% organically. The SE division experienced growth in Advanced Surgical Technologies and Endoscopy, while the PMRI division saw growth in Patient Monitoring.
On the other hand, the Diabetes sector reported a revenue increase to $578 million, up 6.8% as reported and 6.3% organically. The non-U.S. markets showed robust growth due to increased adoption of the MiniMed™ 780G system. The U.S. market also witnessed a positive response to the launch of the MiniMed™ 780G system. Furthermore, Medtronic’s Evolut TAVR system, based on four-year results from the Evolut Low-Risk Trial, demonstrated superior outcomes and sustained valve performance compared to surgical aortic valve replacement (SAVR), with a notable reduction in rates of death or disabling stroke, positively impacting Medtronic’s position in the healthcare technology sector.
Medtronic’s financial results for Q1 FY24 showcase a company on the ascent, with solid revenue growth indicators across various portfolios. This is a testament to the company’s commitment to innovation and strategic market execution. The company is expected to announce the Q2 2024 results on November 21, 2023, impacting the market. Medtronic has revised its financial expectations for FY24, showcasing a more optimistic outlook. The company has raised its organic revenue growth guidance for FY24 to 4.5% from the previously estimated range of 4.0% to 4.5%. This organic projection excludes the influence of foreign currency and revenue from specific businesses categorized under ‘Other.’ Considering the foreign currency exchange rates from the start of August, the reported revenue growth for FY24 is anticipated to be around 2.75%.
Additionally, Medtronic has elevated its diluted non-GAAP EPS forecast for FY24 from the initial range of $5.00 to $5.10 to a new bracket of $5.08 to $5.16, reflecting a 7-cent increase at the midpoint. This adjustment aligns with the company’s operational EPS outperformance observed in Q1.
Unraveling the Bearish Pressure on Medtronic
Medtronic’s financial health is robust, and the technical forecast also indicates a solid bullish trend for the long term, as depicted in the monthly chart below. Still, based on emerging price patterns, a short-term price decline might be anticipated.
Notably, the stock price took an upward trajectory after hitting a low in 2009 at $17.09, showcasing a significant rise due to a combination of factors. First and foremost, the post-2009 period marked a global recovery from the financial crisis 2008, which positively impacted many industries, including healthcare. This economic upswing meant that more investments were flowing into promising sectors like medical technology.
Additionally, Medtronic made significant strides in innovation during this time, consistently launching new products and solutions that catered to a wide array of medical needs. The company’s commitment to R&D ensured that it remained at the forefront of the industry. Strategic acquisitions, like that of Covidien in 2014, also played a pivotal role. This merger expanded Medtronic’s product portfolio and further solidified its presence in the global medical device market. The company’s focus on expanding into emerging markets, combined with its efforts to streamline operations and improve efficiency, has also contributed to its financial growth and, consequently, its rising stock price. Furthermore, a growing global awareness and demand for advanced healthcare solutions meant that Medtronic’s diversified product range had a broadening customer base. These combined elements have positioned Medtronic as a robust and adaptive player in the medical device industry, leading to its stock appreciation post-2009.
Medtronic Monthly Chart (stockcharts.com)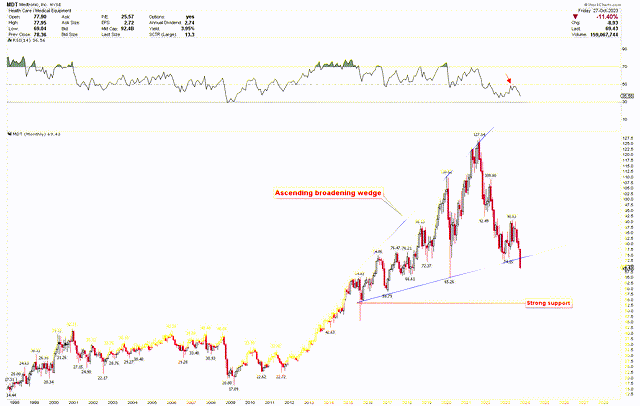
The robust surge post-2009 saw heightened volatility, evident from the ascending broadening wedge. This momentum reached its high at $127.14 in 2021, contained within this wedge, and then began its descent to the wedge’s support. Notably, the formidable support at $74 within the wedge was breached in October, with the October 2023 monthly candle seemingly set to close below this mark. This breach paves the way for a potential dip toward the wedge’s target of approximately $55. Hence, a price consolidation towards this level is anticipated before upward movement.
Additionally, Medtronic’s stock price downturn commenced when the RSI hit the median 50 and began its downward trajectory. This suggests sustained bearish pressure, driving the price toward the $55 target.
Moreover, the weekly chart of Medtronic underscores this bearish trend. Here, the long-standing red trendline is visibly breached, with the price downward. Last week’s inside bar, which has since been broken, implies that energy has accumulated at this level with a bias toward the downside. The breaking of this inside bar propels the downside momentum. Even though the RSI seems to be nearing an oversold state, the combination of the trendline breach and the inside bar signals further decline. The blue channel illustrates this bearish journey, and a breach of the red trendline might mean a further dip to the channel’s $45-$55 target, corroborated by the monthly chart mentioned earlier.
MDT Weekly Chart (stockcharts.com)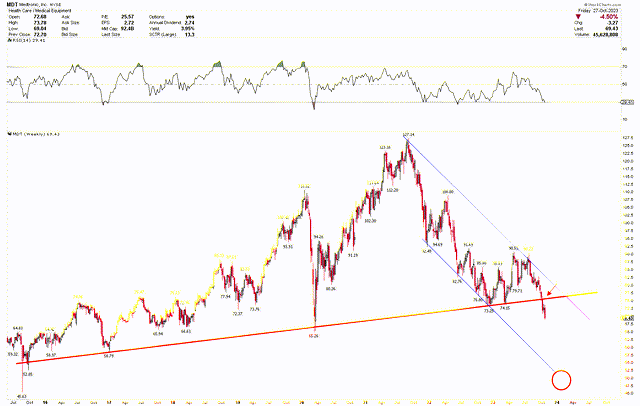
The daily chart emphasizes this strong bearish inclination, with the RSI hinting at an oversold situation. A minor market rebound might occur, but if the closing price remains below $74, a trajectory toward the $45-$55 range is more plausible. For now, investors can remain patient and consider entering the market when prices hover between $45-$55, aiming for a long-term uptrend.
MDT Daily Chart (stockcharts.com)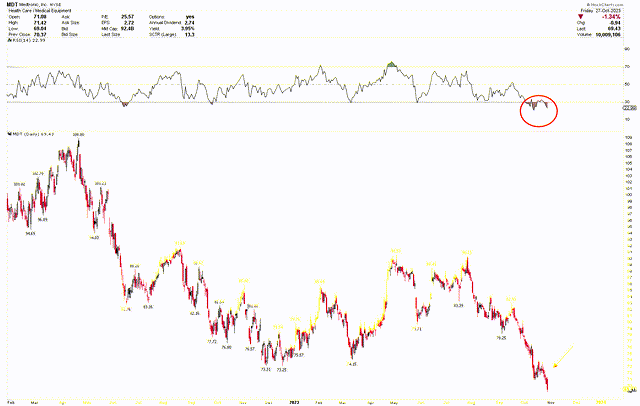
Market Risk
Inconsistencies in future performances, mainly if significant deviations from expected earnings or revenue in subsequent quarters, may weaken investor confidence. The company’s revenue stream is primarily tied to the performance of specific portfolios, such as the Cardiovascular and Neuroscience segments. Any external challenges, regulatory hurdles, or intensified competition that negatively impacts these sectors could affect the company’s overall standings. Furthermore, while products like the MiniMed™ 780G system are showing promise, the pace of their global adoption, especially in non-U.S. markets, remains a volatile factor. Geopolitical shifts, policy changes, or economic fluctuations in these markets can substantially influence Medtronic’s revenue.
The stock’s technical indicators suggest potential bearish movements in the short term, which may discourage short-term traders. This anticipated price volatility, coupled with potential market sentiment shifts towards a more bearish perspective, can lead to rapid sell-offs. The technical analysis underscores the need for caution, pointing to potential price consolidation and the importance of crucial support and resistance levels. Additionally, the bearish bias in daily, weekly, and monthly charts implies that while the long-term outlook remains positive, there’s a tangible risk of price declines in the near term.
Beyond these factors, Medtronic faces additional challenges that could hamper its growth. Regulatory and compliance risks, especially delays or denials in obtaining crucial product approvals, can disrupt the company’s projected growth trajectory. Strategic execution failures or delays in materializing key strategies can pose significant challenges. Furthermore, the medical technology landscape is rapidly evolving. Emerging competitors introducing innovative solutions can challenge Medtronic’s dominant market position. Therefore, in an environment brimming with both opportunities and challenges, stakeholders must maintain vigilance, keeping a close eye on both fundamental and technical indicators.
Bottom Line
Medtronic’s Q1 FY24 results paint an optimistic picture of its financial performance, underlined by robust revenue growth across its diverse portfolios. This growth is attributed to a consistent commitment to innovation, strategic market execution, and improved foundational metrics. The Cardiovascular and Neuroscience portfolios have mainly stood out, along with encouraging advancements in the Medical, Surgical, and Diabetes sectors. This ascendancy demonstrates Medtronic’s resilience and adaptability in the dynamic medical landscape.
However, the technical analysis presents a more cautionary tale. Despite the long-term bullish trajectory since 2009, recent indicators point towards a bearish trend in the short to medium term. The breakout from the ascending broadening wedge and RSI measurements highlight potential downward pressures, hinting at a probable price consolidation between the $45-$55 range. Investors are thus advised to exercise patience and potentially seek entry points within this bracket. Alternatively, if the price closes above $74 monthly, it suggests that the lowest point has been established and there’s potential for the price to increase further.
Analyst’s Disclosure: I/we have no stock, option or similar derivative position in any of the companies mentioned, and no plans to initiate any such positions within the next 72 hours. I wrote this article myself, and it expresses my own opinions. I am not receiving compensation for it (other than from Seeking Alpha). I have no business relationship with any company whose stock is mentioned in this article.
Seeking Alpha’s Disclosure: Past performance is no guarantee of future results. No recommendation or advice is being given as to whether any investment is suitable for a particular investor. Any views or opinions expressed above may not reflect those of Seeking Alpha as a whole. Seeking Alpha is not a licensed securities dealer, broker or US investment adviser or investment bank. Our analysts are third party authors that include both professional investors and individual investors who may not be licensed or certified by any institute or regulatory body.
