Summary:
- Advertising is typically considered a barometer of the overall economy.
- Behind the plummeting stock prices and also the earnings of Meta Platforms and Google, this article reexamines this common wisdom.
- Advertising expenditures are actually quite stable as a proportion of the overall GDP.
- After all, ad is what gets customers in the door in the first place and should be the last expense companies are willing to cut.
tommaso79/iStock via Getty Images
Thesis
This year, the days of digital advertising companies have generally been difficult, even for leaders like Google (NASDAQ:GOOG) (NASDAQ:GOOGL) and Meta Platforms (NASDAQ:META). There is little doubt that both companies, together with the rest of the sectors, are going through digital winter and faces chilling winds from multiple directions. The high uncertainties of the overall macro environment have made it more difficult for management at both GOOD and META to plan their next moves as reflected in their announced large-scale layoffs. The level of competitiveness has also intensified, with Apple (AAPL) and TikTok stirring up trouble for both.
Under this gloomy background, the thesis of this article is that A) I have no doubt both META and GOOG will survive this digital winter, and B) moreover, I also see reasons why they will emerge stronger. Combined with the currently compressed valuations, I actually see good prospects for investors to be rewarded handsomely.
And in the remainder of this article, let’s explore these reasons in detail together.
Ad vs. overall economy
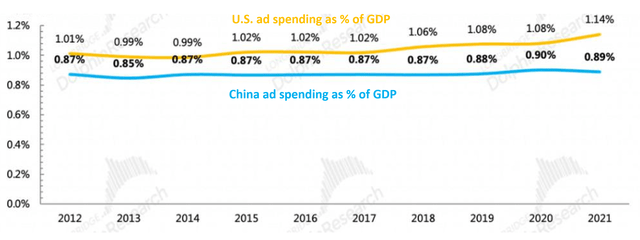
Advertising is typically considered a barometer of the overall economy. And hence, many investors probably attribute the plummeting stock prices and earnings of META and GOOG to the economic slowdown (or vice versa, using their performances as a sign of economic slowdown or even a recession). However, in reality, advertising expenditures are quite stable as a percentage of GDP as you can see from the following chart.
The chart shows the ad spending as a % of GDP for both the U.S. and China, the largest two economies in the world. As seen, the trend is generally very stable over the years. For China, the percentage has only fluctuated in a narrow range of 0.85% to 0.90% over the course of 10 years. For the U.S., the percentage has only fluctuated in a narrow range of 1.01% to 1. 80% over the same period with the exception of 2021, when the COVID pandemic triggered epic quantitative easing and unexpectedly boosted ad spending. And also, you can see that developed countries like the U.S., where consumption contributes more to the overall economy, have higher spending on ad. The US spends on average 15% to 20% more than China on advertising as a fraction of GDP.
To summarize, the first reason I see is that ad spending is actually quite stable, despite the market fear of continued profit pressure for advertisers like GOOG and META. After all, ad is what gets customers in the door in the first place and should be the last expense companies are willing to cut.
And the above discussion also naturally leads me to the next reason: the growth potential of digital ads.
META and GOOG: digital ad growth potential
As just mentioned above, developed countries like the U.S. spend about 15% to 20% higher than developing countries like China on advertising as a fraction of GDP. This leaves plenty of room for further growth, especially in developing countries – where the majority of the people currently live and where the eCommerce revolution is taking place at a faster pace.
For example, according to this Globe Newswire report, the global digital ad market is projected to $946.9 Billion by 2027 from the $357B level in 2020, translating into an annual growth rate of 14.9%. A few more specifics are quoted from this report on display and search ads:
- Display, one of the segments analyzed in the report, is projected to record a 16.7% CAGR and reach US$565.8 Billion by the end of the analysis period.
- Taking into account the ongoing post-pandemic recovery, growth in the Search segment is readjusted to a revised 13.1% CAGR for the next 7-year period.
As seen, both display and search segments are projected to grow at a mid-teens annual rate in the foreseeable future, two segments where GOOG and META dominate and are best poised to capitalize, as to be elaborated on next.
Source: Globe Newswire report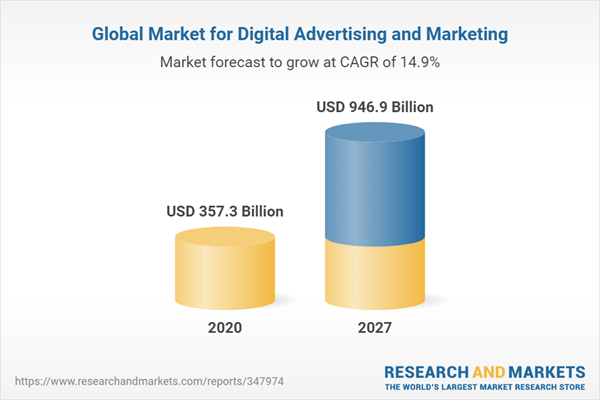
The GOOG and META duopoly
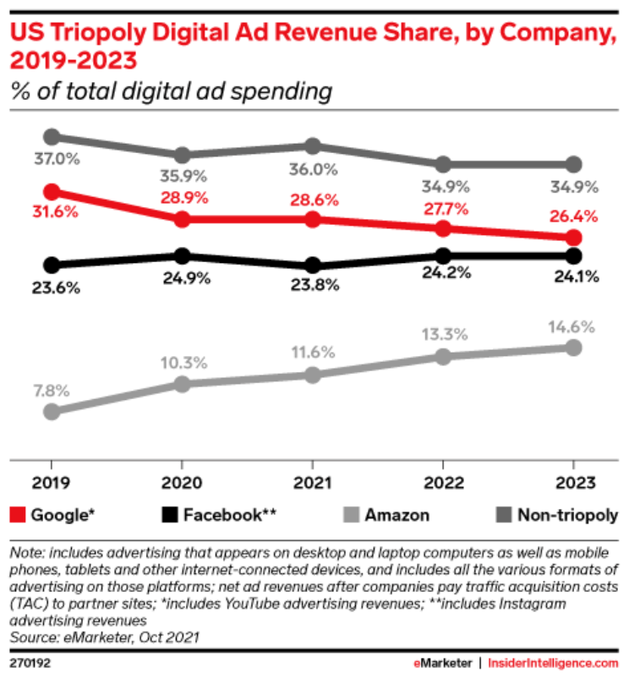
It is a truism in the digital ad space that there’s META and GOOG, and then there’s everyone else. Despite all the headwinds and competitions aforementioned, this is still a truism now as seen from the chart below.
First admittedly, GOOG has slowly lost some of its market shares over the years and META’s market share has been stagnating due to these headwinds and competition intensification. But bear in mind that A) the overall digital ad pie has become (and will keep becoming) much larger as just mentioned, and B) the overall digital ad landscape is dominated by this duopoly, and I see the dominance to continue in the foreseeable future. To wit, GOOG is projected to claim more than a quarter of the total market share in 2023 (26.4%), and META is projected to claim almost another quarter (24.1%). Combined, these two top dogs are projected to claim more than half of the total market (50.5% to be exact).
Return projections
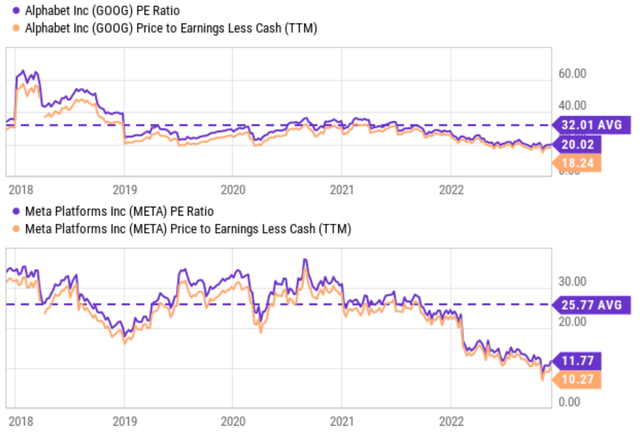
Despite the above business fundamentals and addressable market projections, both stocks are trading at contracted valuation multiples as seen in the chart below. GOOG is currently trading at a 20.02x PE as seen. Then bear in mind that it has a sizable cash position on its ledger. Its total net cash position is about $125B and its total debt is about $28B, leading to a net cash position of ~$97B. When the cash is accounted for, its PE sits at an even lower multiple of 18.24x, near the lowest level in 5 years and only about ½ of its average PE of 32x. The picture for META’s PE contraction is very similar, perhaps more dramatic as seen in the bottom panel. META is currently trading at an 11.77x PE only. And again, META has a sizable cash position on its ledger too. After its cash position is accounted for, its PE is only 10.27x, again not only near the lowest level in 5 years but also less than ½ of its average PE of 26x.
Their currently compressed valuations, combined with the growth curve ahead, provide excellent prospects for outsized total return potential. And as you can see from the first chart below, the consensus estimates project a large EPS contraction in 2023 (I’ve warned you about the digital winter), followed by a growth rate of 7.6% CAGR in the next 5 years starting 2023. In GOOG’s case (the second chart below), the consensus estimates project a growth rate of 14% CAGR in the next 5 years.
My estimates are a bit different. My approach to estimating growth rates involves estimating their ROCE (return on capital employed) and their Reinvestment Rate (“RR”). And as detailed in my other articles, this approach shows a projected growth rate of 8.3% for both META and GOOG. Both META and GOOG’s average ROCE has been about 55% recently and their RR about 15%, leading to a growth rate of 8.3% (55% ROCE * 15% RR = 8.3% growth rates).
However, regardless of which growth rates you trust more, the overall return picture remains attractive. Both META and GOOG are projected to provide an outsized total return potential in the long term in the double-digit range. To wit, my estimated total annual return is nearly 20% for META in the next few years, consisting of about 10% earnings yield (because of its ~10x PE), 8% growth as just analyzed above, and at least 2% from PE multiple expansion. For GOOG, my estimated total annual return is nearly 16% in the next few years, consisting of about 5.5% earnings yield (because of its ~18x PE), also 8% growth rate, and again about 2% of PE expansion per year.
Source: Seeking Alpha data Source: Seeking Alpha data

Risks and final thoughts
Investment in both META and GOOG entails some risks. Both businesses are facing a range of macroscopic risks (which are the same for other companies) and also company-specific risks.
In terms of macroscopic risks, besides the economic cycle aforementioned, both companies also face currency exchange rate uncertainties. The Ukraine/Russian war is a wild card too. Both advertising giants derive more than 50% of their revenue outside the United States, which exposes them to currency rates and geopolitical risks globally. As disclosed in their third-quarter earnings reports, exchange rate disturbances have dragged down revenue growth by 5% and 7% respectively for GOOG and META. Both businesses are almost constantly involved in lawsuits, both in the U.S. and abroad, on issues like privacy practice and anti-trust investigations.
Specific to both companies, I see GOOG’s business model as less affected by Apple’s ATT change than META. Although many of Google’s products (notably YouTube) are affected by Apple’s ATT policy change, GOOG continues to maintain its strength with search advertising. And I view Meta’s business model as more disrupted by Apple ATT policy change. At the same, TikTok has been commercialized since the beginning of the year and also disrupted Meta’s role in the social media space.
All told, there is little doubt that META and GOOG are in a digital ad winder. And my thesis is that they will not only survive it but also emerge stronger. Ad spending is actually quite stable as a percentage of GDP. I see the current market fear of continued profit pressure for advertisers like GOOG and META as overblown. Furthermore, there is plenty of room for further digital ad growth globally, especially in developing countries. Currently, developed countries like the U.S. spend about 15% to 20% higher than developing countries like China on advertising as a fraction of GDP. Both giants derive more than 50% of their revenue outside the U.S. and are best positioned to tap into this global trend. The combination of valuation compression and healthy growth prospects offers an attractive annual return potential in the upper teens (or even 20% in the case of META).
Disclosure: I/we have a beneficial long position in the shares of AAPL either through stock ownership, options, or other derivatives. I wrote this article myself, and it expresses my own opinions. I am not receiving compensation for it (other than from Seeking Alpha). I have no business relationship with any company whose stock is mentioned in this article.
As you can tell, our core style is to provide actionable and unambiguous ideas from our independent research. If your share this investment style, check out Envision Early Retirement. It provides at least 1x in-depth articles per week on such ideas.
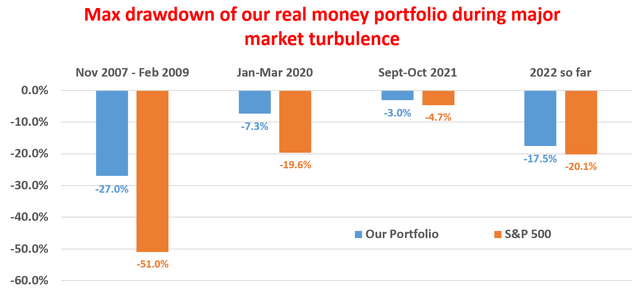
We have helped our members not only to beat S&P 500 but also avoid heavy drawdowns despite the extreme volatilities in BOTH the equity AND bond market.
Join for a 100% Risk-Free trial and see if our proven method can help you too.
