Meta Platforms: Bet Against The Insiders
Summary:
- Meta Platforms, Inc. trading activities were dominated by sellers in 2022.
- Its insider activities were 100% selling and there was no single case of insider buying in 2022.
- The thesis of this article is twofold. First, I will argue against the obvious implications of the insider activities.
- And second, I will use the insider selling prices as input to perform Kelly betting analysis.
- The results show the hallmarks of a very favorable bet size.

Vladimir Zakharov
Thesis
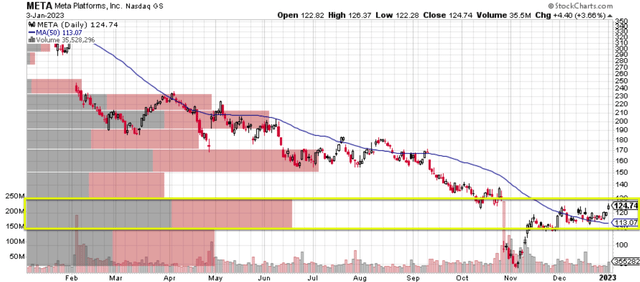
Trading activities surrounding Meta Platforms, Inc. (NASDAQ:META) were dominated by sellers in 2022. In the open market, the first plot below shows the stock suffered huge price plunges on heavy volumes twice: first in February 2022, then again in November 2022. Most of the selling volume after the second wave of selling happened in a range between $110 to $130, as highlighted by the yellow rectangle.
Source: Author based on data from stockcharts.com
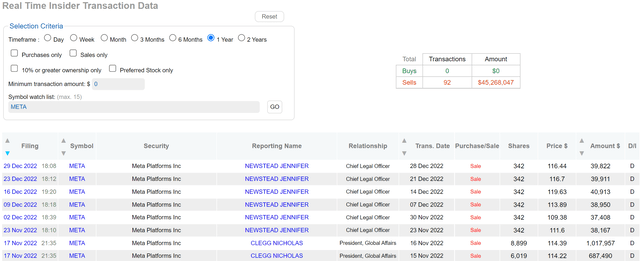
In terms of insider activities, the picture is also completely dominated by selling, as seen from the 2nd chart below. During 2022, there were a total of 92 insider transactions, and all of them were sellers. There was no single case of insider buying. These 92 insider transactions resulted in total cumulative selling of $45.3M. As seen, their selling prices in November and December were in the price ranges between $110 to $130, as just mentioned.
Source: DataRoma.com
As explained in my earlier article:
When it comes to insider activities, usually I pay more attention to buying activities than selling activities. The reason is that selling activities can be triggered by a range of factors irrelevant to business fundamentals (such as divorce or buying a new house). In contrast, insider buying activities usually have only one explanation – the insiders think the stock is undervalued.
However, when the selling activities are so one-sided as in META’s case here, it does get my attention. And my thesis here is that such one-sided selling activities signal that the pessimistic sentiment has reached its peak already. A Kelly betting analysis will show that Meta Platforms, Inc. stock now displays all of the hallmarks of a very favorable bet: a convicted bet size and an extremely favorable return profile.
META valuation: a growth stock priced as a value stock now
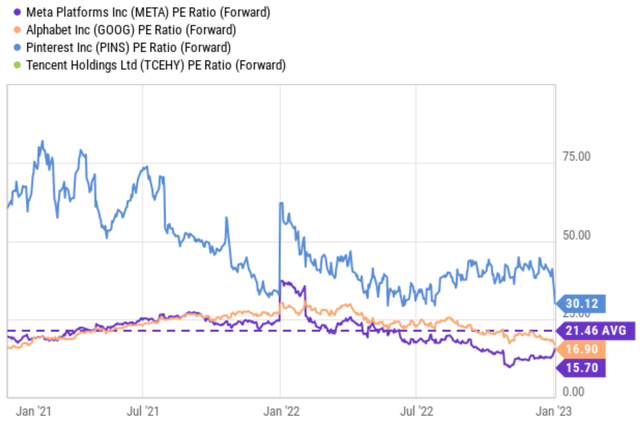
The sharp price correction brought about by the selling pressure mentioned above has pushed META’s valuation to a value regime. This tech stock with high growth potential is now essentially trading as a value stock at 15.7x FWD P/E as seen in the chart below. It is trading at a large discount, both compared to the overall tech sector (QQQ is trading at 22x P/E) and some of its close peers seen in the chart below. Its FW P/E of 15.7x is about 8% discounted from Google’s 16.9x, and only about ½ of Pinterest’s 30x.
Yet, Meta Platforms, Inc. stock still generates plenty of cash from its existing business and is well-poised to capitalize on new growth areas, as to be detailed next.
Source: Seeking Alpha data
Business prospects and growth potential
It is important here to delineate the immediate term and the medium term here. In the immediate terms, Meta Platforms, Inc. stock faces headwinds on several fronts, including decline in user activity from competition (such as TikTok), privacy issues, and also new regulations that could impact monetization. In particular, according to this Wall Street Journal report, META could be held accountable for not complying with the General Data Protection Regulation issued by the European Union countries in 2018.
However, looking past these immediate issues, I anticipate solid operating improvement in the next 2~3 years. META remains well- positioned in the social media space. I see good potential for acceleration in its Reels and messaging monetization. Its recent repositioning of its strategic spendings (such as lower spending on Metaverse CAPEX) could help with cash flow, too. Moreover, TikTok could potentially be restricted by new legislation to benefit META’s usage and ad revenue. Mobile advertising should remain an important driver of performance in the next 2 or 3 years as well.
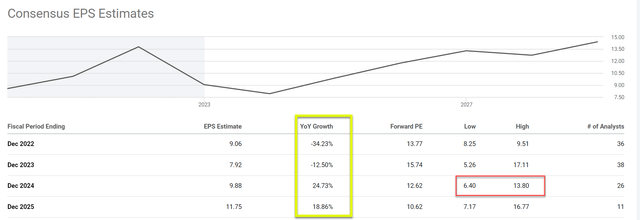
Both the near-term and medium-term prospects seem to be well-captured in the consensus estimates shown below. As you can see, consensus estimates do anticipate a large EPS decline 2022 (which has already happened) and in 2023, too. To wit, consensus estimates project a 12.5% EPS decline in 2023. However, after that, consensus estimates project robust growth: 24.7% in 2024 and 18.8% in 2025, as highlighted in the yellow box.
Source: Seeking Alpha data
META’s Kelly bet analysis
Based on the above valuation and business prospects, the table below shows the most likely scenarios that I see for the next 2 or 3 years:
- As a base scenario, I see a target price of $113, essentially its 50-day MA (moving average price). Recall that the first chart also shows most of the selling volume after the Q3 earnings report occurred in a range between $110 to $130 too.
- As a bullish scenario, I am assigning a 20x P/E and a 2024 EPS of $13.8, the high-end of consensus estimates as shown above (highlighted in the red box). These assumptions lead to a projected price of $276, translating into total return of 121%.
- Finally, as a bearish scenario, I am assigning a 15x P/E and a 2024 EPS of $6.4, the low-end of consensus estimates as highlighted in the red box above. These assumptions lead to a projected price of $96, translating into total loss of 23%.

Source: Author
In the remainder of this article, I will assess the risk/reward profile using the Kelly bet size analysis. Details of the Kelly method can be found in my earlier article on Altria. And the key benefits of the Kelly method are briefly recapped below:
- Usually, the discussion surrounding an uncertain stock like META would turn into a subjective debate between the bulls, each with plenty of their own ammunition.
- The Kelly method helps to turn such subjective debate into more action-oriented decision-making. The Kelly bet analysis is a way to determine bet sizing as a percentage of bankroll that leads to optimal growth in the long run (i.e., if you place a large number of the same bet over and again).
- Another reason I use it is that it not only considers the expected return, but also the variance among the outcomes, which is equally important, or more important in high-uncertainty situations like this.
With the above background, the table below summarized my Kelly bet results for META. I always like to be on the conservative side. Hence, here I am assigning a 50% chance for the bearish case mentioned above. And I am only assigning a 25% chance for the base case and bullish case each. Under these conservative assumptions, you can see that the bet size is a quite convicted 69.8% of the bankroll and the expected return is a healthy 4.86% (note this is the return that you will get on average per bet if you keep placing such bets repeatedly).
You can (and should) tweak these odds to suit your own judgment using the above Kelly calculator. For me, besides the “mostly like odds”, another set of odds that I always check are the “break-even odds” – the odds that make the expected return zero. As seen, to make the expected zero, we have to further increase the odds of the bearish case to 65% and decrease the odds for the base case and bull case to 20% and 15%. Under these even more conservative odds, the expected return is now close to 0% (and so is the Kelly bet size, too, about 4.9% of the bankroll now). For me, these break-even odds show how favorable the bet is. Even when there is only a 15% chance for the bull scenario, the bet would not lose money statistically.

Source: Author
Risks and Final thoughts and risks
To recap, Meta Platforms, Inc. does face headwinds on several fronts in the near term, such as decline in user activity, competition (e.g., from TikTok), privacy regulations, et al. Since the Kelly method itself is a tool for risk analysis, I won’t further dive into these risks (plus many of them have been detailed by other Seeking Alpha authors and also in our other META articles). Instead, here let me articulate the limitations of the Kelly method itself. As mentioned in my earlier writing:
The Kelly analysis itself cannot – nothing can – turn investment decisions into a completely scientific and objective process. If uncertainties/risks can be quantified, then they are not uncertainties/risks to start with. In the end, some degree of subjective judgment is always required based on each person’s risk tolerance. For me, the Kelly analysis maps out the bounds and limits of the risks, so I can judge if I am comfortable with those limits.
To conclude, I normally don’t pay attention to insider selling activities. But the selling activities surrounding Meta Platforms, Inc. has been so one-sided in the past year that I had to believe it signals the pessimistic sentiment reaching its peak. And a Kelly betting analysis does show that Meta Platforms, Inc. stock now offers a favorable betting profile.
Disclosure: I/we have no stock, option or similar derivative position in any of the companies mentioned, and no plans to initiate any such positions within the next 72 hours. I wrote this article myself, and it expresses my own opinions. I am not receiving compensation for it (other than from Seeking Alpha). I have no business relationship with any company whose stock is mentioned in this article.
As you can tell, our core style is to provide actionable and unambiguous ideas from our independent research. If your share this investment style, check out Envision Early Retirement. It provides at least 1x in-depth articles per week on such ideas.
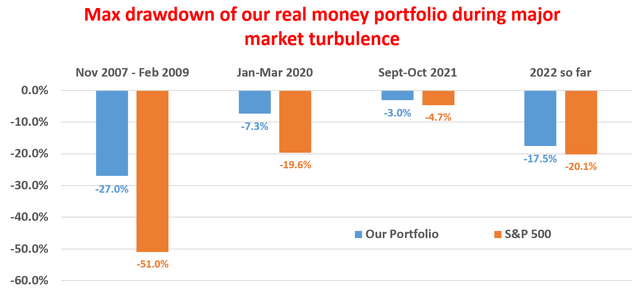
We have helped our members not only to beat S&P 500 but also avoid heavy drawdowns despite the extreme volatilities in BOTH the equity AND bond market.
Join for a 100% Risk-Free trial and see if our proven method can help you too.
