Summary:
- Meta Platforms, Inc. presents a complex landscape marked by robust revenue growth, particularly in advertising, yet declining operating margins, highlighting the need for careful assessment of its investment potential.
- The metaverse, while promising, currently contributes modestly to Meta’s revenue, and achieving the ambitious growth rates required to justify its valuation remains a challenge.
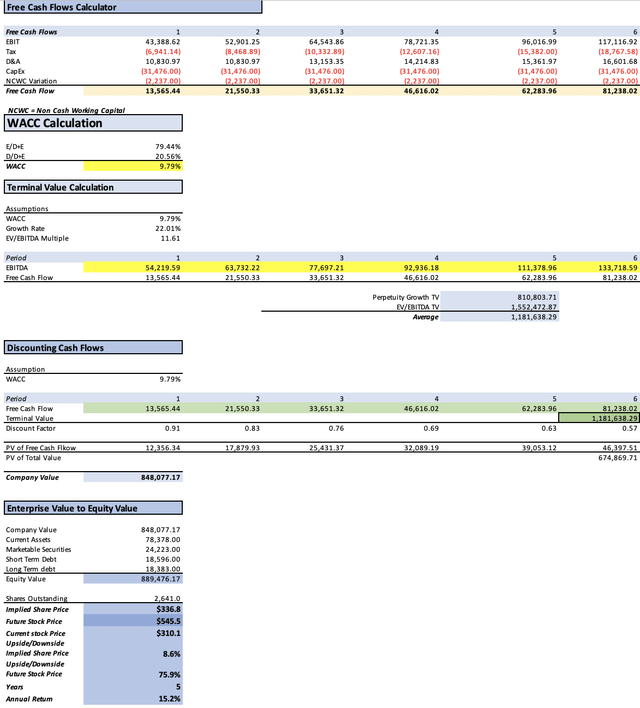
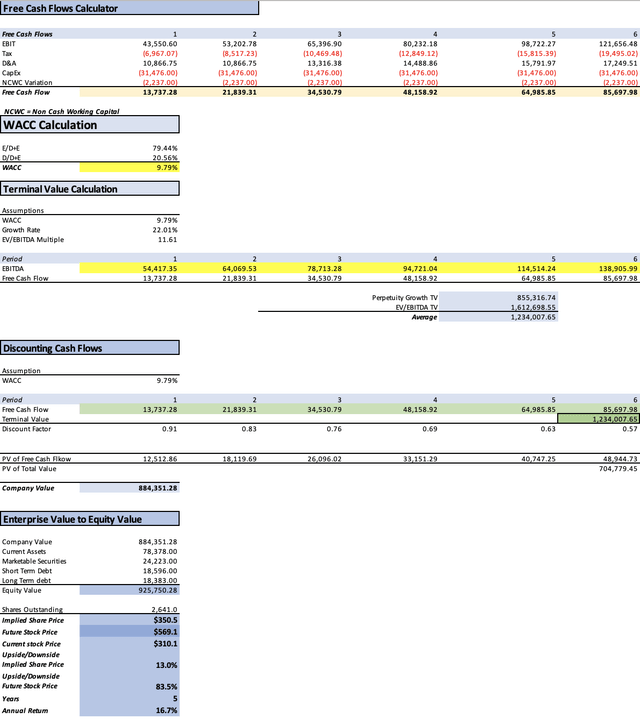
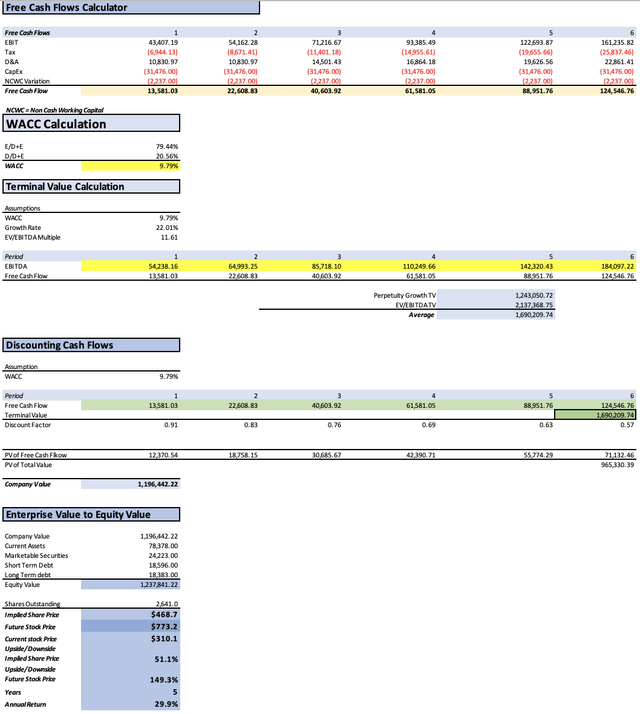
- Three valuation scenarios suggest potential upside: $336.8 with an 8.6% return, $350.5 with a 13% return, and $468.7 with a 29.9% return.
- Despite the $336.8 target, various risks, including no more workforce reductions and uncertain income from Reality Labs, lead to a “hold” rating for Meta’s stock.
Nathan Howard/Getty Images News
Thesis
Meta Platforms, Inc. (NASDAQ:META) has recently delivered an impressive 239% return to investors who purchased it at its November 2022 low of $90.79. In this article, I will delve into determining the fair value of Meta to assess whether it can still offer a compelling annual return. As you will discover, the initial model suggests an upside of 8.6%, but this figure may fluctuate if Meta increases its CapEx, leading to reduced cash flows and, subsequently, a potential downside of up to 3.6%. The most optimistic scenario postulates that Meta would need to achieve a remarkable 24.28% revenue growth rate to attain the fair value proposed by that particular model – a rate considerably higher than what analysts anticipate. In conclusion, the projected annual returns from the first two models only reach as high as 15.95%, which falls short of an attractive investment. Therefore, I recommend rating Meta as a “hold”
Overview
Revenue by Segment
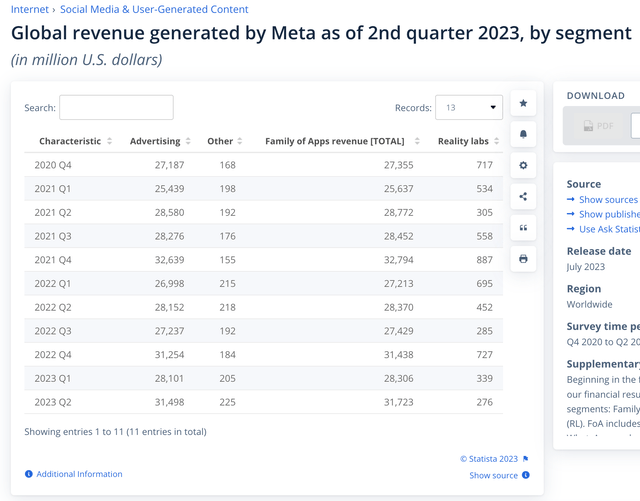
The vast majority of Meta’s revenue is derived from advertising, to be precise, a staggering 97.5%. The remaining 2.5% is sourced from app revenue and Reality Labs, commonly referred to as the metaverse.
It’s noteworthy that advertising revenue has exhibited relative stability, experiencing a plateau since its significant surge in 2020, largely attributed to the pandemic. In contrast, Reality Labs seems to be facing challenges. Over the past four quarters, this segment witnessed a considerable decline, resulting in a revenue loss of $487 million.
The segment displaying the most promising growth potential is, undoubtedly, the metaverse, with an expected growth rate of 36.8% from 2023 to 2030. If Meta can sustain this growth, the metaverse segment has the potential to generate $10.6 billion by 2028. Nevertheless, this remains less than 10% of Meta’s total revenue, indicating that Meta’s dependence on advertising is likely to persist in the foreseeable future.
Author’s Calculations with based on Statista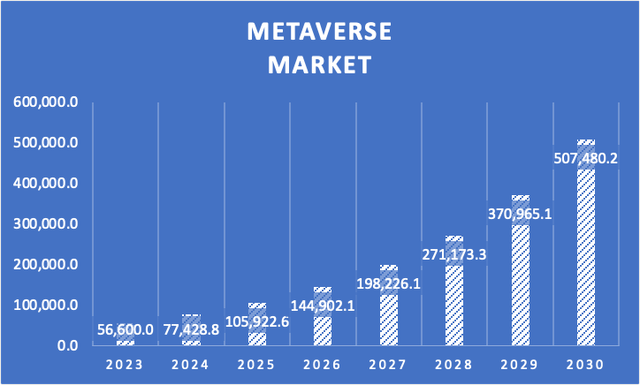
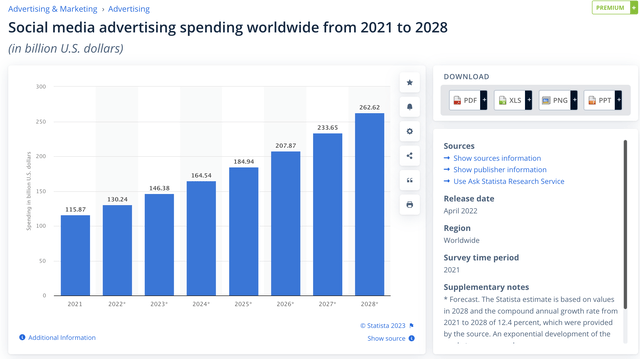
Interestingly, the landscape of social media advertising is far from diminishing. On the contrary, expenditures on social media advertising are projected to grow at a substantial rate of 15.88% from 2023 to 2028. This factor acts as a safeguard for Meta’s core revenue source for the time being.
Financials
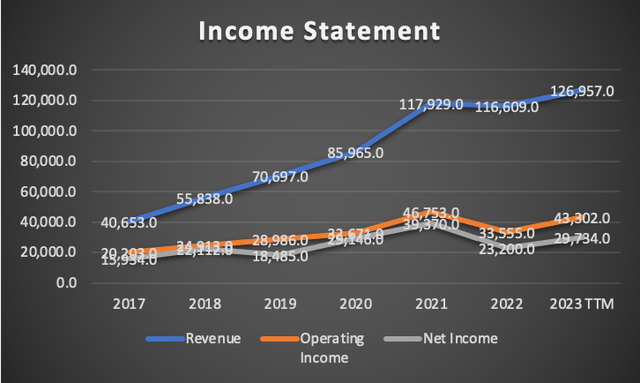
Meta’s revenue has undoubtedly experienced significant growth. Between 2017 and 2021, it achieved an impressive annual growth rate of 30%. However, this growth trajectory has shown signs of slowing down in recent years, with the growth rate from 2021 to 2023 diminishing to 3.41%, marking a more than 80% reduction in revenue growth.
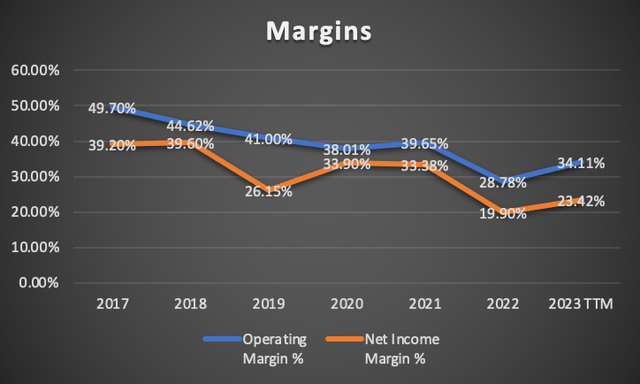
Notably, margins have contracted, with both the net operating margin and net income margin declining by over 15% from their 2017 peaks. Presently, the operating margin stands at 34.11%, and the net income margin is at 23.42%, both respectable figures. However, it’s concerning to observe the persistent decline in both figures, which occurred even before the “metaverse concerns” that triggered a 72% drop in Meta’s stock price, coupled with the onset of monetary tightening.
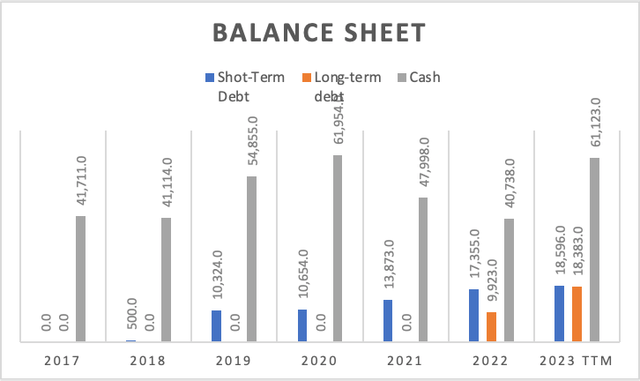
While Meta’s balance sheet is very robust as always, if you date back to 2017. Despite an increase in debt, the rise in cash reserves has outpaced it. If Meta wanted, it could pay all of its debts with that cash reserve of $61.12 billion.
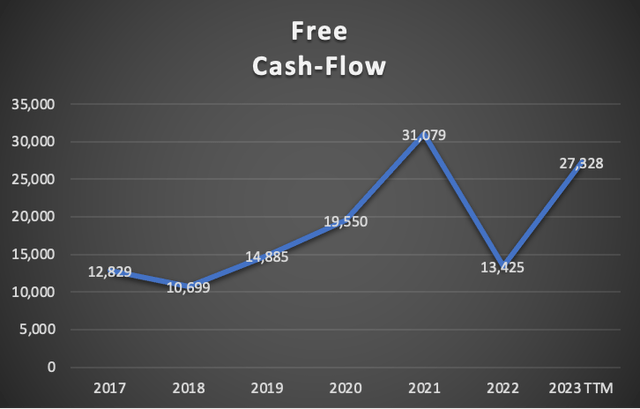
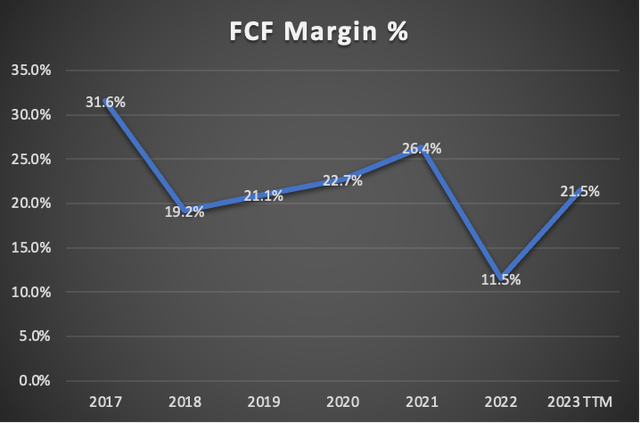
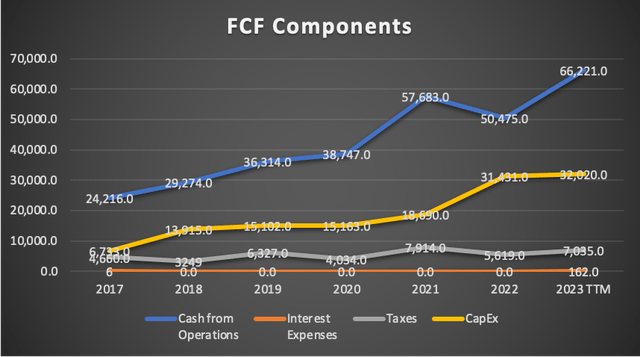
The real shift becomes evident in the free cash flow, which has plummeted from $31 billion in 2021 to $$27.32 billion in 2023, marking a 11.9% decline. Its margin has also experienced a reduction, now standing at 21.5%, down from the 31% recorded in 2017. It’s essential to acknowledge that Meta substantially increased its capital expenditures in 2021 and 2022, from around $18 billion to approximately $32 billion, which is the primary reason for the sharp decline in free cash flow during this period. This ultimately implies that Meta’s cash flow remains robust, as adjusting for those capital expenses, the 2021 FCF would amount to $26 billion and 2023’s to $31 billion.
Finally, it’s worth noting that the increase in capital expenditure seems to be correlated with the rise in stock-based compensation. Essentially, this means that the money that would have been an outflow as salary expenses now remains within the company as an inflow due to stock-based compensation, and Meta decided to spend that extra money on CapEx. However, this also signifies that when stock-based compensation decreases, capital expenditures decrease. This detail is not explicitly accounted for in my valuation model, because, as previously mentioned, the total outflow remains consistent.
Stock-Based Compensation (Seeking Alpha)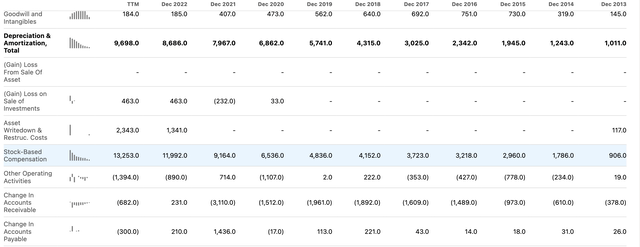
In summary, Meta has achieved substantial revenue growth, albeit with declining operating margins. The company maintains a strong balance sheet, and its slight reduction in free cash flow can be attributed to increased capital expenditures associated with higher stock-based compensation. Consequently, Meta seems to be strategically leveraging the current situation to its advantage.
Valuation
I will conduct three distinct valuation models for Meta. The first model will incorporate the revenue growth rate anticipated by analysts, which stands at 8.7%. In the second scenario, I will consider the metaverse’s projected growth rate of 36.8%. Lastly, the third scenario will factor in both the anticipated growth rate for spending on social media advertising at 15.88% and the metaverse’s expected growth rate of 36.8%. This third scenario represents the most optimistic outlook.
Notably, within the table of assumptions, which includes all the currently available financial data for Meta, I have calculated depreciation and amortization (D&A) expenses, as well as interest expenses, by linking them to a margin relative to revenue. Concerning capital expenditures (CapEx), while the model theoretically suggests that CapEx should also be calculated using the margin determined by the model, I have chosen to assume that CapEx will remain constant throughout 2028. This decision ultimately serves to benefit Meta’s cash flows positively.
| TABLE OF ASSUMPTIONS | |
| (Current data) | |
| Assumptions Part 1 | |
| Equity Value | 134,033.00 |
| Debt Value | 36,978.00 |
| Cost of Debt | 0.44% |
| Tax Rate | 20.40% |
| 10y Treasury | 4.80% |
| Beta | 1.3 |
| Market Return | 10.50% |
| Cost of Equity | 12.21% |
| Assumptions Part 2 | |
| EBIT | |
| Tax | 5,779.00 |
| D&A | 9,698.00 |
| CapEx | 31,476.00 |
| Capex Margin | 26.12% |
| Assumption Part 3 | |
| Net Income | 22,546.00 |
| Interest | 162.00 |
| Tax | 5,779.00 |
| D&A | 9,698.00 |
| Ebitda | 38,185.00 |
| D&A Margin | 8.05% |
| Interest Expense Margin | 0.13% |
| Revenue | 120,525.0 |
Analysts’ Estimates Scenario
In this initial scenario, I will assume that Meta’s revenue will grow at an estimated rate of 8.07%, while net income will increase by an estimated 22.01%. Additionally, for 2023 and 2024, I have incorporated the revenue estimates available on Seeking Alpha’s summary page for Meta’s stock ticker.
| Revenue | Net Income | Plus Taxes | Plus D&A | Plus Interest | |
| 2023 | $132,460.0 | $27,508.37 | $33,120.76 | $43,779.11 | $43,957.15 |
| 2024 | $148,850.0 | $33,562.97 | $40,410.64 | $51,068.99 | $51,247.03 |
| 2025 | $160,862.2 | $40,950.18 | $49,305.03 | $62,248.74 | $62,464.96 |
| 2026 | $173,843.8 | $49,963.31 | $60,157.06 | $74,145.34 | $74,379.00 |
| 2027 | $187,873.0 | $60,960.24 | $73,397.63 | $88,514.76 | $88,767.28 |
| 2028 | $203,034.3 | $74,377.58 | $89,552.45 | $105,889.53 | $106,162.43 |
| ^Final EBITA^ |
The current fair value of Meta, standing at $336.8, represents an 8.6% upside from the current stock price of $310.1, according to the model. Furthermore, the model projects an annual return of 15.2% until the stock reaches the expected future value of $545.5.
Metaverse Revenue Growing at a 36.8% Rate
In this second scenario, I will propose the fair value of Meta if its metaverse business were to grow at a rate of 36.8%, aligning with the expected CAGR of the global metaverse market as suggested by Statista.
As evident in the table below, Meta’s metaverse business could potentially generate $10.6 billion by 2028. However, this figure would only constitute approximately 4.7% of Meta’s future revenue if the advertising segment continues to grow at the 8.7% rate.
| Metaverse Revenue Projections | |
| 2023 | $2,225.74 |
| 2024 | $3,044.81 |
| 2025 | $4,165.30 |
| 2026 | $5,698.12 |
| 2027 | $7,795.03 |
| 2028 | $10,663.61 |
| Revenue | Net Income | Plus Taxes | Plus D&A | Plus Interest | |
| 2023 | $132,897.6 | $36,413.95 | $43,381.02 | $54,247.77 | $54,417.35 |
| 2024 | $149,885.4 | $44,515.98 | $53,033.20 | $63,899.95 | $64,069.53 |
| 2025 | $162,856.0 | $54,719.61 | $65,189.09 | $78,505.47 | $78,713.28 |
| 2026 | $177,195.1 | $67,156.96 | $80,006.07 | $94,494.94 | $94,721.04 |
| 2027 | $193,131.9 | $82,660.43 | $98,475.82 | $114,267.80 | $114,514.24 |
| 2028 | $210,957.1 | $101,892.28 | $121,387.30 | $138,636.80 | $138,905.99 |
| ^Final EBITA^ |
The current fair value of Meta, which stands at $350.5, represents an 13% upside from the current stock price of $310.1, as per the model’s calculations. Furthermore, the model predicts an annual return of 16.7% until the stock reaches the anticipated future value of $569.1.
The most optimist scenario
In this third and final scenario, we’re in a position to supercharge Meta while maintaining constant CapEx, resulting in a favorable outlook. In this model, we consider the expected annual growth in social media advertising through 2028 at 15.88%. As indicated in the table below, with the actual TTM revenue of $120.52 billion increasing to an estimated $279.58 billion by 2028, Meta would need to achieve an impressive revenue growth rate of 26.39%. This rate far exceeds the expectations of analysts.
| Revenue | Net Income | Plus Taxes | Plus D&A | Plus Interest | |
| 2023 | $132,460.0 | $36,294.04 | $43,238.17 | $54,069.13 | $54,238.16 |
| 2024 | $152,598.8 | $45,321.84 | $53,993.26 | $64,824.22 | $64,993.25 |
| 2025 | $177,348.8 | $59,589.19 | $70,990.37 | $85,491.80 | $85,718.10 |
| 2026 | $206,244.6 | $78,166.71 | $93,122.31 | $109,986.49 | $110,249.66 |
| 2027 | $240,027.9 | $102,731.92 | $122,387.59 | $142,014.15 | $142,320.43 |
| 2028 | $279,589.2 | $135,041.59 | $160,879.05 | $183,740.46 | $184,097.22 |
| ^Final EBITA^ |
| Social Media Advertisement Revenue | |
| 2023 | $129,148.50 |
| 2024 | $149,553.96 |
| 2025 | $173,183.49 |
| 2026 | $200,546.48 |
| 2027 | $232,232.82 |
| 2028 | $268,925.61 |
The current fair value of Meta, amounting to $468.7, presents a 51.1% upside from the current stock price of $310.1, as suggested by the model. Additionally, the model foresees an annual return of 29.9% until the stock reaches the anticipated future value of $773.1.
Risks to Thesis
The primary risk to this bearish thesis lies in the potential for Meta to deliver an unexpectedly strong performance in terms of revenue. Should the company significantly surpass revenue expectations, it could lead to an increase in the fair value estimate, potentially mitigating or even eliminating the projected downside.
The second risk factor is market-related. If the current optimism surrounding Meta’s stock continues, it could propel the stock towards the “future value” projected by the first DCF model, known as the “Analysts’ Estimates Scenario.” In such a scenario, maintaining a “sell rating” would be prudent because as the stock becomes more overvalued, the level of risk also increases. When a correction occurs, its impact tends to be more severe in overvalued stocks.
Finally, there is the possibility of Meta diversifying into cloud services, a relatively stable and predictable market. Should Meta decide to enter this sector, it could potentially generate substantial revenue quickly. In this case, adjustments to the analysis and outlook would be necessary to account for this new development.
So what?
According to these models, Meta presents the potential for favorable returns. However, the scenario with the most realistic prospects is the “Analysts’ Estimates Scenario.” The other two scenarios were ruled out by Meta itself during its Q3 earnings release when the company stated:
The company said it expects Reality Labs’ operating losses “to increase meaningfully year-over-year due to our ongoing product development efforts in augmented reality/virtual reality and our investments to further scale our ecosystem.”
It’s worth noting that I have favored Meta by maintaining CapEx at a consistent value of $31.4 billion across all projections. Typically, Meta would increase CapEx as it accumulates more cash flows, and this applies to all scenarios. Initially, I allowed Meta’s CapEx to grow in alignment with revenue, using the CapEx margin from the assumptions table. This approach resulted in a potential downside of approximately 3.6% in the “Analyst’s Estimates Scenario.”
It’s also worth drawing a parallel between Meta and General Electric Company (GE), which annually reduced its underperforming workforce by 10%, contributing to consistent earnings beats. Meta has cut 20,300 employees, reducing its workforce from 86,482 in 2021 to 66,185 in Q3 2023. With an average salary of $177,407, these workforce reductions have resulted in significant cost savings. From Q2 to Q3 2023, a cut of 5,283 employees translated to savings of approximately $937.42 million, equivalent to $0.35 per share – a substantial financial boost.
Considering all these factors, I’ve set a target for Meta’s stock at $336.8, indicating a potential 8.6% upside. However, I advise against purchasing it due to the factors mentioned earlier. As a result, I rate Meta as a “hold.”
Furthermore, it’s essential to note that this article was initially scheduled for publication on October 22, three days before Q3 earnings. In the earlier version, Meta was going to receive a “sell” rating, with the first and second models indicating a downside ranging from 13% to 20%.
Conclusion
In conclusion, the analysis of Meta Platforms, Inc. reveals a complex landscape with several key takeaways. The company’s robust revenue growth in recent years, particularly driven by its advertising segment, has been met with declining operating margins. While the metaverse presents a promising growth avenue, its current contribution to revenue is relatively modest, and the substantial growth rates required to justify Meta’s valuation seem ambitious. Furthermore, Meta’s financial performance is subject to uncertainties, with fluctuations in free cash flow, coupled with the influence of increased capital expenditures due to stock-based compensation.
Adding to this complexity are the results from three distinct valuation models. In the first scenario, which assumes an 8.07% revenue growth rate and a 22.01% net income growth rate, the current fair value of Meta is $336.8, indicating an 8.6% upside from the current stock price. In the second scenario, considering a 36.8% growth rate in the metaverse business, the fair value is $350.5, reflecting an 13% upside. Lastly, the third scenario, which assumes a 15.88% annual growth in social media advertising and a metaverse growth rate of 36.8%, yields a fair value of $468.7, indicating a 29.9% annual return.
I’ve set a target for Meta’s stock at $336.8, which implies the potential for an 8.6% increase. Nevertheless, given the array of risks, including Meta’s not being able to continue reducing its workforce and the uncertainty surrounding Reality Lab’s income projections, my recommendation for Meta is a “hold.”
Analyst’s Disclosure: I/we have no stock, option or similar derivative position in any of the companies mentioned, but may initiate a beneficial Long position through a purchase of the stock, or the purchase of call options or similar derivatives in META over the next 72 hours. I wrote this article myself, and it expresses my own opinions. I am not receiving compensation for it (other than from Seeking Alpha). I have no business relationship with any company whose stock is mentioned in this article.
Seeking Alpha’s Disclosure: Past performance is no guarantee of future results. No recommendation or advice is being given as to whether any investment is suitable for a particular investor. Any views or opinions expressed above may not reflect those of Seeking Alpha as a whole. Seeking Alpha is not a licensed securities dealer, broker or US investment adviser or investment bank. Our analysts are third party authors that include both professional investors and individual investors who may not be licensed or certified by any institute or regulatory body.

