Summary:
- MU’s double beat FQ1’25 performance has been temporarily negated by the lumpy FQ2’25 guidance, with it signaling mixed near-term prospects.
- Even so, we believe that the market has over-reacted, since NVDA’s Blackwell has only started to ramp up in production and peak shipments likely in Q2’25.
- MU continues to highlight its sold out position in 2025 as well, with robust 2026 prospects as HBM4’s ramp in high volume production then.
- This is why we believe that the stock’s sideways movement and the market’s over-reaction have a boon indeed, since it has triggered an even better margin of safety.
- Even so, it is undeniable that MU’s recovery is likely to be prolonged, pending normalized profit margins, healthier balance sheet, and clarity in the ongoing trade war.
numbeos/E+ via Getty Images
Micron’s Breakout Imminent – Ignore The Lumpy FQ2’25 Guidance
We previously covered Micron Technology (NASDAQ:MU) in September 2024, discussing its inherent undervaluation, with it triggering the prospects of promising recovery driven by the growing demand for AI-related memory products during the data center capex boom.
The management’s promising FQ1’25 guidance and the market’s long-term growth projections suggested its significant upside potential, aided by the extremely cheap PEG non-GAAP ratio of 0.18x – resulting in our Buy rating then.
MU YTD Stock Price

Trading View
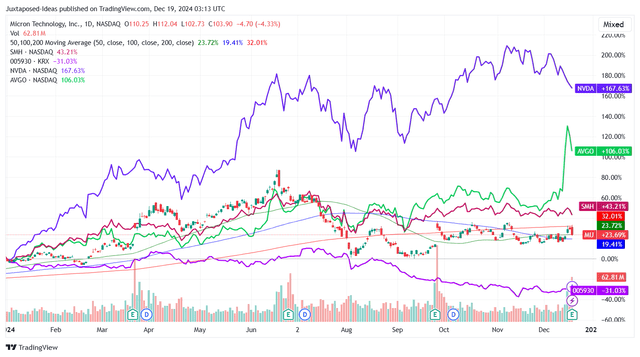
Since then, MU has mostly traded sideways at -2%, compared to the wider market at +2.5% while underperforming most of its semiconductor peers, aside from Samsung (OTCPK:SSNLF).
Heighted Market Volatility

CNN
Part of the headwinds are naturally attributed to the heightened market volatility, as the CBOE Volatility Index hits 27.62x (compared to 50 moving day averages of 17.08x/ the start of the year at 13.20x) and the market grows increasingly pessimistic as the McClellan Volume Summation Index turns negative at 875.92x (compared to Neutral levels of 1,000x).
The moderation is unsurprising indeed, since the S&P 500 (SP500) (NYSEARCA:SPY) has gained by +27.1% on a YTD basis and the VanEck Semiconductor ETF (SMH) by +42.9% prior to the recent pullback, as the market grows overly exuberant surrounding the generative AI boom.
Combined with the Fed’s hawkish tone in the recent FOMC meeting, we can understand why some may have opted to take their gains off the table, as the wider market likely enter a consolidation phase as opposed to the prior overbought levels.
At the same time, the ongoing trade war between the US and China seems to have worsened, as both parties intensify their export controls, with MU likely to suffer, since the “latest version of the US controls also would include some provisions around high-bandwidth memory chips.”
With China comprising 12.1% of the memory chip company’s FY2024 revenues (-1.9 points YoY), it is unsurprising that the market has turned cautious for now.
This is further worsened by MU’s underwhelming FQ2’25 guidance, with revenues of $7.9B (-9.1% QoQ/ +35.7% YoY), adj gross margins of 38.5% (-1 points QoQ/ +15.7 YoY/ -8.4 from FY2019 levels of 46.9%), and adj EPS of $1.43 (-20.1% QoQ/ +240.2% YoY).
Despite the double beat FQ1’25 performance, it is apparent that the company’s near-term performance is likely to be lumpy, despite the “HBM shipments were ahead of plan, and we achieved more than a sequential doubling of HBM revenue.”
We can understand why the market is expecting a better FQ2’25 guidance, given that MU has previously highlighted its “multi-billion dollar business opportunity for us in fiscal year 2025” through HBM.
On the other hand, readers must note that part of the headwinds may be attributed to the softer consumer demand, a situation that is projected to improve in 2025.
This development underscores why the management expects PC unit growth to “accelerate into the second half of calendar 2025, as the PC replacement cycle gathers momentum with the rollout of next-gen-AI PCs, end of support for Windows 10 and the launch of Windows 12.”
At the same time, readers must also note that Nvidia’s (NVDA) Blackwell has only started to ramp up in production, with 2025 likely to present an improved QoQ/ YoY comparison, as the team continues to highlight that “Blackwell demand is staggering and we are racing to scale supply to meet the incredible demand customers are placing on us.”
The same has been highlighted by a recent report by TrendForce, with Blackwell powered AI/ HPC servers only expected to “reach mass production and peak shipments during the second and third quarters of 2025.”
This is also why the MU management has guided a “return to growth in the second half of our fiscal year,” as they also increase their HBM market TAM estimates to over $30B in 2025, building upon its sold out position for calendar year 2025.
As a result of these promising developments, we believe that the market may have over reacted to the softer FQ2’25 guidance (ending February 2025), since the HBM “supply is tight. HBM continues to pressure non-HBM availability of supply.”
This development may also be why MU has intensified their FQ1’25 capex to $3.13B (+1.6% QoQ/ +80.9% YoY), with the aim of capturing significant growth opportunity during the ongoing data center capex boom.
The Consensus Forward Estimates

Seeking Alpha
If anything, despite the lumpy FQ2’25 guidance, the consensus forward estimates remain promising, with MU expected to generate a robust top/ bottom-line growth through FY2027, with it underscoring the end of its memory inventory correction – as similarly observed in the recovering gross profit margins.
MU Valuations

Seeking Alpha
At the same time, we believe that MU’s sideways movement and the market’s over-reaction have a boon indeed, since it has triggered an even better margin of safety.
The same has been observed in its cheap FWD P/E non-GAAP valuations of 12.40x and FWD PEG non-GAAP ratio of 0.24x, compared to the 5Y mean of 84.15x/ NA, 10Y mean of 12.29x/ NA, and the sector median of 25.94x/ 1.88x, respectively.
Even when compared to its memory peers, including Samsung (OTCPK:SSNLF) at FWD P/E non-GAAP valuations of 12.27x and SK Hynix at 5.61x, against their 5Y means of 15.44x/ 9.24x and 10Y means of 13.95x/ 8.83x, respectively, it is undeniable that the memory sector is extremely cheap at current levels, MU included.
Naturally, given MU’s still intense capex cycle and the minimal adj Free Cash Flow of $831M over the LTM (+119.5% sequentially), it is undeniable that MU’s balance sheet health at net debts of -$6.2B (-17.2% QoQ/ -39.3% YoY) remains a major concern.
This is worsened by the still mixed inventory levels of $8.7B (-1.9% QoQ/ +5.1%/ +70.2% from FY2019 levels), with it potentially contributing to the memory sector’s underperformance thus far, MU included.
Therefore, while we remain optimistic about its long-term prospects, it is undeniable that the stock’s recovery is likely to be prolonged, pending normalized profit margins, healthier balance sheet, and reversal in market sentiments.
So, Is MU Stock A Buy, Sell, or Hold?
MU 5Y Stock Price

Trading View
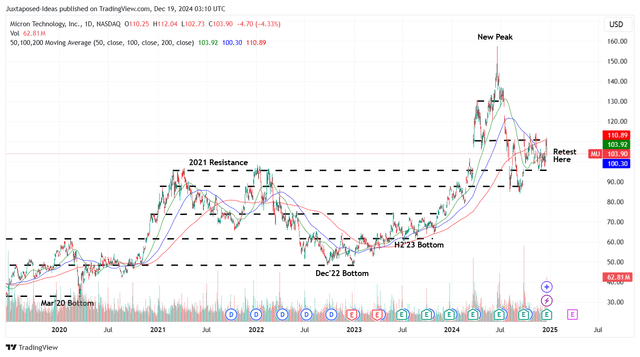
For now, MU remains well supported at current $100s levels, after the rather volatile YTD stock price performance.
It is apparent that the stock is now trading higher than our prior fair value estimate of $85.90 in our last article, based on the FQ1’25 annualized adj EPS guidance of $6.96 at the midpoint and the FWD P/E non-GAAP valuations of 12.34x (not too far from its 10Y P/E mean of 12.29x).
Even so, we believe that there remains an excellent upside potential of +29.7% to our long-term price target of $134.80, based on the consensus FY2027 adj EPS estimates of $10.93, thanks to the recent sideways movement.
If anything, MU is likely to continue reporting a robust performance in 2026, with NVDA already seeking to launch its next-gen AI accelerator in 2026, Rubin, allowing the former’s “HBM4 to ramp in high volume for the industry in calendar 2026,” thanks to the improved performance by over +50% from its HBM3E offerings.
As a result, we continue to rate the MU stock as a Buy here.
Do not miss the upcoming rally.
Analyst’s Disclosure: I/we have a beneficial long position in the shares of MU, NVDA either through stock ownership, options, or other derivatives. I wrote this article myself, and it expresses my own opinions. I am not receiving compensation for it (other than from Seeking Alpha). I have no business relationship with any company whose stock is mentioned in this article.
The analysis is provided exclusively for informational purposes and should not be considered professional investment advice. Before investing, please conduct personal in-depth research and utmost due diligence, as there are many risks associated with the trade, including capital loss.
Seeking Alpha’s Disclosure: Past performance is no guarantee of future results. No recommendation or advice is being given as to whether any investment is suitable for a particular investor. Any views or opinions expressed above may not reflect those of Seeking Alpha as a whole. Seeking Alpha is not a licensed securities dealer, broker or US investment adviser or investment bank. Our analysts are third party authors that include both professional investors and individual investors who may not be licensed or certified by any institute or regulatory body.
