Summary:
- Micron is one of the “big three” suppliers of DRAM technology along with Samsung and SK Hynix.
- The company is facing headwinds from the macroeconomic environment and a cyclical semiconductor industry.
- A positive is the stock is deeply undervalued according to my intrinsic valuation model.
- The technical chart shows areas of solid support and possibly a bullish rebound.
jiefeng jiang
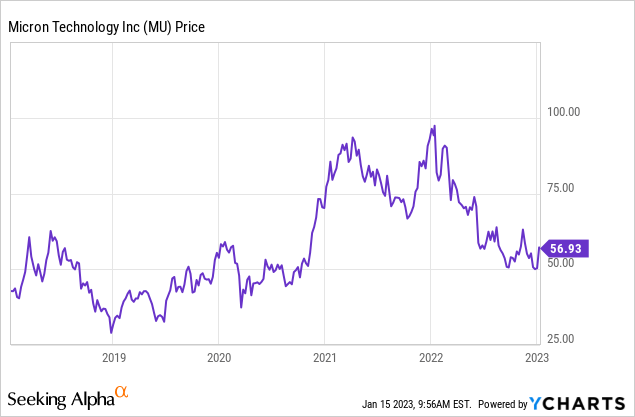
Micron (NASDAQ:MU) is a global semiconductor company that is one of the three major manufacturers of DRAM or Dynamic Random Access Memory. This is an essential part of all computers which include laptops, smartphones, and data center computing infrastructure. The essential need for semiconductors was highlighted in 2020, during the global “chip shortage”. However, since that point demand has waned as the industry is going through a cyclical downturn. Micron’s stock has now plummeted by over 39% from its all-time highs in January 2021. The stock is now deeply undervalued intrinsically, according to my model and the technical chart is starting to look tasty. In this post I’m going to break down the technicals of Micron, before revisiting my valuation model, let’s dive in.
Technical Analysis
Generally, when investing in a stock I analyze the fundamentals only such as its revenue, earnings etc. However, the technical charts can enable insight into “buying zones” where investors/traders have seen value historically. In this case, I have outlined various indicators below, don’t worry if the chart looks overwhelming I will walk you through each piece. Starting with the colored lines/boxes, this is a “Fibonacci retracement” indicator which helps to identify support lines. Triangulating this and my own analysis I have identified “Buy Point 1” at $49 per share and “Buy Point 2” at $44/share. The stock has previously moved sideways around the buy point 1 & 2 zones over the past few quarters. If the stock experiences some volatility again, it would likely hit these support zones at between $44-$49 per share. Thus, it would make sense to write down these numbers and potentially set up an alert or automated buying trigger, although this is not financial advice.
Micron Technicals (Created by author Deep Tech Insights)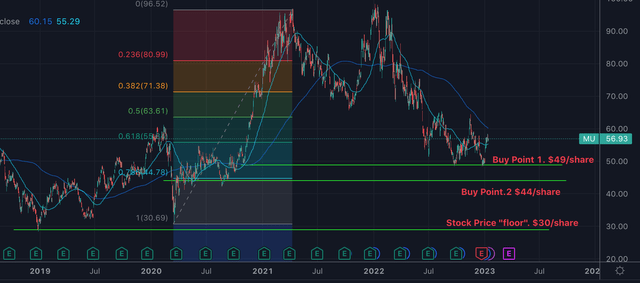
Still looking at the chart above I have outlined a stock price “floor” at ~$30/share. This is a solid support line as it outlines the market crash bottom of 2020, as well as the crash bottom of 2019. In my eyes, this would be a “worse case” scenario or “best case” if you are looking for a solid buying opportunity. On the chart below I have zoomed in on the chart and where it is trading currently. From this chart, you can see there is a textbook “double bottom” pattern at $48 per share. Therefore if the stock pulls back again, I would expect it to hit this level. In addition, the light blue line indicates a 50 day moving average, the stock price is pretty much on this average, which could also ask act as an additional support. Micron is still trading below its 200 day moving average (blue line) and thus it could easily rise higher due to the “reversion” to the mean phenomenon.
Chart 2. Zoomed Micron (Created by author Deep Tech Insights)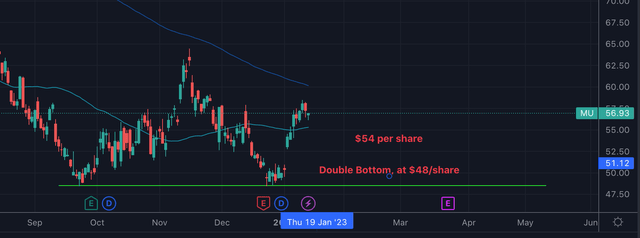
Chart 3 below shows weekly candlesticks. We can see Micron is currently showing a “falling wedge” pattern. If we combine this with the MACD indicator, this shows “higher lows” and thus indicates a “regular divergence”, especially as the RSI indicator is close to oversold. Overall, this is positive for a “bull”, as one would expect continued sideways movement or a sharp uptick.
Micron technical chart 3 (benedekdomotor)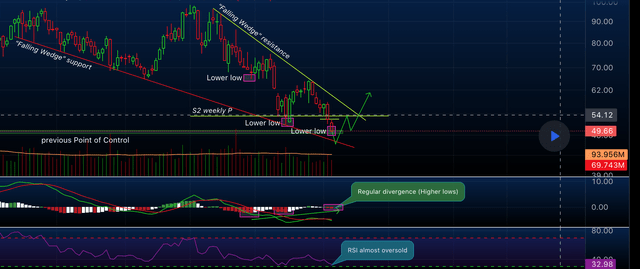
Although technical analysis is not an exact science it can offer useful indicators of historic buying activity. In addition, legendary investors such as the billionaire investor Stanley Druckenmiller, use both fundamental and technical charts, thus there must be some value. I tend to use both methods for my most followed stocks.
Financial Recap & Advanced Valuation
In my previous post on Micron, I have covered its business model and its latest financials in great detail, here is a quick recap. Micron reported pretty terrible financial results for what the company refers to as the “first quarter” of fiscal year 2023. Its revenue was $4.1 billion, which fell by an eye-watering 47% year over year. This may seem atrocious at first glance, but let’s zoom out and get some context. The semiconductor industry is cyclical by nature which means it fluctuates between excessive demand and excessive supply. In 2020, we saw supply chain constraints and booming demand, which resulted in booming revenue for Micron. But as mentioned in the introduction, we are now going through a cyclical downturn, which is really based upon a general correction and the “recessionary” environment.
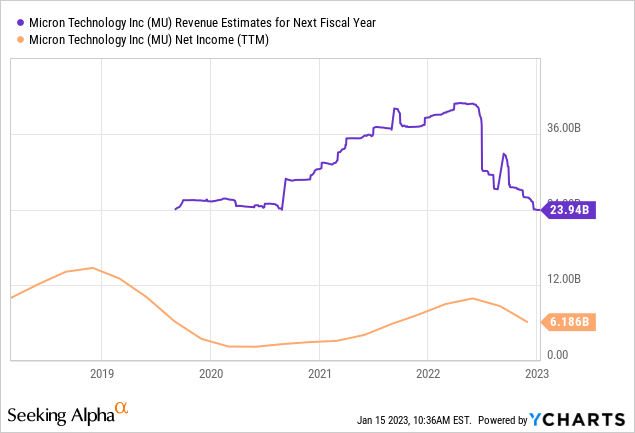
The positive for Micron is the long-term secular trend towards increasing semiconductor usage is strong. According to one study, the global semiconductor industry was valued at $527.88 billion in 2021 and is forecast to grow at a 12.2% compounded annual growth rate. This means by 2029 the industry is expected to be worth $1.38 trillion. McKinsey also backs up this forecast with a trillion-dollar industry expected.
As Micron derives 69% of its revenue from DRAM, it is forecasted to benefit from this secular growth trend which is driven by the increasing number of computers. This includes “IoT” or Internet of Things devices as well as automobiles which are basically a computer on wheels, with electric vehicles even more “computerized”. The remaining of Micron’s revenue is derived from NAND or flash memory applications, which is also a growing industry.
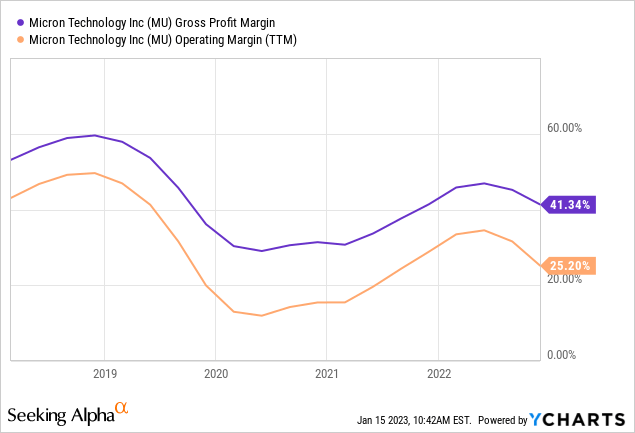
Moving onto profitability, Micron reported a solid 25% operating margin two quarters back. However, in Q1FY23, this operating margin plummeted to negative 2%, which resulted in a loss of $65 million. As mentioned prior, this was mainly driven by lower semiconductor demand, which subsequently meant Micron had to drop its prices to sell through its outstanding inventory. The good news is management has announced a series of swift actions to curb its expenses. This includes reducing its Wafer Fabrication Equipment expenses by 50% year over year. Another positive is the company ordered a solid share buyback of 8.6 million shares at a $49.57 per share average price. This equated to a total value of $425 million and thus it is fairly substantial.
Moving forward into next quarter (Q2,FY23), management is expecting shipments to increase sequentially for both DRAM and NAND which is a positive. In addition, it is expected a $120 million insurance benefit from a factory disruption back in 2017. Revenue is forecast to be $3.8 billion, which is still down 51% year over year. In order to value Micron, I have compiled its financial data into my discounted cash flow model. I have forecast a 31% decline in revenue for “next year”, which assumes lower semiconductor prices and volume. However, in years 2 to 5, I have forecast 11% revenue growth per year, as a semiconductor starts to grow with the industry, and economic conditions rebound/improve.
Micron stock valuation 1 (created by author Deep Tech Insights)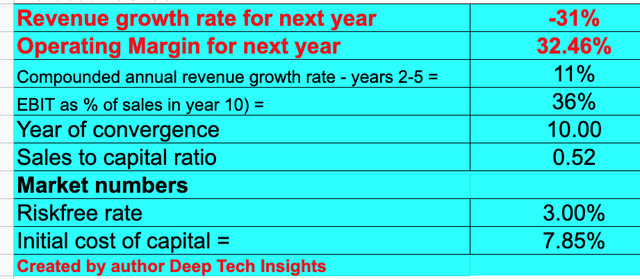
To increase the accuracy of my model, I have capitalized R&D expenses which has lifted net income. In addition, I have forecast a 36% operating margin over the next 10 years. I expect this to be driven by normalization in product pricing, driven by improving demand long term. In addition, Micron is expected to benefit from tax rebates and grants related to the $50 billion CHIPS act announced by the Biden Administration.
Micron stock valuation 2 (created by author Ben at Motivation 2 Invest)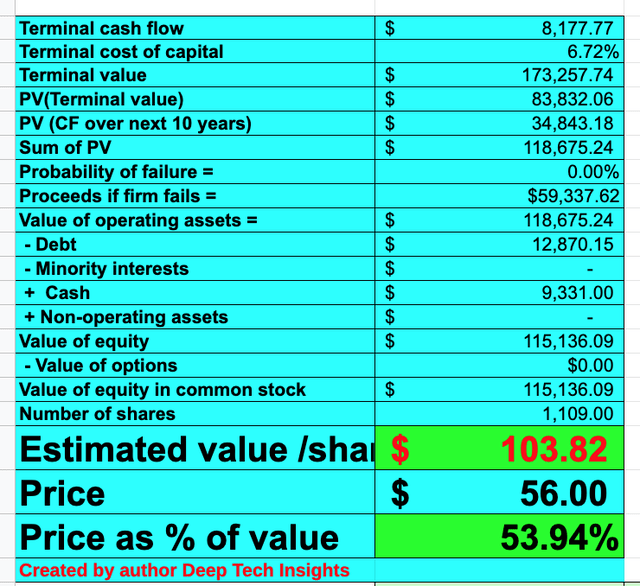
Given these factors I get a fair value of $104/share, its stock is currently trading at $56/share at the time of writing and thus it is over 46% undervalued or “deeply undervalued”.
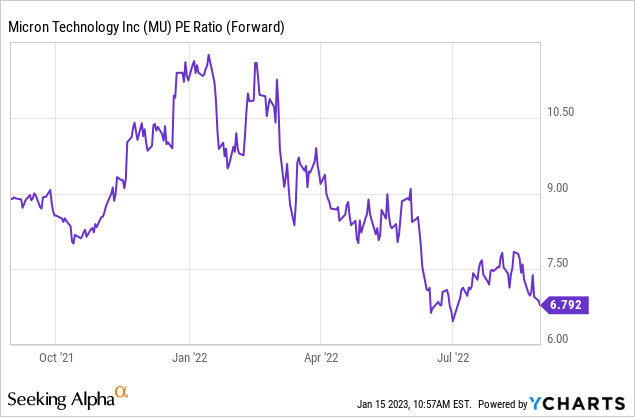
Micron also trades at a price-to-earnings ratio = 10, which is 24% cheaper than its 5-year average.
Risks
Recession/Cyclical Industry
Many analysts have forecast a recession in 2023. This means demand for Micron’s semiconductors is likely to be continually impacted. This can result in not just less revenue but also extra costs related to the “shutdown” and priming of manufacturing equipment. The positive is the semiconductor industry has been cyclical historically and the long-term trend is growth.
Final Thoughts
Micron is a technological powerhouse and one of the few companies which has mastered the art of DRAM manufacturing. Intel previously sold off its DRAM unit due to challenges and the industry has consolidated over time. Micron is currently facing headwinds from the macroeconomic environment. However, its stock is deeply undervalued intrinsically and the technical chart shows signs of bullish momentum. Therefore this stock could be a great long term investment.
Disclosure: I/we have a beneficial long position in the shares of MU either through stock ownership, options, or other derivatives. I wrote this article myself, and it expresses my own opinions. I am not receiving compensation for it (other than from Seeking Alpha). I have no business relationship with any company whose stock is mentioned in this article.
