Summary:
- Micron’s strong revenue growth in FY2024, driven by DRAM and NAND ASP improvements, leads to a revised gross margin forecast of 33.3%.
- Elevated inventory levels support volume growth, with management planning to use existing inventory for FY2025, ensuring continued shipment growth.
- Market pricing recovery for DRAM and NAND is expected to continue through 2024, with a slight decline in 2025, aligning with long-term forecasts.
JHVEPhoto
In our previous analysis of Micron Technology, Inc. (NASDAQ:MU), we highlighted the company’s strong revenue growth outlook for FY2024 driven by strong demand for HBM memory and improved market conditions. The company’s profitability exceeded expectations due to ASP improvements and reduced inventory write-downs, leading us to raise our gross margin forecast to 33.3% for FY2024 and 63.8% by FY2028, with net margins of 41.6%. Additionally, we forecasted the US CHIPS Act grant to boost cash flow margins to 32.64% in FY2024 and increase FCF margins by 4.24%.
We cover Micron again in this current analysis as the company’s Q3 YTD revenue growth is 54% YoY, which is in line with our expectations, but the analyst consensus for FY2025 growth is 50.4%, significantly higher than our forecast of 13.3%. Thus, we examine whether Micron can maintain its strong revenue growth performance into FY2025. First, we analyze the company’s performance to determine whether the Q3 FY2024 YTD is driven by pricing or volume. We look at the revenue breakdown for DRAM and NAND, focusing on average selling prices (ASP) and volume growth to identify which factor has a larger impact on revenue performance. Furthermore, we assess the likelihood of continued memory market pricing growth recovery into 2025. We update our forecast model for market supply based on capex projections, incorporating the latest management guidance and factoring in inventory levels to predict market pricing trends. Finally, we examine whether Micron’s volume growth can be supported by its existing inventories. We analyze the company’s inventory levels and inventory ratios to determine if the current inventory is sufficient to sustain volume growth.
ASP Growth Accelerating
Firstly, we analyze the company’s revenue performance and determine its revenue growth performance in Q3 FY2024 YTD to identify which factor has a larger impact on revenue performance in terms of pricing or volume.
We compile the company’s revenue breakdown for DRAM and NAND and calculate the growth breakdown by ASP and shipment volume growth based on its earnings briefings below.
|
Micron Revenue ($ bln) |
Q1 FY2024 |
Q2 FY2024 |
Q3 FY2024 |
Q3 FY2024 YTD |
Our FY2024 Forecast Growth % |
|
Unit Shipment Growth YoY |
75% |
56% |
35% |
54.1% |
-4.3% |
|
ASP Growth YoY |
-30% |
-1% |
31% |
-2.7% |
82.8% |
|
DRAM Revenue |
3.4 |
4.2 |
4.7 |
12.3 |
19.3 |
|
DRAM Growth YoY |
21.4% |
55.6% |
74.1% |
50.0% |
75.0% |
|
Unit Shipment Growth YoY |
15% |
4% |
2% |
8.7% |
-9.4% |
|
ASP Growth YoY |
-5.4% |
73.3% |
102.5% |
51.0% |
28.7% |
|
NAND Revenue |
1.2 |
1.6 |
2.1 |
4.9 |
4.9 |
|
NAND Growth YoY |
35.6% |
80.8% |
110.0% |
64.2% |
16.6% |
|
Total DRAM and NAND |
4.6 |
5.8 |
6.8 |
17.2 |
24.4 |
|
Growth YoY |
18% |
62% |
84% |
53.8% |
56.9% |
Source: Company Data, Khaveen Investments
Based on the table above, the company’s total DRAM and NAND revenue growth continued to accelerate in Q3 FY2024 at 84%, higher than its previous two-quarter growth. In Q3 YTD, its total revenue growth of 53.8% is in line with our FY2024 forecasts.
However, in terms of DRAM revenue, we see its growth was primarily driven by unit shipment growth at a calculated growth rate of 54.1% whereas ASP growth is flattish at -2.7%, which contrasts with our projections where we forecasted DRAM shipment growth to be flattish and ASP to grow by 83%, which we explained previously was due to the company’s drawdown of its existing inventories to support shipment growth while market pricing for DRAM gradually recovers. The pricing recovery is clearly starting to benefit Micron’s growth in Q3 FY2024, with a 31% growth rate YoY, accelerating from the previous quarters as Micron management highlighted “industry supply demand conditions continued to improve” as we had previously anticipated. Whereas in NAND, the company’s growth for Q3 YTD is ahead of our expectations with ASP growth accelerating strongly during Q3 by 103% YoY whereas unit shipment growth was flatter at only 2%, slowing compared to previous quarters.
Overall, the company’s revenue growth in Q3 YTD for DRAM has been primarily driven by unit shipment growth of 54%, but its ASP growth is seen accelerating rapidly over the past 3 quarters. In NAND, the company’s performance was primarily driven by ASP growth of 51% but unit shipment growth was positive at 9%. We previously expected in our past analyzes for the company’s revenue growth to be supported by pricing recovery in the DRAM and NAND markets as the top memory makers cut capex to balance the market demand-supply situation following the market downturn since 2022. The company’s latest Q3 FY2024 results affirm our expectations, as seen by the accelerating ASP growth for both DRAM (31%) and NAND (102.5%). Furthermore, we had also expected the company’s shipment growth to be moderate as the company reduces production with lower capex and previously identified the company drawing down its inventory stockpile to boost its shipment growth which had continued to remain strong in DRAM with a shipment growth of 35% YoY, making its Q3 YTD shipment growth of 54.1%. Whereas for NAND, its shipment growth slowed in Q3 FY2024 but remained positive, making its Q3 YTD shipment growth of 8.7% contrasting with our forecasts of -9%. Therefore, we revised our projections in FY2024 to account for the robust shipment growth in DRAM and NAND, based on its Q1 and Q2 CY2024 with prorated Q3 and Q4 CY2024 shipment growth for a full-year forecast of 22.8% and 5.5% respectively, to forecast a total revenue growth of 64.85% in FY2024.
Inventories Support Volume Growth
Next, we examine whether Micron’s volume growth can be supported by its existing inventories as it plans to cut capacity growth in 2025. This is because management indicated in its Q3 earnings briefing that Micron intends to utilize its “existing inventory to drive a portion of the bit growth supporting our revenue in fiscal 2025.”
We compile and analyze the company’s inventory levels and compare it as a percentage of revenue and inventory ratios (days inventory outstanding) to determine if the current inventory is sufficient to sustain volume growth.
|
Micron Inventory Ratios ($ mln) |
2014 |
2015 |
2016 |
2017 |
2018 |
2019 |
2020 |
2021 |
2022 |
2023 |
TTM (Q3 FY 2024) |
Average |
|
Inventory |
2,455 |
2,340 |
2,889 |
3,123 |
3,595 |
5,118 |
5,373 |
4,487 |
6,663 |
8,387 |
8,512 |
|
|
Growth % |
-4.7% |
23.5% |
8.1% |
15.1% |
42.4% |
5.0% |
-16.5% |
48.5% |
25.9% |
1.5% |
||
|
Revenue |
16,358 |
16,192 |
12,399 |
20,322 |
30,391 |
23,406 |
21,435 |
27,705 |
30,758 |
15,540 |
21,371 |
|
|
Inventory % of Revenue |
15.0% |
14.5% |
23.3% |
15.4% |
11.8% |
21.9% |
25.1% |
16.2% |
21.7% |
54.0% |
39.8% |
23.5% |
|
Inventory Days Outstanding |
51 |
105 |
138 |
137 |
158 |
218 |
207 |
162 |
207 |
296 |
243 |
175 |
Source: Company Data, Khaveen Investments
From FY 2023 to Q3 FY 2024, Micron’s inventories grew by 1.5%, which, we believe, is likely due to improving DRAM and NAND ASP leading to increased value for inventories. Micron uses First In First Out accounting to value its inventories, whereby the first good produced will be sold first, so the lower ASP inventories produced during 2022 and 2023 are likely being offloaded first while the higher-end ASP inventories are being added into the inventory mix, thereby increasing inventory values. This is in line with management on ASP improvements and declining inventory levels, as management highlighted that “Micron drove robust price increases as industry supply demand conditions continued to improve” and that “inventories are trending down, which we believe ours will trend down through fiscal ’25”. Previously, we highlighted that the company had a downward revaluation for inventory by $1.83 bln in FY2023, as we calculated its ASPs declined by a weighted average of 48%. Based on its Q3 YTD, we calculated its weighted average ASP growth of 11.1% and estimated an inventory upward adjustment of $0.42 bln due to higher ASPs. Therefore, we estimate its inventory level without the price adjustment would be $8.09 bln, which is a decline of 3.5%. Furthermore, the company’s inventory % of total revenue is 39.8%, which is still above the company’s historical average of 23.5%. Additionally, its day’s inventory outstanding is also much higher at 243 days compared with its average of 175 days, which we believe further indicates its inventories remain elevated.
Overall, we believe the company’s inventory levels remain elevated in Q3 FY2024 and the company could continue to draw down its inventory pile going into FY2025. Based on our pricing forecast, we estimated a weighted average price increase of 24.3% for the company and estimated its full-year inventory at $9.01 bln based on our full-year price adjustment impact of $0.92 bln. Furthermore, management also highlighted in its earnings briefing that the company aims to maintain its market share in terms of unit shipments for DRAM and NAND and that “shipments will come from inventory”. Therefore, we adjusted our projections for the company’s revenue growth taking into account shipment growth into FY2025, which we based on our projected demand growth for DRAM and NAND of 22.9% and 27.6% respectively as we assumed the company to meet its demand growth for DRAM and NAND with its inventories.
Market Pricing Outlook
Furthermore, in the next section, we assess whether there could be a continued memory market pricing growth recovery into 2025.
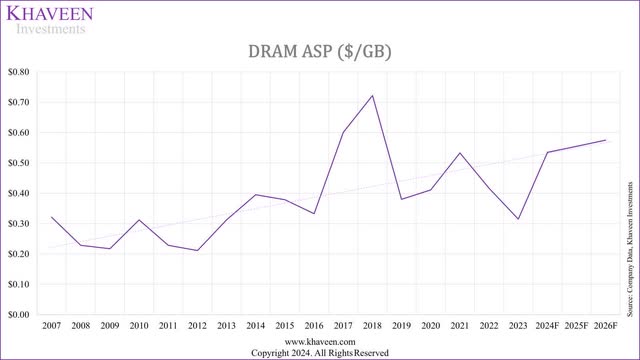
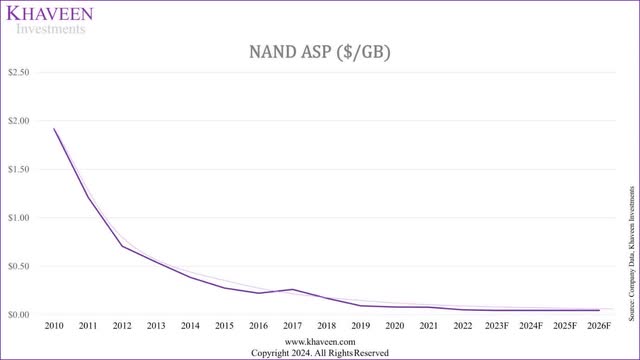
We update our forecast model for market supply based on capex projections, incorporating the latest management guidance and factoring in inventory levels to predict market pricing trends. In our previous analysis, we project the market pricing for DRAM and NAND based on the long-term trend in memory pricing, where we observe an upward trend for DRAM and a downward trend for NAND, as well as factoring in the difference between our demand and supply forecasts, where we project lower supply growth than demand growth, boosting ASPs.
|
Market Pricing Forecast |
2017 |
2018 |
2019 |
2020 |
2021 |
2022 |
2023 |
2024F |
2025F |
2026F |
|
DRAM ASP |
4.81 |
5.78 |
3.04 |
3.29 |
4.26 |
3.33 |
2.52 |
4.98 |
4.94 |
5.06 |
|
Change % |
80.8% |
20.2% |
-47.4% |
8.2% |
29.6% |
-21.9% |
-24.3% |
97.5% |
-0.8% |
2.5% |
|
NAND ASP |
0.26 |
0.17 |
0.09 |
0.08 |
0.077 |
0.050 |
0.044 |
0.051 |
0.048 |
0.046 |
|
Change % |
18% |
-35% |
-46% |
-14% |
-1.96% |
-36.0% |
-12.0% |
18.0% |
-6.6% |
-4.4% |
Source: Company Data, Khaveen Investments
Company Data, Khaveen Investments Company Data, Khaveen Investments

We update our projection for the market pricing trend based on management guidance for capex in 2023 to update market supply growth. Micron highlighted its capex guidance for 2024 at $8 bln, slightly higher compared to the midpoint of $7.75 bln previously. Furthermore, Micron’s management also guided an increase in terms of net capex in FY2025 to increase to “around mid-30%” of revenue in FY2025, which we estimate at around $12.8 bln after accounting for CHIPS Act incentives of $1.23 bln as determined in our previous analysis. Additionally, SK Hynix also plans to increase capex to an average of $14.9 bln over the next 5 years, 57% higher compared to our estimate in 2024. Based on our updated projections for market supply, we forecast a total of 6.6% for DRAM and 22.7% for NAND in 2025, which is still below our forecast market demand growth of 16% and 27.6%, but an improvement compared to 2024 supply growth. Therefore, we factored in a lower demand-supply difference compared to 2024 in DRAM (9.4% vs 15.7%) and NAND (4.9% vs 16%) impact on our long-term ASP projections, thus resulting in a flattish market ASP growth outlook of -1.9% for DRAM and a decline of 9.6% for NAND in CY2025.
|
Micron Revenue Projection ($ bln) (FY) |
2023 |
2024F |
2025F |
2026F |
|
DRAM |
11.02 |
19.03 |
24.32 |
25.80 |
|
Growth % |
-50.8% |
72.6% |
27.8% |
6.1% |
|
NAND |
4.20 |
6.33 |
6.45 |
6.58 |
|
Growth % |
-46.2% |
50.7% |
1.9% |
2.0% |
|
Others |
0.36 |
0.26 |
0.22 |
0.22 |
|
Growth % |
-14.9% |
-36.5% |
-27.8% |
-16.0% |
|
Total Revenue |
15.54 |
25.62 |
30.98 |
32.60 |
|
Total Growth % |
-49.48% |
64.85% |
20.95% |
5.21% |
Source: Company Data, Khaveen Investments
All in all, in terms of market pricing for DRAM and NAND, we expect the trend to be maintained for the memory market pricing to continue recovery throughout 2024 and reach our baseline long-term market forecasts at 96.4% and 16% for the full year of 2024 for DRAM and NAND respectively as the impact of the top memory makers management on the supply demand situation continues. We believe the ongoing recovery is reflected in Micron’s ASP growth for DRAM and NAND, which continued to accelerate in Q3 FY2024. Based on our projections, we see the market pricing for DRAM to be flattish at -1.9% in 2025 and NAND market pricing to decline by 9.6% as we expect the market to fully recover in 2024 based on our long-term trend line forecasts. In total, we expect the company’s total revenue to grow 65% in FY2024 and then 20.95% in FY2025, higher compared to the 13.30% growth forecast in our previous analysis due to the higher shipment growth forecasts for DRAM (22.9%) and NAND (27.6%) as we forecast the company’s demand growth to be fulfilled by its supply growth increase as well as from its continued drawdown of its inventories in line with management guidance.
Risk: Competition from SK Hynix and Samsung
We believe one of the risks for Micron is from its top competitors such as SK Hynix which has announced plans to expand production and increase capex to an average of $14.9 bln over the next 5 years, which we calculate is 57% higher compared to our estimate in 2024. Additionally, South Korea announced $19 bln in semicon subsidies according to TrendForce which could bode well for SK Hynix and Samsung (OTCPK:SSNLF).
Verdict
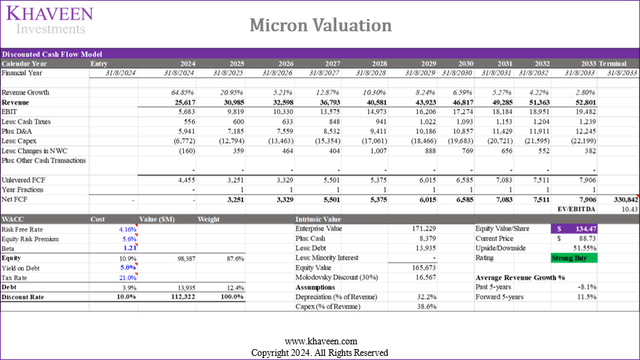
Based on our revised valuation, we derived an upside of 51.55% accounting for the higher growth projection in FY2025 of 20.95% compared to 13.3% previously as we anticipate the company to maintain its strong growth with increased supply growth and continued drawdown of its inventory stockpile.
All in all, we expect the DRAM and NAND market pricing recovery to continue throughout 2024, aligning with our forecasts of 97.5% for DRAM and 18% for NAND. As highlighted, we believe this recovery is driven by strategic actions of top memory manufacturers impacting supply and demand, evident in Micron’s accelerated ASP growth for DRAM and NAND in Q3 FY2024. Furthermore, we believe Micron’s inventory levels remain high in Q3 FY2024, and we anticipate continued drawdown into FY2025. We forecast a weighted average price increase of 10.6%, with full-year inventory at $8.5 bln and a price adjustment increase of $0.403 bln. We adjusted our revenue growth projections, expecting shipment growth to meet demand growth of 22.9% for DRAM and 27.6% for NAND into FY2025. In terms of pricing, we expect DRAM and NAND market pricing recovery to continue through 2024, reaching 96.4% and 16% respectively. We project DRAM pricing to be flat at -1.9% in 2025 and NAND pricing to decline by 9.6%, with full market recovery expected in 2024. In total, we forecast Micron’s revenue to grow by 65% in FY2024 and 21% in FY2025, higher than our previous analysis of 13.30%, due to increased shipment growth and inventory drawdown in line with management guidance. As Micron is scheduled to release its Q4 FY2024 earnings next week on 25th September, we will be looking out for management guidance for revenue growth expectations for FY2025 to further support the case for its continued growth momentum. Overall, we upgrade the company as a Strong Buy with a price target of $134.47, mainly due to the increase in our projected growth for FY2025 of 21% compared to 13% previously.
Analyst’s Disclosure: I/we have a beneficial long position in the shares of MU either through stock ownership, options, or other derivatives. I wrote this article myself, and it expresses my own opinions. I am not receiving compensation for it (other than from Seeking Alpha). I have no business relationship with any company whose stock is mentioned in this article.
No information in this publication is intended as investment, tax, accounting, or legal advice, or as an offer/solicitation to sell or buy. Material provided in this publication is for educational purposes only, and was prepared from sources and data believed to be reliable, but we do not guarantee its accuracy or completeness.
Seeking Alpha’s Disclosure: Past performance is no guarantee of future results. No recommendation or advice is being given as to whether any investment is suitable for a particular investor. Any views or opinions expressed above may not reflect those of Seeking Alpha as a whole. Seeking Alpha is not a licensed securities dealer, broker or US investment adviser or investment bank. Our analysts are third party authors that include both professional investors and individual investors who may not be licensed or certified by any institute or regulatory body.

