Summary:
- Micron is coming out of a tough period of oversupply-led inventory corrections. The business is facing brighter times ahead as industry demand is strong.
- The DRAM market outlook, which comprises the majority of Micron’s revenues, is healthy, but the company’s market share is under pressure.
- Micron has stable market share in the SSD and NAND Flash markets, which also have a healthy to flat demand outlook.
- Micron’s valuations relative to its memory semiconductor peers is expensive, especially after considering the tough competition. Relative technicals vs. the S&P500 also point bearish to neutral.
- NVIDIA’s Blackwell demand could be a key upside catalyst for Micron, as it has been a first mover to qualify for the required memory products.
Imgorthand/E+ via Getty Images
Thesis
I have a mixed outlook on Micron Technology (NASDAQ:MU):
- Micron benefits from industry tailwinds but may not outperform its peers overall
- Valuations are at a modest premium to peers
- Relative technicals indicate neutral to bearish signs
- NVIDIA’s Blackwell demand can be a key upside risk
Key Products Overview
Micron is a semiconductor company focused on memory and storage products. My analysis in this article will focus on on-demand themes in Micron’s key product segments. Hence, it is useful to get a basic understanding of each product category:
Dynamic Random Access Memory (DRAM)
This refers to memory that is stored temporarily when the device’s power is on. The technical term for this kind of temporary memory is ‘volatile’ memory. This memory retrieval is typically fast. For example, running browser applications on your computer uses DRAM memory.
NAND Flash (Non-Volatile Memory)
NAND Flash is a non-volatile memory, which means it stores data even when the device’s power is turned off. For example, data stored on your mobile phone’s SD card or USB stick would use NAND Flash memory.
Solid-State Drives (SSDs)
SSDs are storage devices that uses NAND Flash memory. They are a faster alternative to hard drives. For example, many modern laptops have SSDs installed, which lets them boot up a lot faster in seconds as opposed to minutes in older computer and laptop models.
High Bandwidth Memory (HBM)
This type of memory enables quick access to large amounts of data in a power-efficient way. It is designed for high-performance applications such as modern gaming applications and 3D rendering. For example, NVIDIA’s GeForce RTX 3090 graphics card uses HBM to rapidly process and render high-resolution graphics in real-time.
Micron benefits from industry tailwinds, but may not outperform its peers overall
Micron is coming out of a tough industry oversupply situation and is set to reap the rewards of industry tailwinds. However, its competitive positioning may not be improving:
DRAM demand outlook is strong but Micron is lagging
The global DRAM market grew an impressive 24.8% QoQ to hit $22.9 billion in revenues in Q2 CY24. This was driven by both increased shipments and higher average selling prices. These industry tailwinds are expected to continue since DRAM manufacturer’s Q3 CY24 contract price negotiations with PC OEMs and cloud service providers have exceeded expectations. For example, industry research from TrendForce has upped Q3’s price hike forecasts from +8% to 13%.
As a major DRAM market player, Micron is benefiting from these trends. However, it is not to the same extent as its peers (Samsung (OTCPK:SSNLF) and SK Hynix (OTCPK:HXSCF)) due to lower shipments volume. This is visible in the market share loss QoQ from 21.5% to 19.6%:
Global DRAM Industry Revenue Trends (TrendForce)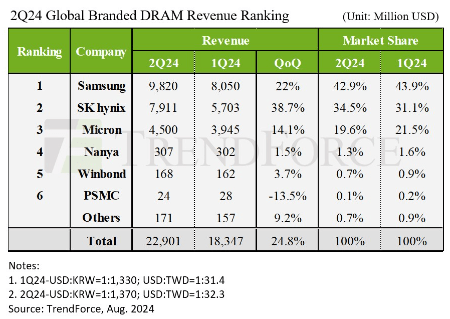
Based on this data, out of Micron’s total Q2 FY24 revenues of $6.8 billion, the implied DRAM revenue share is 66%. In other words, in its majority segment, Micron is benefiting from industry tailwinds but underperforming peers.
The implied DRAM revenue share of 66% here is not too different from the 69% revenue mix disclosed in Micron’s DRAM segmental breakup. The slight difference in the figures would be mainly due to timing differences (Micron’s fiscal year ends in August, hence Q2 ends in May rather than June).
NAND Flash demand outlook is flat, Micron’s share is stable
Q2 CY24 saw a slight decline to flattish volumes in the NAND Flash market due to higher customer inventory levels, particularly with PC and smartphone OEMs. However, average selling prices increased by 15% driven by strong demand from AI-related demand for high-capacity storage products. For the Q3 CY24 outlook, revenue growth is expected to moderate at 0-5% QoQ as volumes are expected to fall 5% with the balance 5-10% driven by pricing increases. Micron’s market share here is stable.
Global NAND Flash Industry Revenue Trends (TrendForce)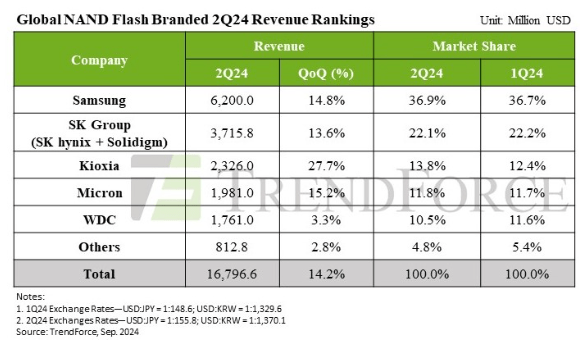
Based on this data, Micron’s NAND Flash revenues make up 29% of the overall revenue mix. So for a good chunk of Micron’s portfolio, the revenue outlook is flattish to a modest 5% increase.
The implied NAND Flash revenue share of 29% here is not too different from the 30% revenue mix disclosed in Micron’s NAND segmental breakup. The slight difference in the figures would be mainly due to timing differences (Micron’s fiscal year ends in August, hence Q2 ends in May rather than June).
SSD demand outlook is strong and Micron is gaining share
The SSD market is growing handsomely, driven equally by both volume and pricing growth. The key demand drivers are increased spends from North American cloud service providers (Amazon (AMZN), Microsoft (MSFT), Google (GOOGL) (GOOG)) for servers in data centers. The Q3 CY24 outlook is positive as these demand patterns are expected to lead to a 5% QoQ increase in volume. Pricing is a bigger tailwind, as it is expected to contribute another +15% QoQ driven by supply shortages. Micron is a modest beneficiary here as it has been gaining share QoQ from 9.9% to 13.6%:
Global Enterprise SSD Industry Revenue Trends (TrendForce)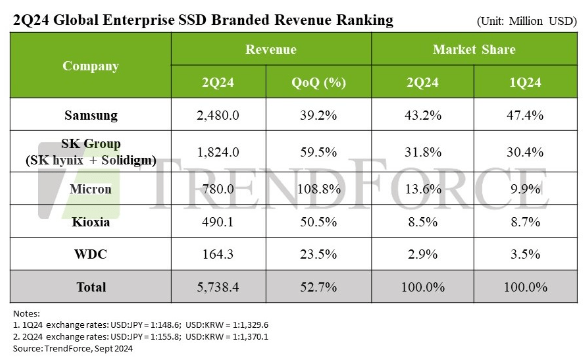
Based on this data, SSD revenues make up 11.5% of Micron’s overall revenue mix – a smaller portion relative to other key product categories.
Valuations are at a modest premium to peers
Micron’s key memory market peers include Samsung Electronics, SK Hynix, Western Digital Corporation (WDC) and Kioxia. Out of these, the former 3 are listed companies. Kioxia is expected to be a listed peer soon, as it has made an IPO application in the Japanese market.
P/B Comps (Capital IQ, Author’s Analysis)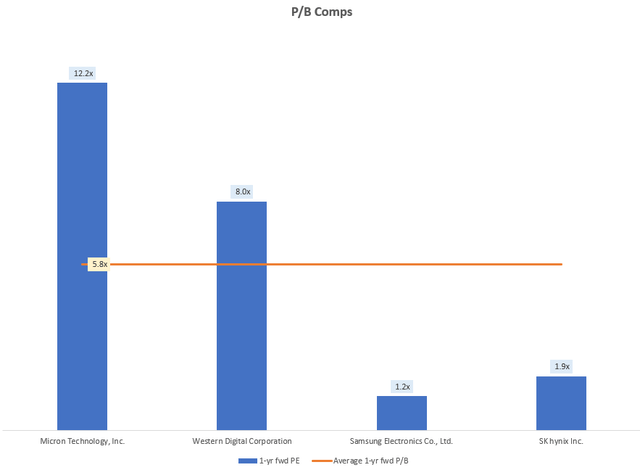
Relative to its relevant peers, Micron trades at a P/B of 12.2x; a 109% premium to the average of 5.8x. Given its lagging industry position in its major business segment, I deem this to be pricey on a relative basis.
I did not opt for the usual P/E multiples analysis, since Micron’s business earnings are not at a stable state yet. The past few years have seen negative earnings arising from negative margins even at the gross level as a result of massive oversupply in the memory market:
PAT (USD mn) (Company Filings, Author’s Analysis)
Gross Profit Margin (Company Filings, Author’s Analysis)
Relative technicals indicate neutral to bearish signs
If this is your first time reading a Hunting Alpha article using Technical Analysis, you may want to read this post, which explains how and why I read the charts the way I do. All my charts reflect total shareholder return as they are adjusted for dividends/distributions.
Relative Read of MU vs. SPX500
MU vs. SPX500 Technical Analysis (TradingView, Author’s Analysis)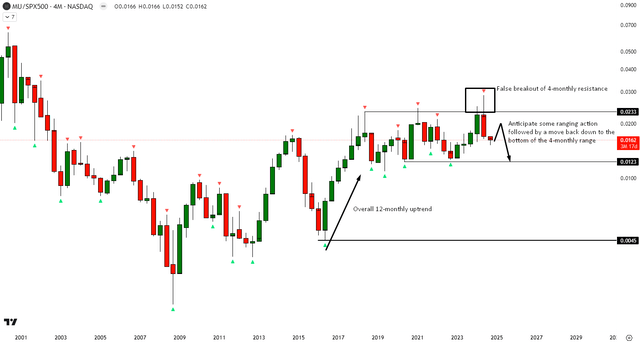
On the relative technical analysis of Micron vs. the S&P500 (SPY) (SPX), the ratio prices are in an overall 12-monthly uptrend, but are ranging sideways on the 4-monthly chart. Over the past 3 quarters, there has been a false breakout above a major 4-monthly resistance level, marking the top of the range. As a result, I anticipate some ranging action followed by a move back down toward the bottom of the 4-monthly range to gather fresh buyers to trigger a sustained move up and hence outperformance over the broad market index.
NVIDIA’s Blackwell demand can be a key upside catalyst
NVIDIA’s (NVDA) H200 is a graphics processing unit (GPU) specifically for generative AI and high-performance computing applications. This is the first GPU to use HBM3e, which is the latest generation of HBM. NVIDIA’s Blackwell chips, which I expect will roll out starting early CY25, will also utilize HBM3e. This can provide a demand and market share gain tailwind for Micron and SK Hynix, as they have been the first movers in qualifying for HBM3e.
Takeaway & Positioning
Micron’s financials have had a tough 2023 due to supply glut related inventory corrections. But that is mostly over now and the company is set to benefit from a demand rebound, particularly in DRAM, SSD and HBM3e products. However, relative to its major memory market peers, Micron’s competitive positioning may not be improving overall as Samsung and SK Hynix are taking away share in major segments. Moreover, Micron’s P/B trades at a hefty 109% premium to the average P/B of 5.8x, which I believe reduces the margin of safety for buys. Technically, relative to the S&P500, I lean bearish to neutral on Micron stock as it reacts off a false breakout of the 4-monthly resistance.
Rating: ‘Neutral/Hold’
How to interpret Hunting Alpha’s ratings:
Strong Buy: Expect the company to outperform the S&P500 on a total shareholder return basis, with higher than usual confidence. I also have a net long position in the security in my personal portfolio.
Buy: Expect the company to outperform the S&P500 on a total shareholder return basis
Neutral/hold: Expect the company to perform in-line with the S&P500 on a total shareholder return basis
Sell: Expect the company to underperform the S&P500 on a total shareholder return basis
Strong Sell: Expect the company to underperform the S&P500 on a total shareholder return basis, with higher than usual confidence
The typical time-horizon for my views is multiple quarters to more than a year. It is not set in stone. However, I will share updates on my changes in stance in a pinned comment to this article and may also publish a new article discussing the reasons for the change in view.
Editor’s Note: This article discusses one or more securities that do not trade on a major U.S. exchange. Please be aware of the risks associated with these stocks.
Analyst’s Disclosure: I/we have no stock, option or similar derivative position in any of the companies mentioned, and no plans to initiate any such positions within the next 72 hours. I wrote this article myself, and it expresses my own opinions. I am not receiving compensation for it (other than from Seeking Alpha). I have no business relationship with any company whose stock is mentioned in this article.
Seeking Alpha’s Disclosure: Past performance is no guarantee of future results. No recommendation or advice is being given as to whether any investment is suitable for a particular investor. Any views or opinions expressed above may not reflect those of Seeking Alpha as a whole. Seeking Alpha is not a licensed securities dealer, broker or US investment adviser or investment bank. Our analysts are third party authors that include both professional investors and individual investors who may not be licensed or certified by any institute or regulatory body.
