Summary:
- Micron Technology, Inc. is a high-quality cyclical business that has provided good returns for me during past cycles.
- The current Micron cycle has been similar to the one in 2018-19, and Micron stock is now trading near all-time highs.
- Micron has performed well, doubling the return of the S&P 500, and I have taken profits, completing a second successful Micron investment.
- I share why my process has worked well with Micron, and I share the results of the strategy with AMD and Nvidia stock as well to provide additional context.
DNY59
Introduction
Successfully investing in individual stocks and achieving alpha requires at least two important things, in the words of well-known investor Howard Marks, an investor must be both contrarian and correct. This means that a successful investing process can’t be the same as too many other market participants. The process needs to be unique. This is why over time I have developed my own investing strategies that are quite different than most other investors. However, it is not sufficient to have a unique strategy. The strategy must also be successful, and preferably be repeatable. Anyone who is a good storyteller can make up a story about how a particular stock or business will be successful in the future, but it’s ultimately the results, over time, that tell the true story. Results can provide evidence about whether an investing technique (particularly a contrarian one) has a high likelihood of being successful.
I have a contrarian approach to investing in deep cyclical stocks. This article will share some of the results of that approach so readers can see there is some evidence that this approach works. Then I will explain the strategy using Micron Technology, Inc. (NASDAQ:MU) as a recent individual example. After that, I will zoom out and look at the bigger strategic picture, examining the outcomes of two other semiconductor stocks I covered in 2022 around the same time, which had different outcomes: Advanced Micro Devices (AMD), and Nvidia (NVDA). Taking this approach should allow readers to see some evidence that the strategy can produce good results at the individual level, but also important considerations at the portfolio level. In this way, hopefully, I can provide a well-rounded explanation of both the benefits and the drawbacks of the deep cyclical strategy I’m presenting.
I have a long history of investing in Micron stock and sharing various stages of my cyclical investment strategy on Seeking Alpha. My first Micron article was published in 2018. I’ve written seven articles about my investments in Micron since then. The first four articles took readers through the entire researching, buying, holding, and selling process. In September 2018, I shared ahead of time the price I was aiming to potentially buy Micron stock in my article “Here’s The Price I’ll Start Buying Micron.” The following month, Micron fell to those levels and I bought the stock, which I shared in my article “I’m Buying Micron (Even If It’s Not Different This Time)” A little over a year later, I finished the Micron series with an article titled “Profiting From Micron’s Cycles: A Case Study” where I ultimately took profits on 12/31/2019 and shared my process along with the results.
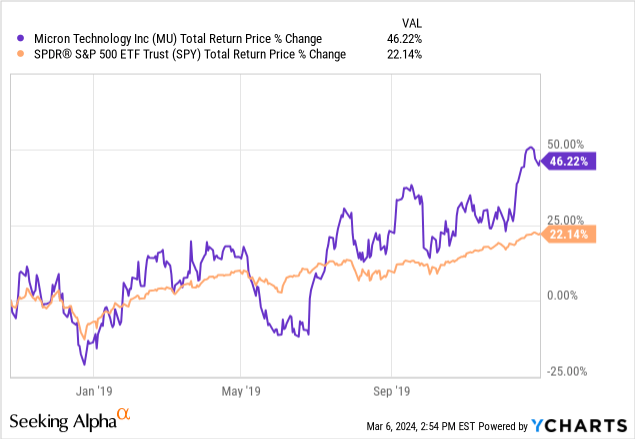
That was a fairly successful investment, with a return about double that of the S&P 500 (SP500). I took profits at that time because there were signs we were getting pretty late in the macrocycle and Micron was very close to making a new all-time high.
The current Micron cycle is similar in many ways to the one back in 2018-19. This time around, I also shared my buy price for Micron in advance of it falling to my buy price in my article “If Micron Hits This Price, I’ll Start Buying” published 9/6/22. It was only a matter of weeks after that, Micron hit my buy price and I wrote my Micron “buy” article “6 Lessons For Micron, AMD, And Nvidia Investors.”
The goal of my Micron strategy was to get about a 100% return within 5 years. Here is how it has performed so far over the past 1.5 years or so:
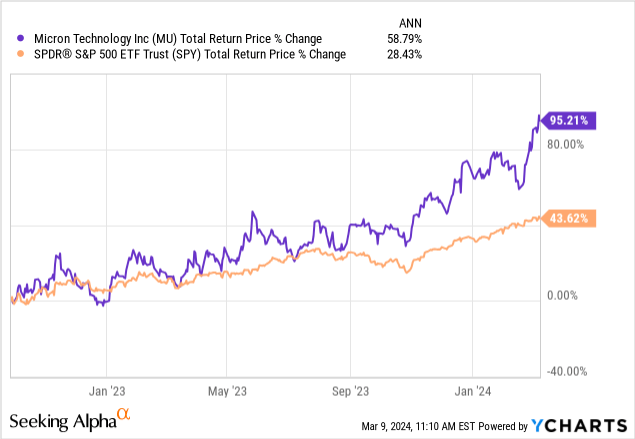
Once again, in less than a year-and-a-half we have more than doubled the return of the S&P 500, and now Micron is near an all-time high again. I have recently taken profits again, I will explain why a little later in the article.
It’s not uncommon for new readers of my analysis to be skeptical of my cyclical investing strategy because most investors take different approaches. This is why I always like to start my articles by reviewing any previous coverage I’ve had of a stock (good or bad). We now have had two successful cyclical Micron investments in which the entire process was shared with readers. For the remainder of this article, I am going to explain why I recently sold Micron, and how my Deep Cyclical strategy works for investors who might want to use it in the future.
Because Micron is a sample of only one, I will also include examples of other semiconductor stocks, Nvidia and Advanced Micro Devices as well, which I wrote about at the same time I was writing about Micron in 2022 to see how they turned out as well. My hope is this will provide a well-rounded view of the strategy and how it works using actual data rather than story-telling.
Micron: Identifying A Quality Deep Cyclical Business
Stock prices can fluctuate for a variety of reasons, but the key reason a cyclical stock drops -50% or more is because of significant changes to earnings. Sometimes earnings fall a lot because a business simply isn’t performing well, so a declining stock price and earnings alone are not sufficient to categorize a business as “cyclical.” The majority of businesses whose earnings growth declines significantly will never see earnings fully recover to their highs again. It’s important to avoid buying the stocks of these types of businesses.
Other times, however, big earnings fluctuations are simply a normal part of a particular business. While there are always a number of factors that can cause earnings to decline and then recover, usually the main reason is a business has fixed costs that are hard to adjust quickly, but demand from customers that fluctuates. This means that during the demand upcycles and good times, earnings can be fantastically great, but during demand downcycles earnings can be quite bad, even going completely negative.
The key thing with cyclicals is that downcycles end and upcycles eventually happen. This means that earnings fluctuations are normal for these businesses and are not a sign of overall business quality.
Just about all semiconductor stocks fall into this category, but, once again, the historical earnings data will tell the story. For the most part, investors don’t really need to understand all the ins and outs of the business. Usually, spending a lot of time studying a well-established business isn’t time well spent compared to examining and understanding the earnings history.
For example, here is Micron’s description of its business from its annual report:
We are an industry leader in innovative memory and storage solutions transforming how the world uses information to enrich life for all. With a relentless focus on our customers, technology leadership, and manufacturing and operational excellence, Micron delivers a rich portfolio of high-performance DRAM, NAND, and NOR memory and storage products through our Micron® and Crucial® brands. Every day, the innovations that our people create fuel the data economy, enabling advances in artificial intelligence and 5G applications that unleash opportunities — from the data center to the intelligent edge and across the client and mobile user experience.
We manufacture our products at wholly-owned facilities and also utilize subcontractors for certain manufacturing processes. Our global network of manufacturing centers of excellence not only allows us to benefit from scale while streamlining processes and operations, but it also brings together some of the world’s brightest talent to work on the most advanced memory technology. Centers of excellence bring expertise together in one location, providing an efficient support structure for end-to-end manufacturing, with quicker cycle times, in partnership with teams such as research and development (“R&D”), product engineering, human resources, procurement, and supply chain. For our locations in Singapore and Taiwan, this is also a combination of bringing fabrication and back-end manufacturing together. We make significant investments to develop proprietary product and process technology, which generally increases bit density per wafer and reduces per-bit manufacturing costs of each generation of product. We continue to introduce new generations of products that offer improved performance characteristics, including higher data transfer rates, advanced packaging solutions, lower power consumption, improved read/write reliability, and increased memory density.
We face intense competition in the semiconductor memory and storage markets and to remain competitive we must continuously develop and implement new products and technologies and decrease manufacturing costs in spite of ongoing inflationary cost pressures. Our success is largely dependent on obtaining returns on our R&D investments, efficient utilization of our manufacturing infrastructure, development and integration of advanced product and process technologies, market acceptance of our diversified portfolio of semiconductor-based memory and storage solutions, and efficient capital spending.
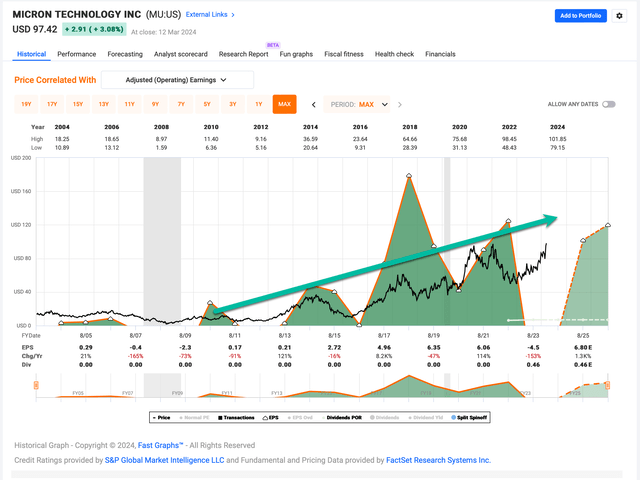
Other than learning they make memory chips, none of this is particularly useful information for investors compared to a graph of their earnings history. Below is a graphic I shared explaining this with Micron in my 2022 article, “If Micron Hits This Price, I’ll Start Buying.”
FAST Graphs (Annotations by Cory Cramer)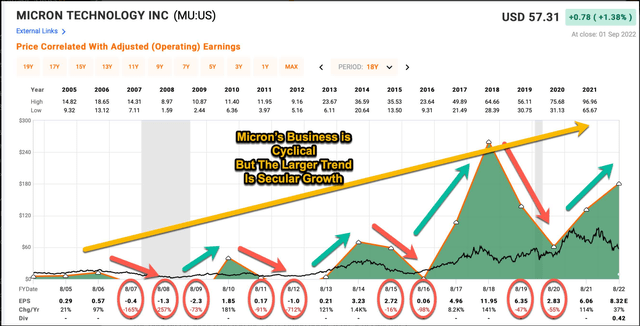
The earnings pattern above tells investors 80% of what they need to know about Micron’s business, and if Micron manufactured something different, I would treat it the same way. I’ve successfully used this strategy with companies that are industrial equipment manufacturers, banks, oil refiners, chemical producers, wholesale distributors, and more. The industry usually doesn’t matter. What is important is to ask 1) Is it a high-quality business? and 2) is it cyclical?
Importantly, this part of the analysis is a fundamental analysis based on historical earnings patterns. But, a problem arises because cyclical businesses do not lend themselves well to standard types of fundamental analysis due to the fact that earnings can fluctuate wildly. So, while investors need to look at the fundamentals to correctly categorize the stock, they then need to switch to a different type of analysis once the cyclical determination has been made. My experience has been relatively few investors both understand the nature of cyclical businesses and also have developed suitable strategies to successfully invest in them. Often, investors who are really attached to some kind of standard of fundamental valuation analysis will avoid cyclicals because they know they don’t fit well with that type of analysis.
Why business quality is important.
Usually, when a business’s earnings rise and fall a lot, the stock price does as well. This can create opportunities for investors who understand that these cycles are normal for some businesses. However, earnings cyclicality also carries with it additional risks. If earnings and cash flows are negative for too long, go too low, or take too long to recover, it can produce very big losses for investors, and sometimes those losses can be permanent. So, there is more risk that comes with investing in cyclical businesses (even if, as I have shown with Micron, the rewards can be great as well). This means there is a tremendous benefit from being able to identify high-quality cyclical businesses. While the rewards can sometimes be even greater for lower-quality cyclical businesses if an investor manages to buy near the bottom of a downcycle and the business ultimately recovers, the risk of a 100% loss also rises substantially with lower-quality cyclicals. Whereas with higher quality cyclicals, the risk of a big and permanent loss is much lower, creating a better risk/reward situation for investors.
A business’s earnings history is the best guide to its future. If a business generally has a history of higher earnings peaks and higher earnings troughs, it has shown strong potential to be of sufficient quality. I have found that businesses with good long-term histories are the best high-quality cyclical stocks to buy during down cycles. If you examine Micron’s earnings history in the above graph, you can see the big picture is one of a growing, high-quality, yet cyclical business. Once we have determined this, we can now switch to a different form of analysis that doesn’t rely on Micron’s unreliable earnings.
We can see that the overall trend of Micron’s earnings over the past 20 years has been higher average peaks. They also had a long run of higher average troughs until the recent post-COVID bust, which has sent earnings into a particularly bad downcycle. While Micron’s memory chips are not currently in as much of a secular growth trend as the products of AMD and Nvidia, (because memory tends to be more commoditized) there still is an increasing demand for memory as well. One of the big benefits of a deeply cyclical business in a secular growth industry is that the probability of a full earnings recovery is very high.
Now that Micron’s historical quality and cyclicality have been established, let’s move on to the buying and selling techniques.
Determining When To Sell A Stock Like MU
Unlike other types of stock investing, I’ve found that with cyclicals it’s actually best to have a general idea of where one expects to sell the stock before buying the stock, so I’m going to discuss selling before buying.
Deciding when to sell a cyclical is difficult for most investors, but since I have been specializing in deep cyclical stocks for nearly a decade now, determining when to sell is often one of the easier parts of the process. The key is to understand that it’s essentially impossible to sell at the exact top. So, I don’t really care if I sell and the stock keeps going higher. Mostly, what I care about is that I get close to the return I was aiming for when I bought the stock. I know that at some point in the future, the stock price will fall deeply again and that the timing of when that will occur is essentially unknowable because usually a cyclical stock will roll over and start going down before the fundamentals turn down. This makes near-term earnings data from things like quarterly earnings reports mostly useless, and potentially counterproductive if an investor wishes to consistently make money investing in cyclicals.
Successful cyclical investing requires anticipating the overall dynamics of the cycle, precision isn’t necessary because when executed well, the gains are quite large. This is what makes investing in cyclicals difficult for most investors. You have to have a clear understanding of what it is you know and also what it is you don’t know, and your strategy needs to match that understanding.
While I don’t know when a cyclical will turn down, I do know what the market was willing to pay during previous cyclical peaks, so it’s reasonable to assume that if the current cycle is similar to past cycles, the stock stands a chance to trade at least up to a similar price again. I try to buy at a low enough price so that if the stock recovers old highs within 5 years, I will be happy with my return. The most common outcome is buying when the stock is -50% off its high price so that when it makes a new high I will have an approximate 100% return. Even if it takes 5 years to recover, the returns can still be very good, and I am happy, no matter how much higher the stock price might go once I get my desired profit. This is exactly what I did with Micron stock (and many others over the years).
Around the edges, there are always additional factors to consider, like what the larger macro situation looks like, what one’s wider portfolio looks like, and any changes that make the current cycle a little different than the previous ones. We see this with the current sale of Micron. The stock recovered extremely quickly, in less than 1.5 years, producing a 58% annualized return compared to a roughly 15% annualized return if the recovery had taken the full 5 years. And while it’s not uncommon for a cyclical stock to recover before fundamentals improve, Micron has probably gotten ahead of itself given the speed of the stock price’s recovery, and it could sell off quite a lot with just a small shift in sentiment. I don’t think the time and price of potential change is possible to know short term, the danger is possible to know.
That said, an investor doesn’t have to be extremely rigid. I sometimes make small adjustments to try to capture additional upside. AMD is a recent example of this. In the fall of 2022, around the same time I was sharing my investment approach with Micron, I also wrote articles sharing the same approach with Advanced Micro Devices and Nvidia. Here are a couple of graphics from the AMD article “Here’s The Price I’ll Start Buying AMD Stock“:
FAST Graphs (Annotations: Cory Cramer)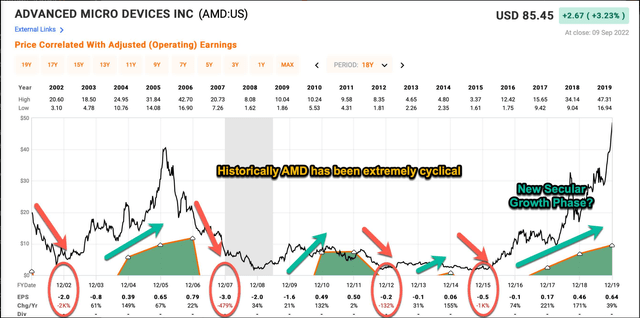
In the graph above, I show AMD’s historical cyclicality. Through 2019, AMD had an adequate earnings history to be categorized as a decent quality cyclical, but it didn’t have the same level of secular growth as Micron over this time frame.
FAST Graphs (Annotations: Cory Cramer)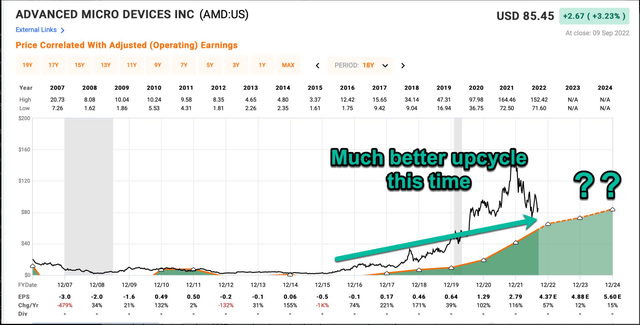
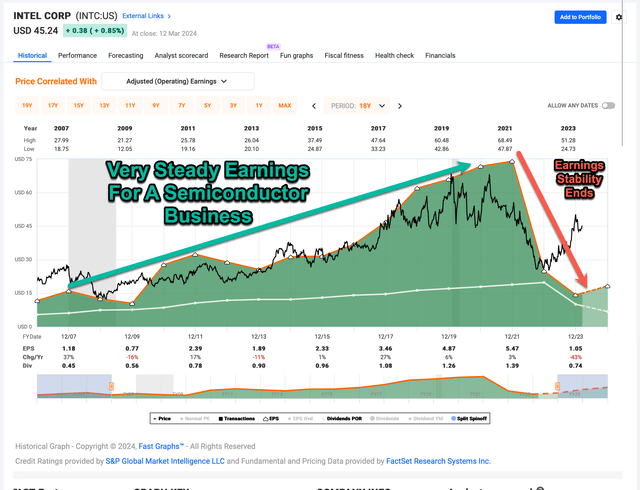
In the more recent graph above, however, we can see the signs of a steadier and more consistent earnings trend for AMD. This is because AMD was gathering up a lot of new business, much of it likely coming from Intel (INTC).
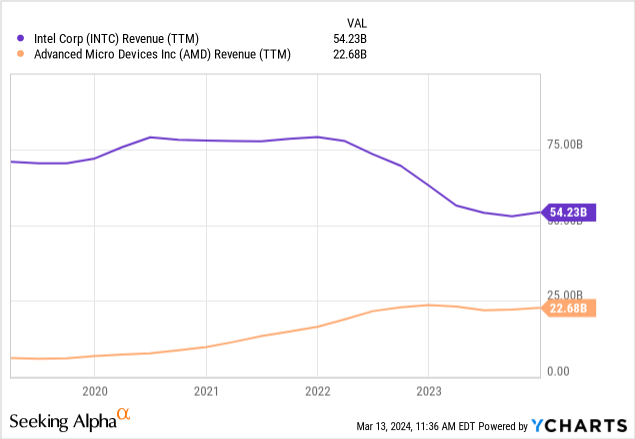
Over the past 5 years, we can see Intel’s revenues falling as AMD’s rise. This is important when we think about AMD’s potential future cyclicality because Intel had experienced a long run of steadier, less-cyclical earnings growth.
My take is that AMD has been taking Intel’s business and is therefore likely to be less cyclical than in the past, and will likely have more secular growth as well. So, even though history is a good general guide for business and market dynamics, it can sometimes be a good idea to weigh recent history more heavily, particularly in the fast-changing world of technology. It was because of this strong secular growth that after I bought AMD stock in the fall of 2022, and it then went on to double (just like MU), I decided to only sell half of my AMD position and hold the other half longer term (not something I typically do with a cyclical stock). Here is how AMD has performed since my “buy” article on October 25th, 2022:
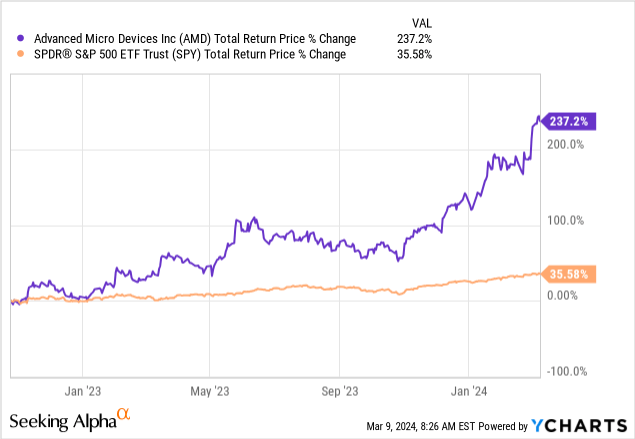
There are cases when it can make sense to hold on to a cyclical stock once it has reached new highs and goes into uncharted territory. So, we don’t have to be extremely rigid if a legitimate case can be made not to fully take profits after our return goals are met. That said, with Micron, I don’t really see much of a case anything is different this time around other than the speed of the recovery.
There some are additional options for investors after a recovery has occurred. Sometimes I will place a trailing stop around 10% to 15% on the stock price to try to capture some additional upside in case there happens to be a blow-off top, but it’s really just luck whether something like that occurs or not. And, while I usually sell my entire position with cyclicals, if there is a case to be made for strong underlying secular growth as well, an investor can sell half, treating that part of the investment as cyclical, and hold half, treating that part as secular growth. This is what I did with AMD stock this cycle. So, there are other options for investors in terms of an exit strategy, but with most cyclicals, exiting after one’s goals are achieved, and having that strategy mostly in place ahead of time will be greatly beneficial.
You never want to have FOMO with a cyclical stock, and getting greedy rarely pays.
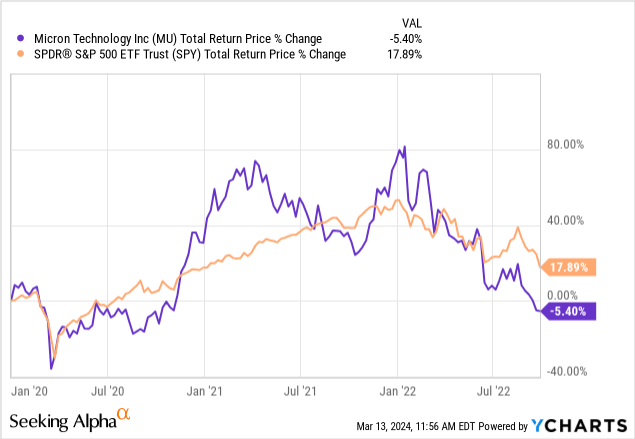
The above chart is what MU stock did after I took profits the first time at the end of 2019 until I bought it again in the fall of 2022. After the price fell initially quite deeply in March 2020, it rose 80% higher, but cyclicals don’t tend to stay high, and eventually, I was able to buy the stock cheaper than when I sold it.
How To Determine When To Buy
Perhaps the most difficult part of investing in cyclicals once a person has a good understanding of what they are doing is determining what price to start buying the stock. I placed the “Determining When To Sell” segment of this article before the “Buy” segment because I have found it’s best to know the conditions one would sell a cyclical first, and then use that information, along with the historical cyclicality of the stock price, to figure out when one is willing to buy a stock.
The benefit of this strategy is that one can work out the basic risk/reward relatively easily, and only use additional judgment around the edges. If one uses too much undisciplined judgment with cyclicals, they will almost certainly do exactly the opposite of what they should be doing, or they will get lucky with one cyclical purchase but not be able to repeat that success over and over again throughout time.
Once I have determined the business is a high-quality cyclical, there are only two or three factors I use to guide my buy price determination. The first is how deeply off its highs a stock has fallen in the past during a typical downcycle. This serves as a guide for what the stock price might do in the future, and it gives me an idea of how low I might be able to buy the stock. The second factor is how long might it take for the stock price to recover. The combination of those two factors can allow an investor to work out a good risk/reward analysis that they are comfortable with.
A final factor is the success rate one can expect. I typically get positive returns more than 80% of the time with this strategy, with the average annualized return around 30% or so. These are both far higher than what typical investors try for (or perhaps think is even possible), but I have found that these metrics are very comfortable and achievable for me with this strategy. I don’t like losing money, but I do like getting double the average returns of the wider market. There are some drawbacks, however.
The biggest drawbacks are there is usually a lot of volatility associated with these types of stocks, and occasionally, there can be very big losses (think -80% to -90%) so I prefer to keep my initial position sizes relatively small, in the 1%-2% range. Another drawback is the universe of high-quality cyclicals is fairly small. There are only about 100 or so of these stocks that pass my quality tests, and they tend to be concentrated in a relatively small number of industries. And finally, they often (but not always) tend to have downcycles at similar times. This can create very lumpy times of opportunity, where a few years can go by without much to do, followed by a flurry of opportunities. Some of those down cycles can happen at the same time as wider macro down cycles, and deep cyclicals have to compete with other investments that might be trading at good valuations as well. This creates a situation where my deep cyclical strategy works best as a small part of a bigger All-Weather Growth portfolio strategy that I use in my Investing Group. Additional sub-strategies are often less cyclical and require less trading and when used in combination with a cyclical strategy we get the best of both worlds where the big medium-term returns of cyclicals add to the portfolio, but the overall portfolio isn’t super lumpy in terms of opportunities or overall volatility.
With an understanding of how this strategy fits into the big picture, we can look at the historical return scenarios and use those to help guide a buy price we feel will meet our goals with a cyclical stock. You can read all this in my previous Micron articles, but below is an example of my process when it came to Nvidia stock in the fall of 2022 which I covered at the same time as Micron and AMD. I’m going to share it so we have more than a single example of what can happen. First, I looked at Nvidia’s historical drawdowns and recovery times.
As we can see in the historical drawdown chart above, NVIDIA stock has historically been subject to some very deep price drawdowns. During “normal” recessions, the stock price has fallen deeper than -75% off its highs every time. Below I have put these drawdowns in table form so we can get a clearer picture. I have excluded the drawdown that immediately occurred after their IPO in 1999 since it’s pretty normal for an IPO to fall more than -75% off its highs.
~Year ~Time Until Bottom ~Duration ~Depth 2001 15 months 5 years -90% 2007 12 months 7.25 years -85% 2018 3 months 2 years -56% 2020 1 month 3 months -37% 2021 9 months (so far) ? -60%+?
These are the data that helped me decide what price I might be able to get during a downturn. They are used as a guide, with a little bit of judgment layered on top. I see two important (and conflicting) trends here. First, there had been a series of shallower drawdowns for 20 years of Nvidia’s downcycles, which implies some underlying secular growth.
Second, we have a boom/bust situation (as with Micron and AMD) from COVID and stimulus money that implied a deeper-than-normal drawdown in 2022. Secular growth makes it more difficult to buy at previous historical low drawdowns, while a big boom/bust makes a deep drawdown more likely. I typically try to play it relatively safe because I track a lot of stocks and usually at least a few of them will give me some good opportunities even if I don’t know which ones they will be, so I aimed for a pretty deep drawdown with Nvidia of -70% off its highs.
After I pick a drawdown point, I backtest the types of returns I would have gotten in the past if I had bought the stock at that level. Below is the process I shared with Nvidia:
For this backtest, I will be using both the 2001 and the 2007 downcycles and I will be testing what sort of returns an investor would have achieved if they bought the stock after a -70% drawdown and also a -85% drawdown, both of which would have hit during these recessions. I will assume the stock was held until it recovered its previous high (which is usually when I take profits in deep cyclical stocks). I will then annualize that return and compare it to the S&P 500 if bought and sold on the same dates, annualized simple return. The goal is to see if historically this would be an alpha-producing strategy, so the last column is the alpha produced by the investment annualized relative to the S&P 500. If you buy after a -70% decline and sell when the stock price recovers its high, you will produce about a 230% return, so that will be the basic return in the table below.
Year the Decline Started Date of Purchase Date of Sale ~Months Held ~Annualized Simple Return ~Annualized S&P 500 Return ~Alpha to S&P 500 Annualized 2002 6/25/02 2/17/06 44 62.73% 32.39% 30.34% 2007 7/9/08 5/13/16 94 29.36% 7.99% 21.37%
We can see that buying after a -70% decline off the highs would have produced both good absolute and relative returns. It’s worth noting that investors would have had to be very patient, though, with the 2007 decline taking over seven years to recover its old highs. Typically, I don’t buy cyclical stocks if historically it has taken over five years for the stock to recover its old highs unless the returns are very good. In NVIDIA’s case, they still managed almost 30% simple annualized returns so it still works out, but it helps bolster the case that it’s worth aiming for very low buy prices when the recovery times can be expected to be very long. Additionally, an investor would have had to still be able to sit through a big drawdown if they bought after a -70% decline.
I used all this to guide my investing process, and I shared my buy prices at the end of the article.
Putting all this together, my first buy price for NVIDIA is about -25% lower from today’s price at $103.94, and my second, deeper buy price, is $51.97. Importantly, these are not what many refer to as “price targets”, which imply that I’m predicting with some high level of confidence and probability the stock will hit these prices. What I am saying is these are the prices at which I will be a buyer if they hit. The shallower buy price I do think has a greater than 50% chance of hitting, and the lower one, perhaps closer to a 10-15% chance of hitting.
So, I had two potential buy prices in mind, one at $103.94, which I thought had a 50% chance of hitting, and a lower one that had a smaller chance of hitting. Nvidia would later end up bottoming intraday at $108.14, just slightly above my buy price so I would not end up buying the stock.
I tend to encounter two main errors in thinking among investors when it comes to stock strategy. The biggest error is essentially a misunderstanding of luck and knowing what is predictable and not predictable. While luck is nearly impossible to quantify, as the sample size of a strategy grows, especially across multiple cycles and industries, we can gain more confidence that luck was less of a factor in the outcomes. We need to use a combination of sample size, logical reasoning, and probabilities to approximate the overall success of a strategy. For my deep cyclical strategy, in general, I’ve completed about 50 investments over the past 8 years, and there are another 50-100 that I came close to hitting my buy price, but missed, like Nvidia, where I can examine the outcomes as well. This is a decent sample size to gain some actual insights into the repeatability of the strategy, or whether luck might have been the primary factor. Examining one single data point cannot provide the same type of feedback.
So, for example, an investor needs to be careful about judging a strategy just from my missed Nvidia purchase. If something has a 50% chance of occurring and gets within 5% of the price I was aiming for, but doesn’t hit, while two similar stocks, MU and AMD did hit and were very successful, that’s actually a very good outcome overall and in-line with the expectations. The fact that AI enthusiasm has pushed Nvidia stock into the stratosphere is irrelevant because nobody knew in the fall of 2022 they would see the demand for their products that they’ve seen. Even the companies currently buying Nvidia’s products didn’t know or they would have bought them earlier. On the flip side, I have to admit that part of the incredible return of AMD stock, which I do own, was due to luck as well. I don’t feel like I did anything smarter to capture those extra gains any more than what I did that was dumb to miss Nvidia’s gains (other than not selling my entire AMD position after it doubled, and only selling half).
Getting a glimpse of this bigger picture is extremely important for investors to have a full understanding of a strategy, which is why I took the time to share it in this article instead of just celebrating the success of the Micron investment.
Conclusion
Typical investing techniques don’t work well with cyclical businesses like Micron. Investors who wish to have repeated success, especially with cyclicals, have to be contrarians to get above-average returns. My first purpose in sharing this article was to let my regular readers know that I have sold my Micron position. I have also shared why my approach with Micron was different than it was with AMD. And finally, I shared a great deal about the techniques and thought process that goes into developing and implementing a good, repeatable, cyclical investing strategy. I hope that readers have found it useful.
It’s important to acknowledge that nobody knows how high these stocks will rise, which is especially difficult to estimate due to their underlying secular growth prospects, but they will always have cyclical aspects to their businesses even if their secular growth continues. I sold my entire Micron position, while only selling half of my AMD position after they had each doubled. If I had managed to buy Nvidia, I likely would have sold half by now as well. While there is no perfect way to “call a top” with these stocks, investors should understand that the downside risk when cyclical stocks are making new highs is always quite large.
Analyst’s Disclosure: I/we have a beneficial long position in the shares of AMD either through stock ownership, options, or other derivatives. I wrote this article myself, and it expresses my own opinions. I am not receiving compensation for it (other than from Seeking Alpha). I have no business relationship with any company whose stock is mentioned in this article.
Seeking Alpha’s Disclosure: Past performance is no guarantee of future results. No recommendation or advice is being given as to whether any investment is suitable for a particular investor. Any views or opinions expressed above may not reflect those of Seeking Alpha as a whole. Seeking Alpha is not a licensed securities dealer, broker or US investment adviser or investment bank. Our analysts are third party authors that include both professional investors and individual investors who may not be licensed or certified by any institute or regulatory body.
If you have found my strategies interesting, useful, or profitable, consider supporting my continued research by joining the Cyclical Investor’s Club. It’s only $40/month, and it’s where I share my latest research and exclusive small-and-midcap ideas. Two-week trials are free.

