Summary:
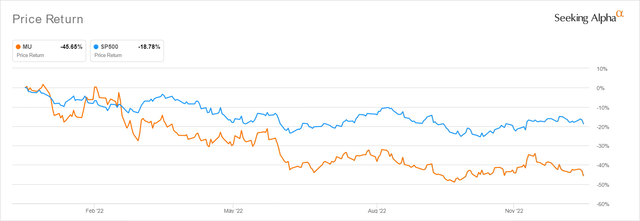
- MU continues to be one of our core holdings, with an impressive 10Y total price return of 665.7%, despite the catastrophic -46.54% plunge from January 2022 high.
- The stock trades at a notable discount to the consensus price target, indicating Mr. Market’s elevated pessimism levels to its tragic FQ1’23 guidance.
- However, we choose to look at it optimistically, further loading up on the stock for our next decade portfolio growth and investing.
- MU may outperform expectations from FQ2’23 onwards, due to China’s voracious appetite during the reopening cadence, effectively digesting the former’s elevated inventory issues.
- Thereby, potentially accelerating MU’s top and bottom line growth through FY2025, despite the raised terminal rates and uncertain macroeconomics through 2024.
RapidEye
Investment Thesis
MU YTD Stock Price
Despite the market-wide optimism witnessed earlier, the Micron Technology, Inc. (NASDAQ:NASDAQ:MU) stock continues to trade sideways at $52.04, representing a minimal 7.41% recovery from October’s bottom levels. Otherwise, indicating a tragic -45.65% plunge YTD. However, we reckon that the pessimism is overly done, due to its excellent projected profitability through FY2025 and the expansion plans in New York.
The Feds may raise the terminal rates to 5.1% against the previous projection of 4.6%, indicating prolonged interest pain through 2024, significantly worsened by China’s fast and furious reopening cadence. Nonetheless, we choose to remain confident about the latter, since the country (including Taiwan and Hong Kong) accounts for 36.26% of the company’s revenue in FY2022 despite the sustained Zero Covid Policy then. With market analysts projecting a flurry of ‘revenge’ spending over the next few quarters, China’s GDP is expected to recover tremendously to 5% by 2023, compared to the projection of 3% in 2022 and 6% in 2019.
Combined with the Chinese government’s 300B Yuan stimulus package, this dramatic stock valuation and inventory correction may not last long, since MU may outperform expectations from FQ2’23 onwards. Therefore, investors with higher risk tolerance should consider nibbling at current blood-bath levels, due to the highly attractive risk/reward ratio. Naturally, portfolios should also be sized appropriately in the event of volatility.
The MU Management Proved Highly Prudent In Correcting A Temporal Pain
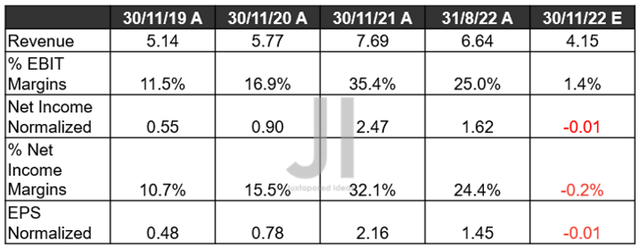
MU Revenue, Net Income ( in billion $ ) %, EBIT %, and EPS
For the upcoming FQ1’23 earnings call, MU has catastrophically guided lower-than-expected revenues and EPS, triggering massive uncertainties indeed. However, we reckon that these numbers are overly prudent, giving the management an opportunity to outperform remarkably. We’ll see, since things may pick up tremendously from FQ2’23 onwards.
MU Balance Sheet ( in billion $ )
S&P Capital IQ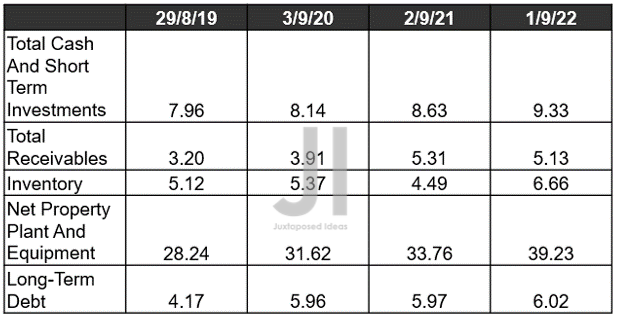
In the meantime, MU’s balance sheet remains very healthy by FQ4’22, with robust cash/ investments of $9.33B and total receivables of $5.13B. Thereby, triggering an improved net debts levels of -$3.4B for FY2022, compared to -$3.06B in FY2021 and -$1.96B in FY2020. Though its inventory levels may seem elevated at $6.66B (30% increase against FY2019 levels), we must also highlight that these are relatively reasonable compared to Nvidia’s (NVDA) $4.45B at 454.95%, Advanced Micro Devices’ (AMD) at $3.36B at 343.07%, and finally Intel’s (INTC) at $12.83B at 46.74%.
Furthermore, MU’s long-term debts are reasonable at $6.02B, since only $1.18B will be due by 2025, and the rest are remarkably well-laddered through 2051. Therefore, we are not concerned about this temporal headwinds at all.
MU FCF ( in billion $ ) % and Dividends
In addition, market analysts still expect MU to pay an in-line dividend of $0.115 for the upcoming quarter, despite the elevated capital expenditures thus far. The company reported a Capex of $12.07B in FY2022, with a projected -37.31% YoY deceleration to $7.56B for FY2023, based on the management’s projected cuts. However, we remain confident about its prospects, since these industry conditions are merely cyclical and do not pose any long-term headwinds on the company’s fundamental performance.
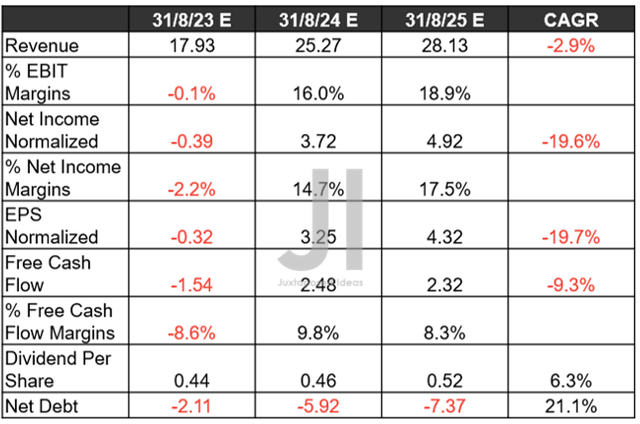
MU Projected Revenue, Net Income ( in billion $ ) %, EBIT %, EPS, FCF %, Dividends, and Debts
While MU’s top and bottom line growth is expected to decelerate YoY for FY2023, we are not concerned since its revenues may rapidly recover by FY2025, nearing hyper-pandemic highs. Furthermore, market analysts may potentially upgrade its short-term performance depending on the management’s forward guidance in the upcoming earnings call and China’s voracious appetite in FQ2’23. Thereby, triggering a potential accelerated return to pre-pandemic EBIT and net income margins of 33.3% and 31.2%, respectively.
Notably, MU may further expand the health of its balance sheet to net debts of -$7.37B by FY2025, indicating massive improvements in its immediate liquidity despite the planned factory in New York. Decent indeed, since its dividends are also expected to grow to $0.52 at the same time, indicating speculative yields of 0.99% against its 4Y historical yield of 0.13% and sector median of 1.55%.
In the meantime, we encourage you to read our previous articles, which would help you better understand its position and market opportunities.
- Micron: Destruction Of Demand – Delicate Balancing Act Ahead
- Micron Stock: Impending Rollercoaster Ride
So, Is MU Stock A Buy, Sell, or Hold?
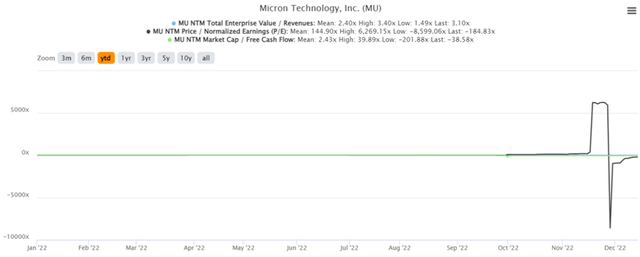
MU YTD EV/Revenue and P/E Valuations
MU is currently trading at an EV/NTM Revenue of 3.10x, NTM P/E of -184.83x, and NTM Market Cap/ FCF of 38.58x, obviously attributed to the management’s overly prudent FQ1’23 guidance. Otherwise, the stock has been averaging at a P/E mean of 11.98x over the past three years and 8.31x pre-pandemic. Based on its FY2025 EPS of $4.32 and recent P/E mean of 11.75x, we are looking at a moderate price target of $50.76, indicating a minimal margin of safety indeed.
However, we choose to be a little more optimistic, due to MU’s potential recovery from FQ2’23 onwards. Based on an expanded EPS by 15% and an ambitious P/E valuation of 13x, we may witness MU reaching an aggressive price target of $64.48 in the short term, indicating an excellent 23.90% upside from current levels. Therefore, we choose to re-rate MU stock as a speculative Buy.
Disclosure: I/we have a beneficial long position in the shares of MU, NVDA, INTC, AMD either through stock ownership, options, or other derivatives. I wrote this article myself, and it expresses my own opinions. I am not receiving compensation for it (other than from Seeking Alpha). I have no business relationship with any company whose stock is mentioned in this article.
Additional disclosure: The analysis is provided exclusively for informational purposes and should not be considered professional investment advice. Before investing, please conduct personal in-depth research and utmost due diligence, as there are many risks associated with the trade, including capital loss.

