Summary:
- Micron’s fiscal Q4 earnings report on September 25 is crucial, with the stock at a critical support level and options positions bullish.
- Consensus expects EPS of $1.10 and revenue of $7.7 billion, but guidance must exceed expectations to avoid disappointment.
- Elevated implied volatility suggests a significant post-earnings move, with key support at $85; breaking this could lead to further declines.
- Rising short-sale volume and gross margin concerns add pressure; strong guidance is essential to reverse the stock’s recent downtrend.
hapabapa
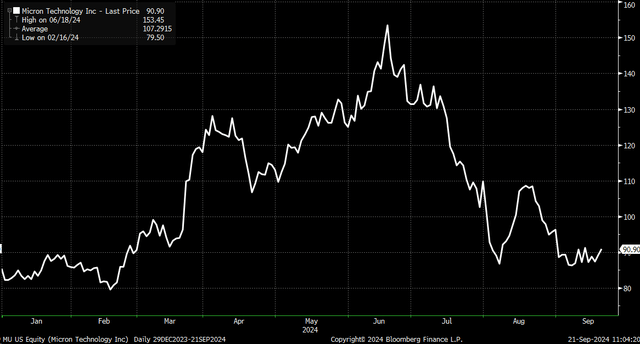
Micron (NASDAQ:MU) will report its fiscal fourth-quarter earnings after the close on September 25, followed by a conference call at 4:30 PM ET. The stock has declined by more than 30% since its June results, erasing nearly all of its gains this year.
This will be an essential earnings call for Micron because the stock is at a critical technical point, hovering around support. Meanwhile, options positions are pretty bullish, and implied volatility is elevated. Short-sale volume has trended higher over the past two weeks. Any disappointment could be a disaster for the shares in the short term, and it will take a better-than-expected quarter and, more importantly, guidance to get the shares heading back to over $100.
What The Street Expects
The consensus forecast is for the company to have earned $1.10 per share, up from a loss of $1.07 per share last year. Meanwhile, revenue is expected to climb more than 90% to $7.7 billion, with DRAM revenue climbing to $5.25 billion and NAND revenue rising to $2.34 billion. Adjusted gross margins are expected to rise to 34.55% from 28.1% q/q as CAPEX more than doubles to $2.9 billion from $1.46 billion last year.
Guidance will be essential for the company because last quarter’s guidance came in line with expectations, and this market has been about rewarding companies that beat and raise while punishing those that do not. Analysts expect fiscal first quarter adjusted EPS of $1.57 per share, revenue of $8.4 billion, and gross margin of 38%.
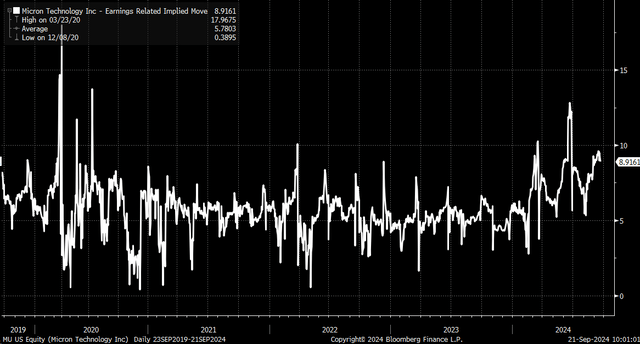
Because the stock has a checkered history of beating and missing analysts’ expectations, followed by big moves following this inconsistency, the market is currently pricing in an 8.9% move higher or lower following results. This is undoubtedly on the higher side of the range regarding expected posted earnings moves in the past, suggesting significant risks around this event and uncertainty.
Options Dynamics
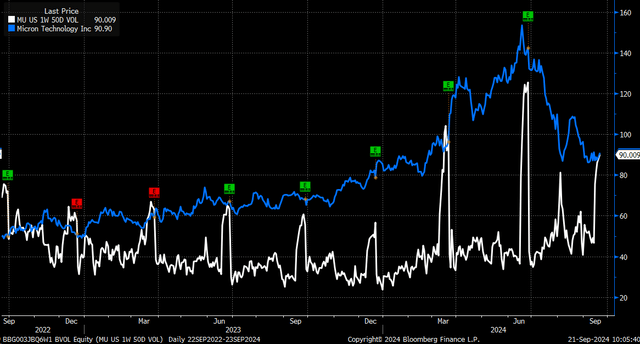
The elevated levels of implied volatility ahead of the results are a crucial driver of the market’s expected trading range. On Friday, the implied volatility for Micron’s 1-week 50 delta options was at 90%, with the potential to rise further as earnings approach. When Micron reported in June, implied volatility reached 125%, a level the stock may see again this quarter.
This is important because implied volatility will drop sharply once the event risk passes and the earnings and guidance are released. This will lead to a repricing of the options in Micron and cause those premiums to drop sharply.
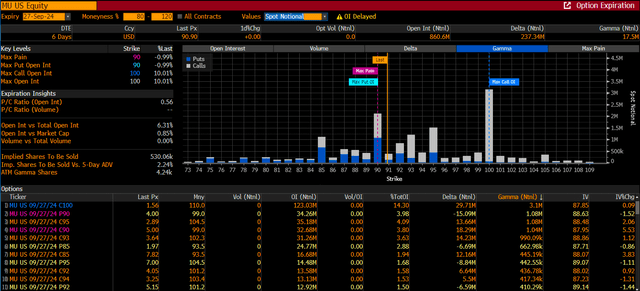
Heading into the results, the critical levels of gamma are concentrated around $90 and $100. But call gamma and call delta significantly outweigh the total amount of put gamma and delta across strike prices, which means that market maker hedging flows are likely positioned in a way that is causing them to be long shares of Micron. However, once the results come out and the IV starts to decline as it usually does, the premium values of both the puts and the calls will begin to fall, and that means that market makers will have stock that comes from sales, putting downward pressure on the stock.
From an options market standpoint, Micron needs to hold at $90. If the $90 level breaks, the next level likely to offer the most support will be $85, which will see gamma levels at that strike price rise as the stock price falls. Therefore, the company must deliver solid results and provide better-than-expected guidance. If that happens, the shares could rise to around $100.
Technical Take
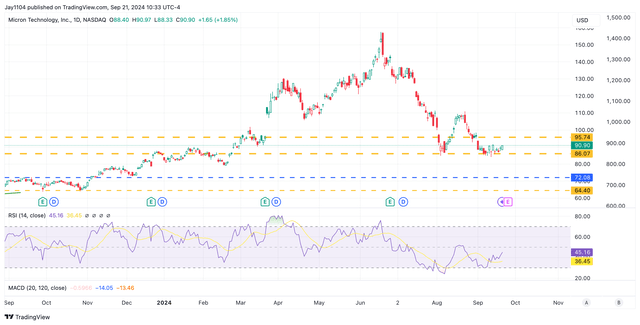
This can also be seen on a technical chart because $85 has supported the stock since early August. If the stock should break support at $85, it could open a path to move lower to around $80 per share. As long as support at $85 can hold, there is a chance, assuming the company can surprise investors with stronger-than-expected guidance, for the stock to fill a gap that is around $96.
Short Sale Volume Rising
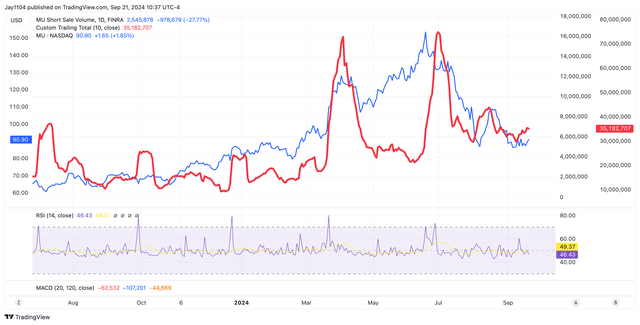
Short sale volume has risen over the past ten days, historically a leading indicator of significant moves in Micron. While still relatively low, the trend heading into the earnings report is notable, especially given the stock’s recent volatility.
All About Gross Margins
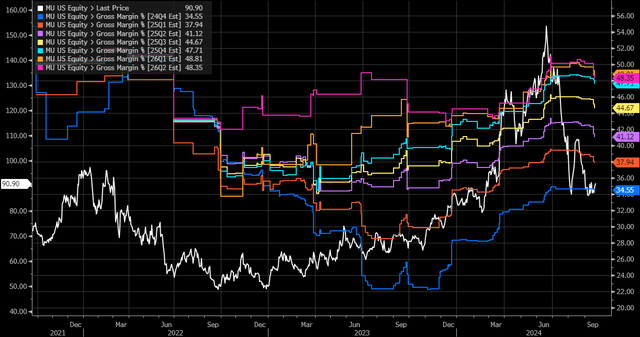
Micron has also been a gross margin story company, and the stock price tends to lead to changes in gross margins. The stock’s recent struggles might suggest that gross margins are nearing a turning point lower, indicating that gross margin guidance this quarter may carry some extra weight. In-line gross margin guidance may only convince the market that margins are closer to their peak and have less room to expand because analysts’ estimates for future quarters’ margins are starting to decline. A miss on gross margin guidance would only accelerate the fear already built up.
This quarter’s results and guidance are critical for Micron. With options markets and technical levels suggesting a potential downside risk, the company must beat analysts’ forecasts, particularly guidance, to avoid further declines. A disappointing quarter could see the stock testing the $85 level or lower. Guidance must be robust to get this stock higher again, or it could be a painful path forward for holders of the shares expecting any short-term bounce after the sharp drop following July results.
Analyst’s Disclosure: I/we have no stock, option or similar derivative position in any of the companies mentioned, and no plans to initiate any such positions within the next 72 hours. I wrote this article myself, and it expresses my own opinions. I am not receiving compensation for it (other than from Seeking Alpha). I have no business relationship with any company whose stock is mentioned in this article.
Charts used with the permission of Bloomberg Finance L.P. This report contains independent commentary to be used for informational and educational purposes only. Michael Kramer is a member and investment adviser representative with Mott Capital Management. Mr. Kramer is not affiliated with this company and does not serve on the board of any related company that issued this stock. All opinions and analyses presented by Michael Kramer in this analysis or market report are solely Michael Kramer’s views. Readers should not treat any opinion, viewpoint, or prediction expressed by Michael Kramer as a specific solicitation or recommendation to buy or sell a particular security or follow a particular strategy. Michael Kramer’s analyses are based upon information and independent research that he considers reliable, but neither Michael Kramer nor Mott Capital Management guarantees its completeness or accuracy, and it should not be relied upon as such. Michael Kramer is not under any obligation to update or correct any information presented in his analyses. Mr. Kramer’s statements, guidance, and opinions are subject to change without notice. Past performance is not indicative of future results. Neither Michael Kramer nor Mott Capital Management guarantees any specific outcome or profit. You should be aware of the real risk of loss in following any strategy or investment commentary presented in this analysis. Strategies or investments discussed may fluctuate in price or value. Investments or strategies mentioned in this analysis may not be suitable for you. This material does not consider your particular investment objectives, financial situation, or needs and is not intended as a recommendation appropriate for you. You must make an independent decision regarding investments or strategies in this analysis. Upon request, the advisor will provide a list of all recommendations made during the past twelve months. Before acting on information in this analysis, you should consider whether it is suitable for your circumstances and strongly consider seeking advice from your own financial or investment adviser to determine the suitability of any investment.
Seeking Alpha’s Disclosure: Past performance is no guarantee of future results. No recommendation or advice is being given as to whether any investment is suitable for a particular investor. Any views or opinions expressed above may not reflect those of Seeking Alpha as a whole. Seeking Alpha is not a licensed securities dealer, broker or US investment adviser or investment bank. Our analysts are third party authors that include both professional investors and individual investors who may not be licensed or certified by any institute or regulatory body.
Join Reading The Markets
Reading the Markets helps readers cut through all the noise, delivering daily video and written market commentaries to prepare you for upcoming events.
We use a repeated and detailed process of watching the fundamental trends, technical charts, and options trading data. The process helps isolate and determine where a stock, sector, or market may be heading over various time frames.


