Summary:
- Micron’s DRAM results in the past several quarters are weak when compared to HBM3 market leader SK Hynix.
- As the memory market improves from its year-long super-cyclical downturn, Micron’s DRAM growth will be stymied from its late entry into the HBM market.
- Micron’s fiscal 2024 capex is projected to be slightly higher than fiscal 2023 levels, with a decrease in WFE spend.
- SK Hynix plans to invest in technology migration and premium DRAM, as it expands its dominating HBM3E output.
- Samsung expects market bit growth for DRAM to be around 10% in the fourth quarter, exceeding the market on moderate HBM3E outlook.
Say-Cheese/iStock via Getty Images
Introduction
While it might be too early to expect a full-scale turnaround, there are some positive signals in key indicators and the global supply chain. Demand has only just started to show signs of growth. As demand for PCs, mobile devices, and traditional server equipment begins to recover, I can also anticipate increased demand for memory chips.
Memory makers are now moving past the recent supercyclical downturn, caused largely by capex/WFE overspend in 2020 and 2021, and the ensuing macroeconomic issues impacting consumer discretionary spending.
In the past year, the rise in generative AI (artificial intelligence) that includes ChatGPT and its demand for high bandwidth memory (“HBM”) has been a catalyst for growth of DRAMs.
I first discussed HBM in a February 24, 2023 Seeking Alpha article entitled “TSMC Makes The Chips, But Nvidia Gets The Glory.” In a June 23, 2023 Seeking Alpha article entitled “Micron: Late To The Game AI Strategy And Politics Do Not Make For A Strong Company,” I detailed the history of HBM, and noted that while SK Hynix (OTC:HXSCL) and Samsung Electronics (OTCPK:SSNLF) were moving forward with various iterations of HBM technology since 2013, Micron (NASDAQ:MU) didn’t focus on HBM technology until 2018.
With its late start, MU is struggling, with just a 10% share of the HBM market., according to an Information Network report. Following recent earnings calls, data show that Micron’s DRAM results are significantly worse than SK Hynix and Samsung. I attribute this to lost share because of a small share of the HBM market. HBMs’ average selling price (“ASP”) is at least three times that of DRAM. HBMs require a complex production process and highly advanced technology.
Q3 Review
For DRAM, in the third quarter, Samsung Electronics’ bit growth was approximately 10% and ASP increased by a percentage in the mid-single digits. For the fourth quarter, the company expects market bit growth to be around 10% in bit growth to exceed the market. For NAND, its bit growth declined by a low single-digit percentage, while ASP increased by a low single-digit percentage.
Samsung said it will expand its supply of cutting-edge memory, including 10-nm 4th-generation (1a) and 5th-generation (1b) DRAM and 7th- and 8th-generation V-NAND flash memory, without making any downward adjustments.
Samsung expects full year capex to be approximately KRW 53.7 trillion with KRW 47.5 trillion allocated to DS and KRW 3.1 trillion to Display.
Micron’s fiscal 2024 capex is projected to be up slightly compared to fiscal 2023 levels. WFE spend will be down again year-over-year in fiscal 2024.
SK Hynix has reported a substantial decrease in inventory in the third quarter due to production cutbacks, and its sales have rebounded quarter-on-quarter thanks to decreasing customer inventories. Looking ahead to 2024, the company has outlined its plans, which include:
- Investing in technology migration and premium DRAM, such as High Bandwidth Memory (“HBMs”).
- Restricting investments in NAND until industry conditions show signs of improvement.
Despite the expected growth in demand, estimated to be nearly 20% based on bit growth, SK Hynix anticipates that its chip production will increase at a single-digit rate in 2024. As a result, the company foresees that its inventories will return to a more normalized level around mid-2024.
SK Hynix is confident that the memory industry is entering a recovery phase and has already allocated all of its planned HBM production for 2024, signaling its positive outlook for the future.
Micron reported DRAM revenue showed a 3% sequential increase. This growth was primarily driven by a significant uptick in bit shipments, which increased in the mid-teens percentage range. However, prices experienced a decline in the high-single-digit percentage range. For the entire fiscal year, DRAM revenue witnessed a year-over-year decline of 51%, amounting to $11 billion, which made up approximately 71% of the total revenue.
During the fourth fiscal quarter, NAND revenue reached $1.2 billion, accounting for roughly 30% of Micron’s total revenue. NAND revenue exhibited a robust 19% sequential increase, primarily attributed to a notable rise in bit shipments, exceeding 40%. This surge was influenced by the timing of shipments, including strategic purchases. Nevertheless, prices experienced a decrease in the mid-teens percentage range. For the entire fiscal year, NAND revenue saw a year-over-year decline of 46%, amounting to $4.2 billion, which represented approximately 27% of the total revenue.
DRAM
Revenue
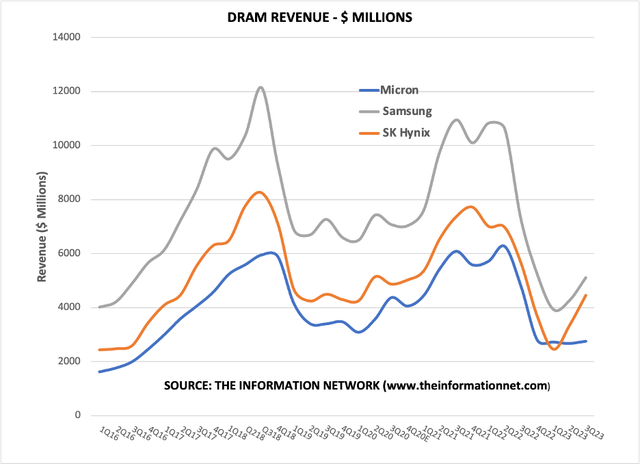
Chart 1 shows DRAM revenue for the period Q1 2016 through Q3 2023 (Micron’s fiscal Q4 2023).
Micron’s DRAM revenue growth of just 3% was significantly lower than that of competitors. The fact that HBM is priced at 7x those of standard DRAMs, and Micron shows minimal ramp in DRAM revenue indicates the company’s minimal acceptance to customers.
In addition, Micron was the first in the industry to introduce 1-beta DDR5 and LP5X DRAM products and the first to ship HBM3E samples with industry-leading performance and power efficiency. The fact that Micron may have technological advantages over competitors suggests management execution issues.
Chart 1
Shipments
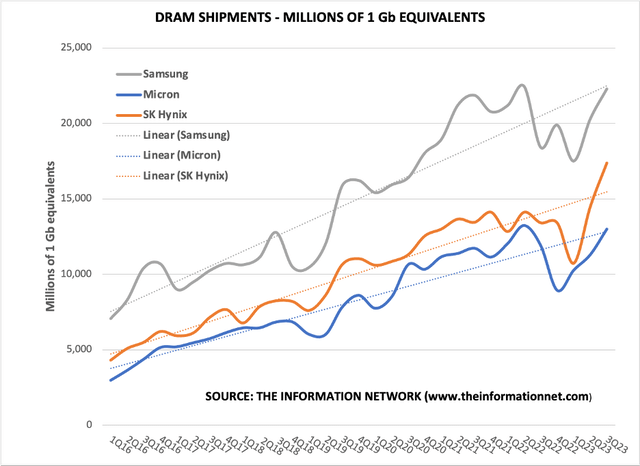
Chart 2 shows DRAM bit shipments by company. It is clear from the dotted trendlines that Samsung had a significant lead in the sector but in recent quarters lost share to SK Hynix, probably associated with the company’s lead in the HBM market. Micron has significantly underperformed competitors.
Chart 2
ASP
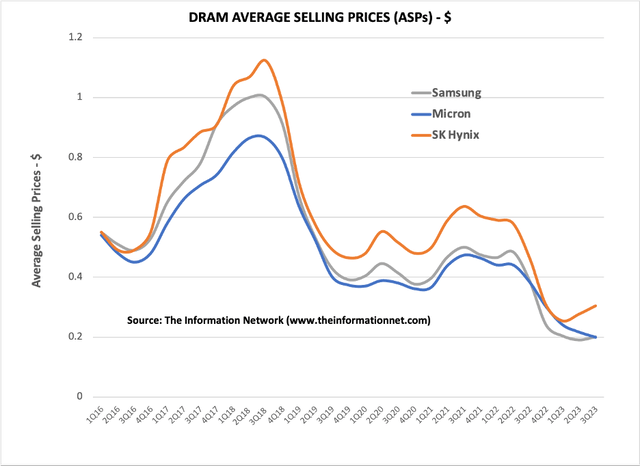
ASPs (average selling prices) is another indication that the DRAM sector SK Hynix is recovering faster than competitors from the memory downturn, attributed to its lead in the HBM market, as shown in Chart 3.
Chart 3
Investor Takeaway
As the memory industry moves out of a sustained downturn, brought about by excessive capex spend and intensified by a poor economy, investors need to look to 2024. Currently each of the three companies have offered guidance for CY2024, but we need to look beyond the hype, which has been the focus of my articles.
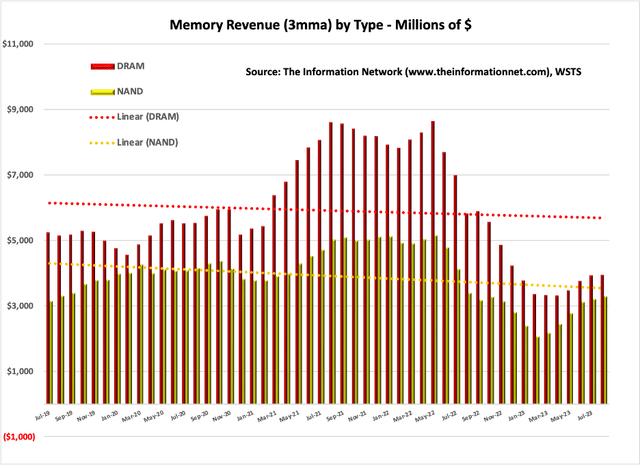
Chart 4 shows DRAM and NAND revenues on a 3-month moving average through September 2023. Memory sales experienced significant growth in September, increasing by 2.9% compared to the previous month. This increase was driven by a 92.2% MoM growth in DRAM sales and a 10.1% MoM increase in NAND sales.
Memory sales experienced significant growth in September increasing by 2.9% compared to the previous month. This increase was driven by an 11.7% month-over-month (“MOM”) growth in DRAM sales and a -7.7% MoM increase in NAND sales.
On a QoQ basis, memory increased 14.7% based on DRAM growth of 16.5% and 14.0% for NAND. These are consistent with data for Samsung, SK Hynix, and Micron revenues in Chart 1.
Chart 4
SK Hynix appears to be taking the lead in the memory industry, as it increases its lead in the HBM sector. The company I give priority to investments in technology migration to 1anm and 1bnm processes while securing capacity for HBM and Through-Silicon Via (“TSV”). This strategic focus is aimed at maintaining a leading position in markets such as DDR5, LPDDR5, and HBM in the coming year. Consequently, the company plans to increase its capex for the next year compared to the current year, but it intends to minimize the increase by carefully considering investment efficiency and financial stability.
Moving into 2024 in DRAM, a slow recovery will continue that started in 2H 2023. But I expect continued headwinds for MU in the HBM as it competes against SK Hynix and its strong competitiveness in HBM chips, which positions it favorably for achieving accelerated improvements in both ASP and bit growth when compared to its competitors Micron and Samsung for the current year.
Remarkably, SK Hynix holds the unique distinction of being the sole company globally engaged in mass-producing HBM3, with exclusive supply arrangements to Nvidia (NVDA) for the H100 Tensor Core GPU. I anticipate sales of HBM chips are set to experience a substantial 45% YoY surge in 2023, followed by a notable 40% YoY increase in 2024. These developments are poised to be a strong headwind for Micron.
Micron has boasted it will gain better performance with its 1α-based HBM3 Gen2 products. Specifically, Micron has emphasized that their HBM3 Gen2 is anticipated to outpace SK Hynix’ HBM3E by approximately 15%, noting a robust data rate of 9.2 GT/s in contrast to SK Hynix’ 8 GT/s offering.
But Micron is forgetting that SK Hynix continues to improve its technology. More importantly, SK has demonstrated design prowess of HBM technology. SK has a long established partnership with Nvidia, which continues make more advanced GPUs for the AI space, and Taiwan Semiconductor (TSMC) (TSM), which is expanding its HBM capacity.
With improvements in the memory market following a long downturn as ASPs plummeted and inventory overhang abates, I am raising my call to a Hold on MU, up from my previous Sell. Revenues will grow through 2024, but market share will drop in DRAM.
Editor’s Note: This article discusses one or more securities that do not trade on a major U.S. exchange. Please be aware of the risks associated with these stocks.
Analyst’s Disclosure: I/we have no stock, option or similar derivative position in any of the companies mentioned, and no plans to initiate any such positions within the next 72 hours. I wrote this article myself, and it expresses my own opinions. I am not receiving compensation for it (other than from Seeking Alpha). I have no business relationship with any company whose stock is mentioned in this article.
Seeking Alpha’s Disclosure: Past performance is no guarantee of future results. No recommendation or advice is being given as to whether any investment is suitable for a particular investor. Any views or opinions expressed above may not reflect those of Seeking Alpha as a whole. Seeking Alpha is not a licensed securities dealer, broker or US investment adviser or investment bank. Our analysts are third party authors that include both professional investors and individual investors who may not be licensed or certified by any institute or regulatory body.


