Summary:
- Micron Technology is a buy due to strong technicals and fundamentals, with significant revenue and EPS improvements YoY and AI-driven growth prospects.
- Daily, weekly, and monthly technical analyses indicate a sustainable uptrend, with key support levels and bullish momentum outweighing mixed signals.
- Fundamentals show an impressive financial resurgence, with revenue and EPS beating expectations, and strong operating cash flows and gross margin improvements.
- Valuation multiples remain low despite AI tailwinds, suggesting Micron is undervalued relative to its growth potential, making it an attractive investment.

vzphotos
Thesis
After slumping around 50% in 2022, Micron Technology, Inc.’s (NASDAQ:MU) latest resurgence is here to stay. As discussed below, the technicals are net positive in all time frames as the stock remains in an uptrend. In addition, the fundamentals look strong as revenue and EPS shows significant improvements YoY. Furthermore, the stock seems to be undervalued relative to its growth as AI tailwinds continue to provide growth for their HBM business. After considering both the technicals and fundamentals of Micron, I believe its stock is a buy.
Daily Analysis
Chart Analysis
Yahoo Finance
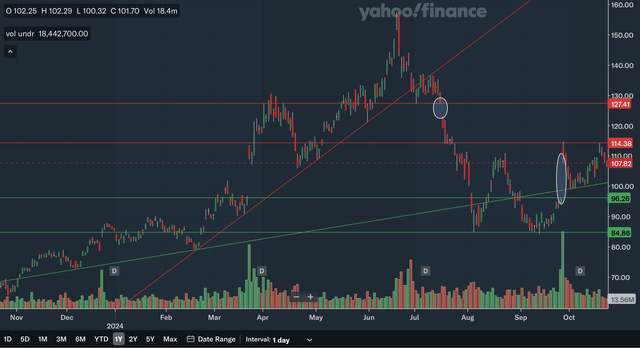
The daily chart for Micron is quite a mixed one, as there is both significant support as well as resistance. The stock broke a very steep uptrend line in early July, and the stock has slumped since then. The closest area of resistance would be in the mid-110s, as that zone was resistance in late September as well as earlier this month. The next resistance level would be at 127 as that was a downward gap back in July. The former uptrend line could also be resistance but is quickly moving out of relevance. As for support, the nearest level would be a less steep uptrend line. Although this line was broken in early and late August, this line had significant bounces all the way back in 2023 and just very recently this month. Therefore, I would still consider it intact and an important level of support. The next level of support would be in the mid-90s as this represents an upside gap in late September. Lastly, there is also support in the mid-80s as it was significant support in August as well as September. These two bounces look like a double bottom, which could indicate the near term bottom is in for Micron. Overall, from this daily chart, I believe Micron is still in a strong short-term position as it has reclaimed the slower uptrend line and has solid support underneath.
Moving Average Analysis
Yahoo Finance
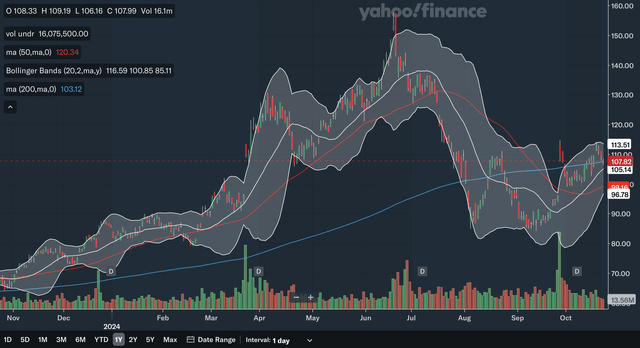
The 50-day SMA and the 200-day SMA had a death cross back in September, but the stock has actually advanced quite a bit since that signal demonstrating strength. Despite this crossover, the 50-day SMA is closing the gap with the 200-day SMA as of late, showing this death cross may very well be a false signal as bullish momentum returns. The stock is currently trading very near the support of the 200-day SMA. As for the Bollinger Bands, the stock is currently very near the 20-day mid-line, which should act as support in an uptrend. That line has been support earlier in the month and I expect the stock to hold above it. In my view, although there was a formation of the death cross recently, the MAs actually reflect a net positive picture as the shrinking of the gap between the MAs shows a resurgence of bullish momentum and the stock is near the support of the key MAs.
Indicator Analysis
Yahoo Finance
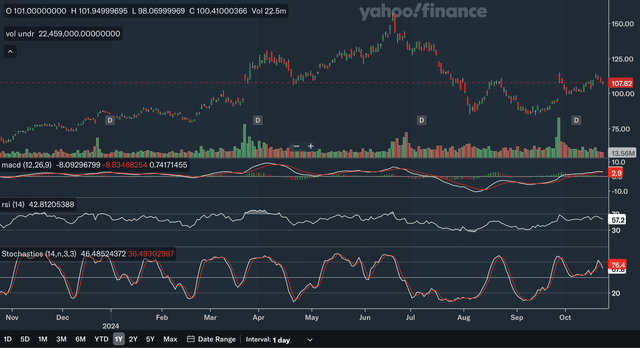
The MACD is currently above the signal line after a bullish crossover back in early September. The MACD showed early positive divergence at the double bottom, as the MACD held significantly above the prior trough while the stock dropped back to the August low in September. For the RSI, it has a current reading of 57 showing it is neither oversold nor overbought. It too showed positive divergence at the double bottom and should have given investors an early signal that the bottom was in. Lastly, for the stochastics, the %K just crossed beneath the %D which is a bearish signal. This indicates that in the very near term, there could be a decrease in bullish momentum. Overall, I believe these indicators reflect a net positive near term outlook for Micron, despite the bearish crossover in the stochastics, as the MACD and RSI clearly show the bottom is in.
Takeaway
All three of these daily analyses show a net positive short-term technical outlook for Micron. Despite some mixed signals in all of these analyses, key signals show that the stock is in a strong position. The chart shows Micron remains in a slower uptrend but an uptrend, nonetheless, the moving averages show a resurgence of bullish momentum with the narrowing of the MA gap, and the indicators show the near term bottom is in.
Weekly Analysis
Chart Analysis
Yahoo Finance
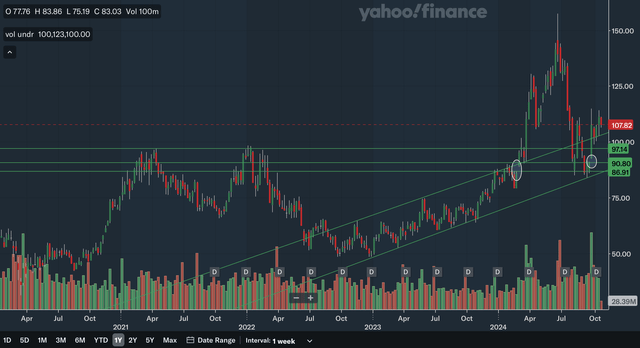
The intermediate term chart is a very positive one for Micron. The stock has minimal resistance overhead, as the all-time high remains far above. The stock broke out of an upper channel line very early this year, indicating an acceleration of the uptrend but re-entered the channel in the middle of the year. The stock just quite recently broke above the upper channel line again, showing that we may be in for a strong uptrend once again. The nearest support level would be the upper channel line. The next level of support would be in the mid-90s, as that level was very significant resistance in 2021 and 2022. We also have support at the upside gaps at 90 and in the mid-80s. The gap in the mid-80s has already acted as support twice. Lastly, the lower channel line would also act as support if the stock slumps. From my chart analysis, it is clear that the intermediate term outlook is very strong as the uptrend re-accelerates while there is very near support.
Moving Average Analysis
Yahoo Finance
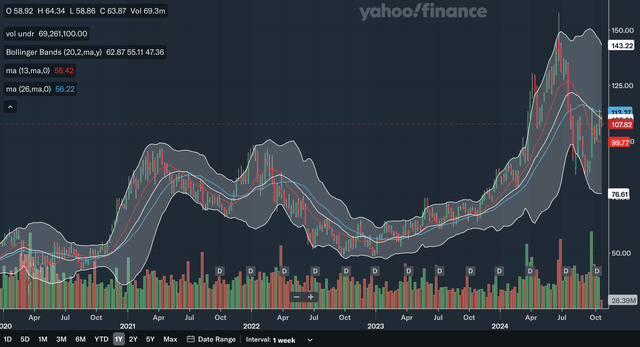
The weekly MAs show a less positive picture for Micron. The 13-week SMA had a bearish crossover with the 26-week SMA earlier in the year. Like in the daily analysis, the stock has actually gained since this bearish signal, demonstrating strength. The gap between the MAs have stopped widening, indicating a halt of the bearish momentum. The stock is currently trading below the 26-week SMA but above the 13-week SMA. For the Bollinger Bands, the stock is right at the critical 20-week midline, which could be resistance. The 20-week midline acted as support from early 2023 all the way to the middle of this year, showing its significance. Overall, these MAs show a net negative intermediate term situation for Micron as the stock remains below the resistance of the 26-week SMA and the Bollinger Bands midline.
Indicator Analysis
Yahoo Finance
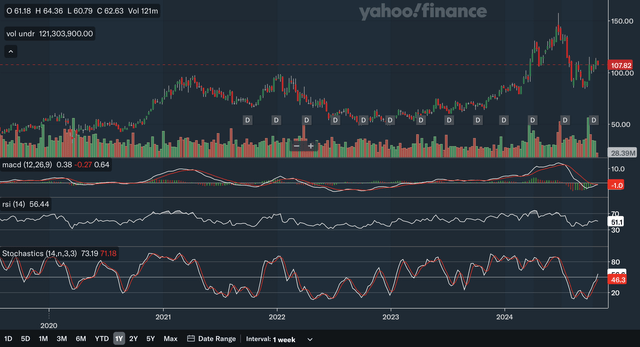
The MACD is currently at the same level as the signal line, and a bullish crossover seems to be imminent. After months of being a large margin below the signal line, the recent stock surge has strengthened the MACD as bullish momentum returns. For the RSI, it has reclaimed the all important 50 level, showing the balance of power is shifting back in the bulls’ favour. Lastly, for the stochastics, there was a bullish crossover not too long ago as the %K crossed above the %D within the oversold 20 zone. After a period of the gap closing between the two lines, the %K has accelerated and widened the margin once more, reflecting the re-accelerating bullish momentum. In my view, these indicators show a strong resurgence for Micron stock, as there are positive signs from all three of these key indicators.
Takeaway
Despite some negativity with the moving averages and Bollinger Bands, the intermediate technical outlook is a positive one. The charts show that Micron is entering into an accelerated uptrend and the indicators show that the bulls are returning to the stock. In addition, despite the negative signals in the MAs, the stock has actually climbed since the latest bearish crossover, indicating strength.
Monthly Analysis
Chart Analysis
Yahoo Finance
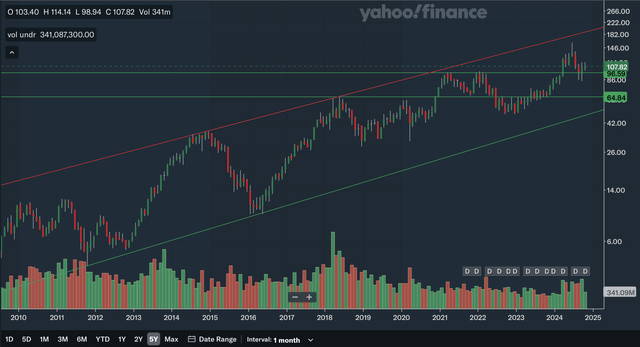
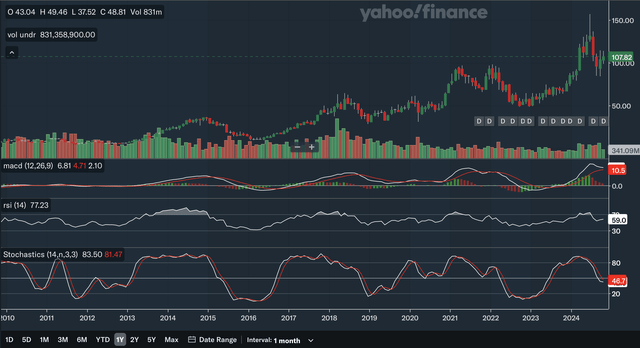
Note that the above chart in a logarithmic scale to better reflect Micron’s long-term uptrend. The stock is currently trading within an upward channel. The lower channel line dates above to 2011 and has been supported throughout the years. The upper channel line dates back to 2014 and was resistance this year. The upper channel line is the only source of resistance in the long term for Micron, and as you can see, the stock can still experience heavy gains even if it remains under this line. The nearest level of support would be in the mid-90s as discovered in the weekly analysis. There is also support further down in the mid-60s, as that level was significant resistance in 2018 and 2020. Lastly, we also have the support of the lower channel line. Overall, I believe it is clear the long-term outlook for Micron is bright as the uptrend remains highly intact and resistance remains miles above.
Moving Average Analysis
Yahoo Finance
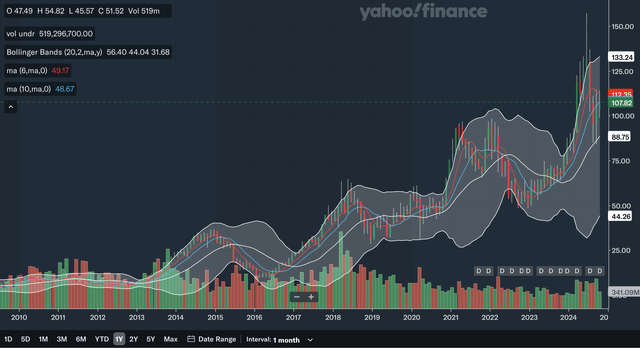
The long-term moving averages show a bit of a mixed picture. The 6-month SMA had a bullish crossover with the 10-month SMA back in early 2023 and the 6-month SMA has remained above the 10-month SMA since. However, recently, the gap between the two has narrowed, indicating decreased bullish momentum. On the brighter side, the 6-month SMA’s downward trajectory has levelled off a bit, perhaps preventing a bearish crossover from occurring. The stock is currently trading between the two MAs. For the Bollinger Bands, the stock recently bounced off the 20-month midline, indicating that the long-term uptrend remains intact. The pullback this year was not surprising, as the stock surged above the upper band earlier in the year. In my view, the MAs and Bollinger Bands show a net positive long-term situation for Micron.
Indicator Analysis
Yahoo Finance
Currently, the MACD is holding above the signal line since a bullish crossover in the middle of 2023, but the gap has been narrowing for quite a while as shown by the histogram. A crossover could still be avoided as the signal line seems to be losing upward momentum while the MACD seems to be losing downward momentum. For the RSI, despite the decline this year, it remains above the 50 mark, showing that the bulls have been resilient. Lastly, for the stochastics, the %K remains below the %D after a bearish crossover earlier in the year, but the gap has been recently closing as the %K has stopped falling while the %D continues it sharp downward trajectory. Therefore, a bullish stochastics signal could come soon. Although there are some weakness signals with the MACD gap closing and the %K remaining below the %D, I believe these indicators show a net positive long-term outlook for Micron as the MACD decline seems to levelling off, and the RSI is holding above the critical 50 level.
Takeaway
All three of these monthly analyses show a net positive long-term technical position for Micron. The charts and Bollinger Bands show that the stock is in a healthy uptrend with support underneath, while the 6-month SMA holds above the 10-month SMA. Lastly, for the indicators, despite some signs of weakness, there are important signals of strength as well.
Fundamentals & Valuation
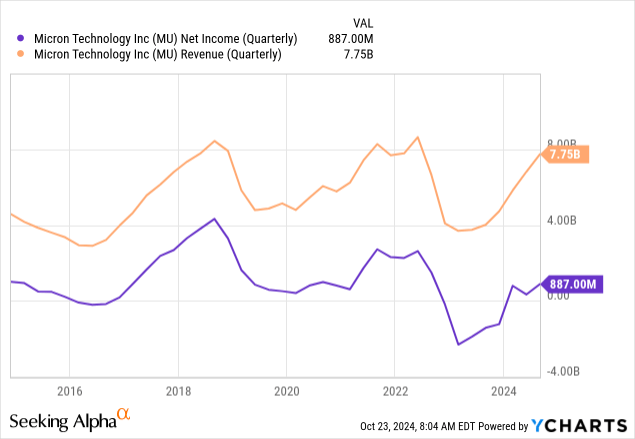
In their earnings report in September, Micron reported strong figures. They reported revenues of $7.75 billion, up from only $4.01 billion in the year ago period. As for EPS, they reported an adjusted figure of $1.18 versus a $1.07 loss in the year ago period. Both of these results beat expectations as revenue beat by $104.47 million and EPS beat by $0.07. These are in no doubt impressive results and as you can see in the chart above, it represents a resurgence for Micron after the business hit a lull from mid-2022 to late 2023. Other highlights in their earnings include the impressive operating cash flows improvement as it increased from $249 million to $3.41 billion YoY and the gross margin improvement as it improved to 35.3% from -10.8% in the year ago period. Clearly, things are going in the right direction for Micron.
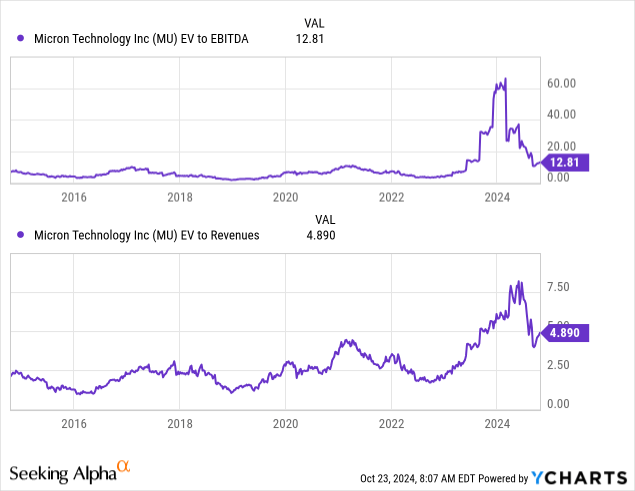
The EV/EBITDA and EV/Revenue ratios have declined significantly since the peak set earlier in the year. The EV/EBITDA ratio is currently in the low teens, after being over 60 at the beginning of the year. The EV/Revenue ratio is currently at around 5 after being above 7.5 earlier in the year. With the resurgence of revenues and net income being the strongest in years, I believe Micron stock is currently moderately undervalued. As you can see in the revenue and net income chart above, the trajectory of financial growth for Micron has been very impressive in the TTM and with the AI infrastructure build-out showing no signs of slowing down, Micron’s resurgence could be here to stay. Although the current upswing in their financials somewhat mirrors those in 2017 and 2021, the AI tailwinds we are currently seeing dwarfs what we saw back then, as we could be entering an AI powered industrial revolution. Combining a relatively lower valuation with strong AI tailwinds, I believe the stock has room to run. Seeking Alpha confirms my view that Micron is undervalued, as it currently has an A- valuation rating for Micron stock. This stock is cheap relative to its growth potential.
Conclusion
From the analyses above, it is clear that the technicals point to a bright future for Micron, as the analyses of all the time frames show that the stock is in a sustainable uptrend. As for the fundamentals, as discussed above, Micron’s fundamentals are rapidly improving as the AI boom boosts both top and bottom lines. Despite these strong AI tailwinds, the valuation multiples remain relatively low to moderate. Therefore, I believe the stock is undervalued relative to its growth prospects, as AI is the strongest growth driver Micron has seen in years. Overall, from my analysis, I conclude that Micron is a buy as the technicals and fundamentals converge to the result that its resurgence is here to stay.
Analyst’s Disclosure: I/we have no stock, option or similar derivative position in any of the companies mentioned, and no plans to initiate any such positions within the next 72 hours. I wrote this article myself, and it expresses my own opinions. I am not receiving compensation for it (other than from Seeking Alpha). I have no business relationship with any company whose stock is mentioned in this article.
Seeking Alpha’s Disclosure: Past performance is no guarantee of future results. No recommendation or advice is being given as to whether any investment is suitable for a particular investor. Any views or opinions expressed above may not reflect those of Seeking Alpha as a whole. Seeking Alpha is not a licensed securities dealer, broker or US investment adviser or investment bank. Our analysts are third party authors that include both professional investors and individual investors who may not be licensed or certified by any institute or regulatory body.
