
Summary:
- Microsoft’s vast business segments pose both significant upside and potential stagnation.
- Microsoft’s stock is up around 56% YTD. When factoring in each different business segments, the company can nevertheless be at an attractive entry point right now.
- Predicting suitable growth and margins for each of the business segments, we get a potential miss-valuation of -28% to 37%.
FinkAvenue
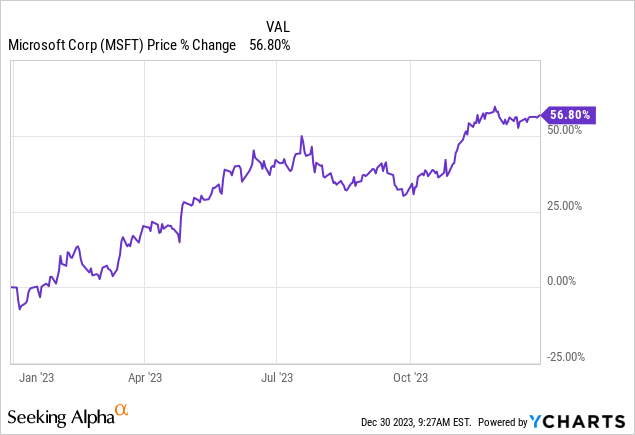
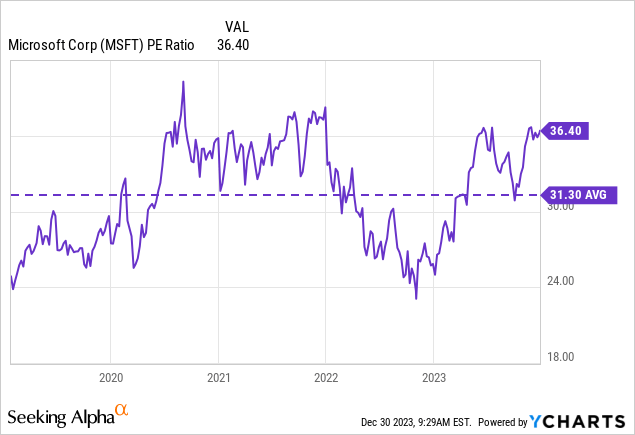
anMicrosoft (NASDAQ:MSFT) is currently up around 56% YTD. The company was already rather “pricey” before this bull run, if we take a look at the company’s PE Ratio over the last few years. Their 5y average hovers right around 31.
I think we can all agree that a company like Microsoft with this high quality deserves some kind of premium compared to peers or the overall market. Especially when considering the different business ventures of Microsoft and the growth prospects of these segments, which additionally produced very constant and reliable growth over the last years:
Revenue of Microsoft broken down by segment 2012-2023 (statista.com)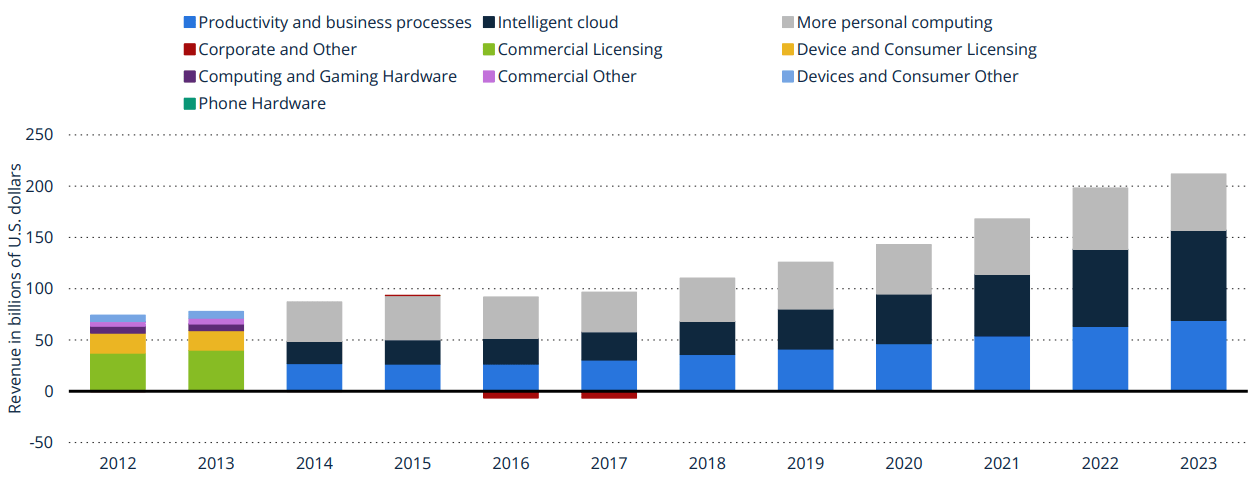
Traditional valuation methods like PE Ratios tend to under-appreciate high quality companies with solid growth prospects, just like Microsoft. To valuate the company independently, we’ll now take a look at the different business segments of Microsoft as well as the different products the company is offering within these segments to get an in-depth understanding of future revenues and margins. We then take these metrics and evaluate the company using a Bear and Bull Case Discounted Cash Flow Analysis.
Productivity and Business Processes
Office & Dynamics
Part of this segment are the well know Microsoft Office Apps, which include for example Word, Excel, PowerPoint and Project. Here Microsoft and Google (GOOG, GOOGL) are the clear market leaders with both of them owning around 50% of the global market share.
Office productivity software market share worldwide 2022 (statista.com)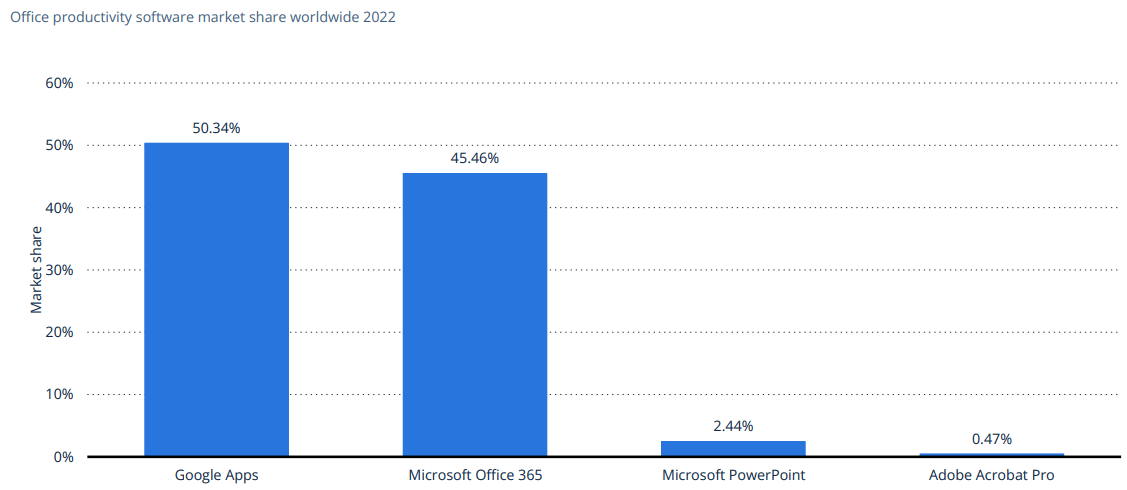
Another aspect of this segment is Microsoft Dynamics, which is a set of business tools designed to assist companies in managing and streamlining several areas of their operations. It offers a selection of enterprise resource planning (ERP) and customer relationship management (CRM) systems that let companies automate financial, customer service, sales, and other crucial operations. Microsoft Dynamics is intended to improve an organization’s productivity, teamwork, and data-driven decision-making.
The whole business productivity software market, which in my opinion includes Dynamics and Office, is expected to grow at 15.3% p.a. in the next few years. In the Bull Case we assume that MSFT manages to hold its high market share in this segment and therefore achieves a revenue growth rate with this business venture of 15% p.a.. For the Bear-Case we assume that the consumers increasingly use the free variants of the main competitor Google which in turn leads to a growth rate below the market.
Another important product in this segment is the social media platform LinkedIn. LinkedIn is a professional social networking site where users may make connections with businesses, professionals, and coworkers. Users construct digital resumes called profiles that highlight their education, experience, and skills in the workplace. LinkedIn can be used for business development, networking, and job finding. Users can join professional organizations, network with individuals in their sector, and exchange industry-related content on this platform.
The platform has seen some solid growth over the last few years and has currently around 700 million users.
Number of LinkedIn Users (statista.com)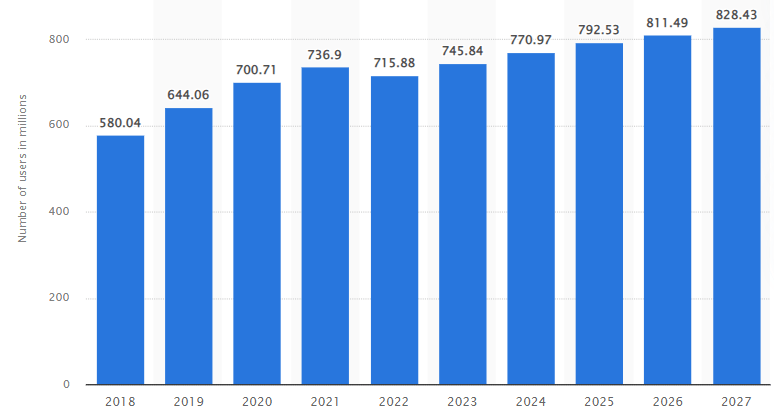
While the user growth of LinkedIn is already pretty impressive, the growth of generated revenue of the platform is even better. They achieved a revenue growth rate of 40% over the last 12 years and 25% over the last five years. The Social Networking market is expected to grow at an annual growth rate of ~7% in the following years, I however believe that LinkedIn can exceed these assumptions, as most of the potential users don’t have an account on LinkedIn yet.
Social network usage by brand in the U.S. (statista.com)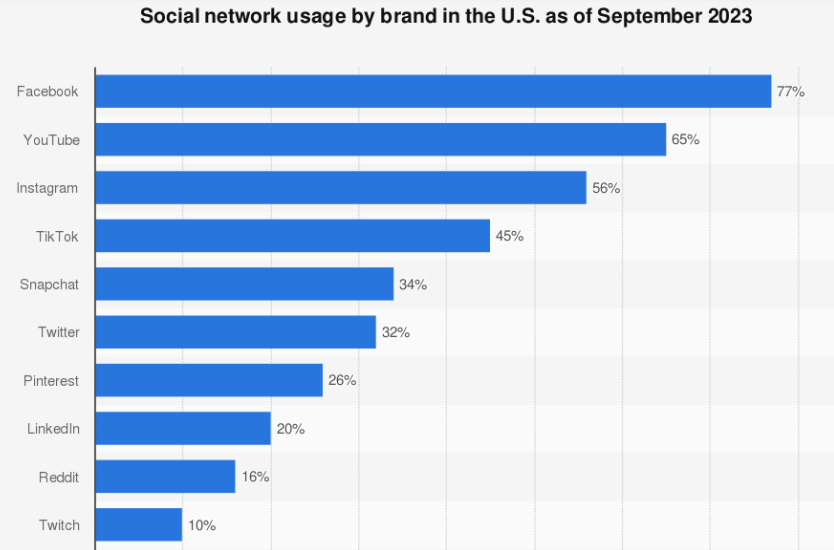
I also think that the uniqueness of the platform as a career platform and tool heavily benefits the future growth projections of LinkedIn.
The revenue distribution in this segment was like the following.
| 2023 | 2022 | 2021 | ||||
| Revenue | in % | Revenue | in % | Revenue | in % | |
| Office Products | 48,728 | 70% | 44,862 | 71% | 39,872 | 74% |
| 15,145 | 22% | 13,816 | 22% | 10,289 | 19% | |
| Dynamics | 5,437 | 8% | 4,687 | 7% | 3,754 | 7% |
We will now use the percentage of the fiscal years 2023 of the revenue as a weighting, to calculate the anticipated revenue growth rate for the whole Productivity and Business Processes segment.
| Revenue CAGR Bear | Weighting | Revenue CAGR |
| Office & Dynamics | 78% | 10% p.a. |
| 22% | 15% p.a. | |
| Productivity and Business Processes | 100% | 11.1% |
| Revenue CAGR Bull | Weighting | Revenue CAGR |
| Office & Dynamics | 78% | 15% p.a. |
| 22% | 25% p.a. | |
| Productivity and Business Processes | 100% | 17.2% |
The margins of this business were in the range of 45% to 49%, with a clear and constant increase over the last few years.
| 2021 | 2022 | 2023 | |
| EBIT Margin | 45% | 47% | 49% |
To adjust for the Bear and Bull Case, I anticipated the following margin development:
| EBIT Margin | 2023 | 2024 | 2025 | 2026 | 2027 | 2028 | 2029 | 2030 |
| Bear | 49% | 45% | 45% | 45% | 45% | 45% | 45% | 45% |
| Bull | 49% | 50% | 55% | 55% | 55% | 55% | 55% | 55% |
Intelligent Cloud
Microsoft’s Intelligent Cloud division offers a range of cloud-based services and solutions, such as server products, cloud services, and Azure cloud services for networking, computation, and storage. This market niche specializes on providing corporate services, AI, analytics, and hybrid solutions that let companies take use of scalable and adaptable cloud infrastructure to boost productivity, creativity, and agility.
The company is currently holding around 22% of market share in this segment according to statista. If we however factor in the market share development over the last few years, it becomes very clear that Microsoft is constantly expanding its market share in this rapid growing segment.
Worldwide Market Share of Leading Cloud Infrastructure Provider (statista.com)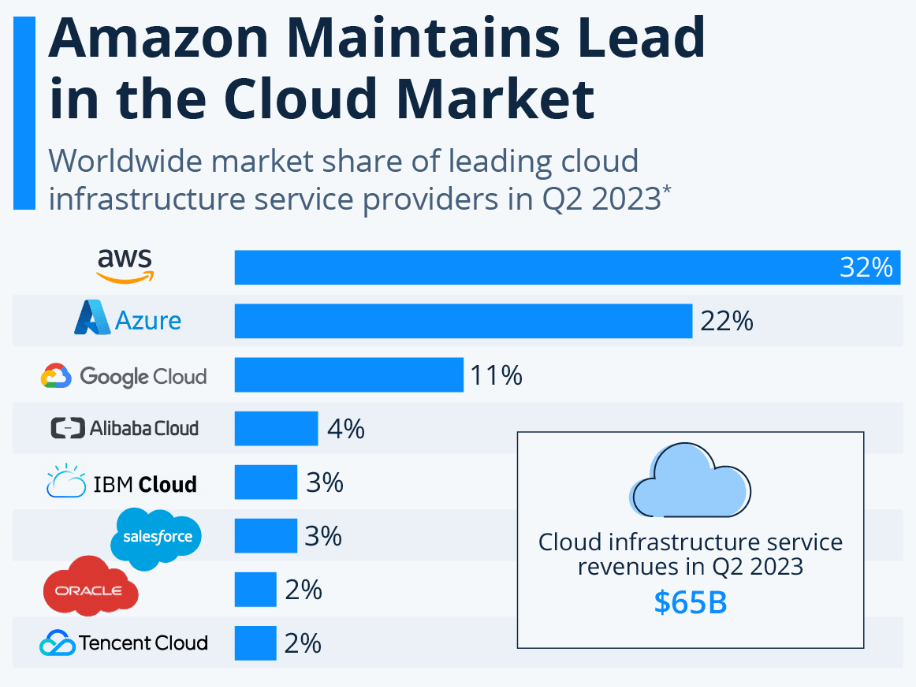
Cloud Infrastructure Services Vendor Market Share Worldwide (statista.com)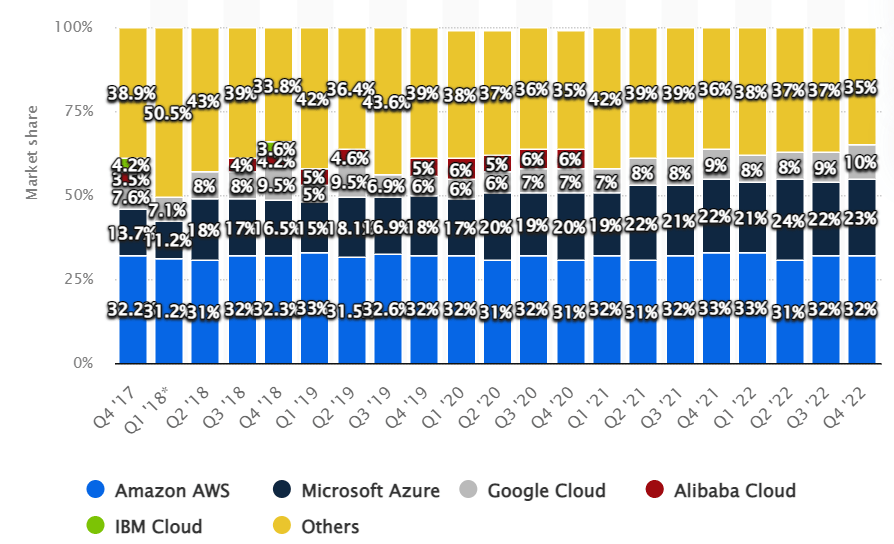
The global market for cloud computing is anticipated to expand at a compound annual growth rate of 20% between 2023 and 2030. This seems very well achievable for Microsoft if we take a look at the historical growth rates of Microsoft and the major competitors Google and Amazon (AMZN) in this segment:
| Cloud Revenue CAGR | 2018 | 2019 | 2020 | 2021 | 2022 |
| 44% | 53% | 46% | 47% | 37% | |
| Amazon | 47% | 37% | 30% | 37% | 29% |
Microsoft Azure revenue growth worldwide (statista.com)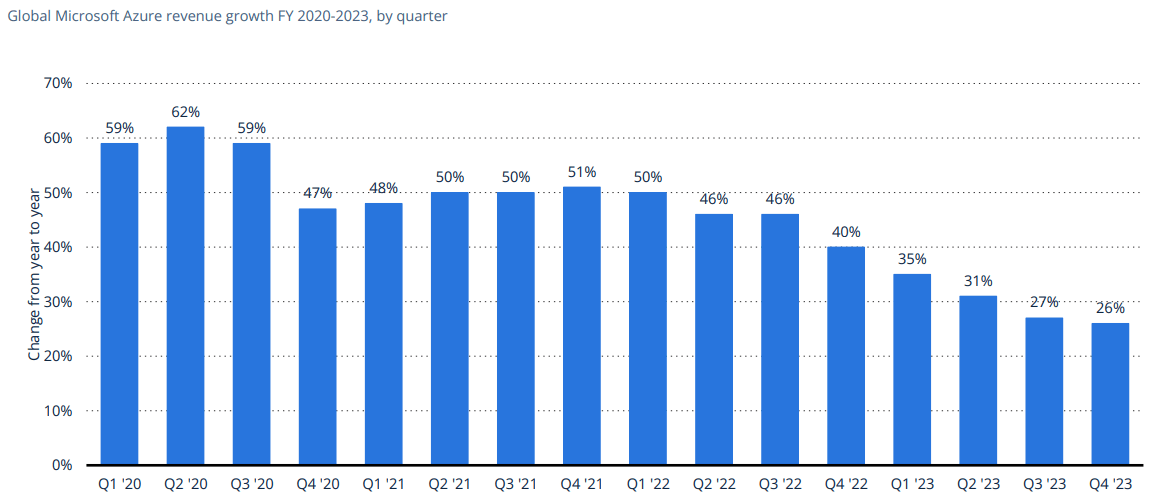
With these facts in mind, I anticipated the following growth rates for the intelligent cloud segment:
Bear: 15% p.a.
Bull: 25% p.a.
The EBIT margins of Microsoft’s Cloud were the following in the last few years:
| 2021 | 2022 | 2023 | |
| EBIT Margin | 43% | 44% | 43% |
This seems already on the high end, especially when we compare this to the cloud offering AWS from Amazon, which is currently “only” at an EBIT margin between 35% and 24% in the last few quarters. Therefore I only anticipated a slight increase for the Bull Case:
| EBIT Margin Cloud | 2023 | 2024 | 2025 | 2026 | 2027 | 2028 | 2029 | 2030 |
| Bear | 43% | 40% | 40% | 40% | 40% | 40% | 40% | 40% |
| Bull | 43% | 45% | 50% | 50% | 50% | 50% | 50% | 50% |
More Personal Computing
Windows
The biggest part of the More Personal Computing segment is Microsoft Windows, which is an operating system for personal computers created by Microsoft that offers a graphical user interface and a number of utilities. It is one of the most extensively used operating systems in the world, running a huge variety of gadgets, including tablets, servers, laptops and desktop computers.
Operating systems market share of desktop PCs 2013-2023, by month (statista.com)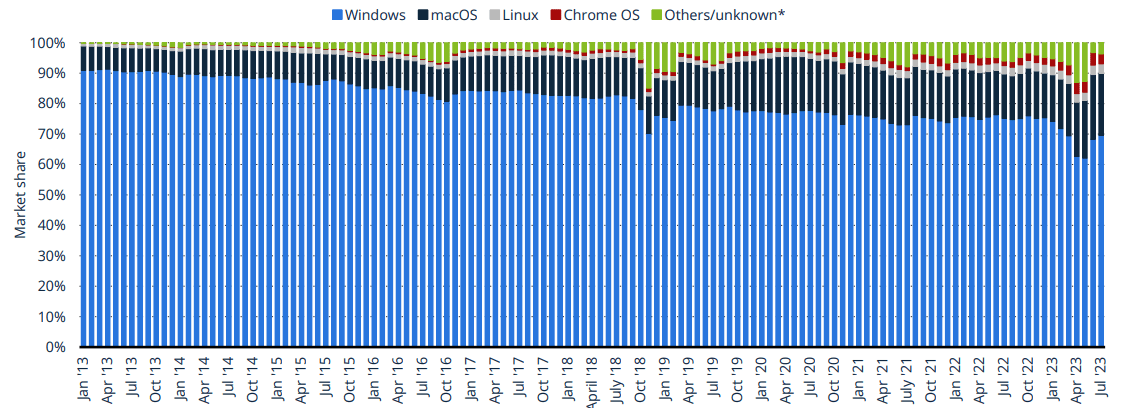
This segment seems like a very minimal growth opportunity for Microsoft, as the global personal computing market is expected to grow at only 2.3% p.a. over the next few years. To once again adjust for Bear and Bull Case, I assumed the following growth rates:
Bear: 1% p.a.
Bull: 3% p.a.
Gaming
Continuing in this segment we have the Gaming category of Microsoft. Here we have the most notably Xbox brand, which offers a range of games, gaming consoles and online services (such as Xbox Live). Xbox game consoles, including the Xbox Series X and Series S, are well-known for its multi-media features, online gaming service integration, and gaming capabilities. Microsoft is also expanding in this segment through acquisitions, like buying Mojang, ZeniMax or just recently Activision Blizzard.
Microsoft, Nintendo, and Sony global console gaming software revenue 2021-2025 (statista.com)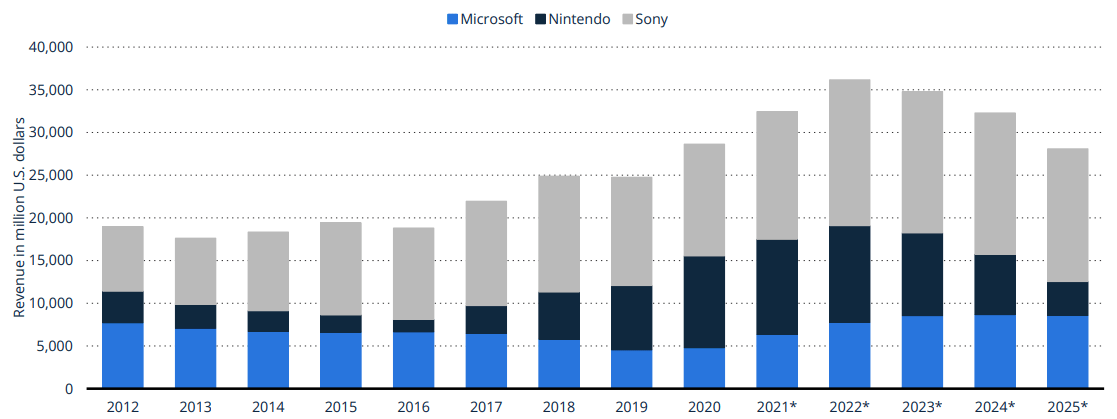
The global video games market is expected to grow at a growth rate of around 9% p.a. in the following years. To adjust for the big acquisition of Activision Blizzard I added the last TTM revenue of the company to the existing revenue of the gaming segment, which equates to right around 50% revenue growth in 2024 for this segment. From there on I assumed the following growth rates for the Bear and Bull Case scenario:
| Gaming Revenue CAGR | 2024 | 2025 | 2026 | 2027 | 2028 | 2029 | 2030 |
| Bear | 50% | 8% | 8% | 8% | 8% | 8% | 8% |
| Bull | 50% | 10% | 10% | 10% | 10% | 10% | 10% |
Search and News Advertising
Bing is one of the products and services offered by Microsoft’s Search and News Advertising division in relation to internet advertising. Microsoft Advertising allows marketers to place advertisements for their goods and services on partner websites and platforms in addition to the Bing search engine.
The general digital ad spend is predicted by experts to grow like this:
- 2024: 10.9%
- 2025: 10.0%
- 2026: 9.2%
- 2027: 8.6%
We have a clear declining trend visible here, which is why I extrapolated this linear trend to get the following growth rates for the remaining years:
- 2028: 7.8%
- 2029: 7.0%
- 2030: 6.2%
For the Bear and Bull Case, we assume growth rates 20% above/below the predicted market rates.
Devices
Microsoft manufactures a variety of hardware products, such as the Surface series of laptops, tablets, and 2-in-1 computers. Microsoft also manufactures peripherals such as mouse, keyboards and the augmented reality device HoloLens.
As mentioned above, the personal computing market is expected to grow at around 3% p.a. in the next years. I believe it is also fitting, if we assume the same growth metrics in the Devices segment as we did in the Windows segment:
Bear: 1% p.a.
Bull: 3% p.a.
The revenue in this segmented is distributed like this:
| 2023 | 2022 | 2021 | ||||
| Revenue | in % | Revenue | in % | Revenue | in % | |
| Windows | 21,507 | 39% | 24,732 | 57% | 22,488 | 58% |
| Gaming | 15,466 | 28% | 16,230 | 37% | 15,370 | 40% |
| Search and news advertising | 12,208 | 22% | 11,591 | 27% | 9,267 | 24% |
| Devices | 5,521 | 10% | 7,306 | 17% | 7,143 | 18% |
We once again us the percentage of the fiscal years 2023 of the revenue as a weighting, to calculate the anticipated revenue growth rate for the whole More Personal Computing segment.
| Revenue CAGR BEAR | Weighting | 2024 | 2025 | 2026 | 2027 | 2028 | 2029 | 2030 |
| Windows | 39% | 1% | 1% | 1% | 1% | 1% | 1% | 1% |
| Gaming | 28% | 50% | 8% | 8% | 8% | 8% | 8% | 8% |
| Search and news advertising | 22% | 8,7% | 8,0% | 7,4% | 6,9% | 6,2% | 5,6% | 5,0% |
| Devices | 10% | 1% | 1% | 1% | 1% | 1% | 1% | 1% |
| More Personal Computing | 100% | 16,4% | 4,5% | 4,3% | 4,2% | 4,1% | 4,0% | 3,8% |
| Revenue CAGR BULL | Weighting | 2024 | 2025 | 2026 | 2027 | 2028 | 2029 | 2030 |
| Windows | 39% | 3% | 3% | 3% | 3% | 3% | 3% | 3% |
| Gaming | 28% | 50% | 10% | 10% | 10% | 10% | 10% | 10% |
| Search and news advertising | 22% | 13,1% | 12% | 11% | 10,3% | 9,4% | 8,4% | 7,4% |
| Devices | 10% | 3% | 3% | 3% | 3% | 3% | 3% | 3% |
| More Personal Computing | 100% | 18,3% | 6,9% | 6,7% | 6,5% | 6,3% | 6,1% | 5,9% |
If we now take a look at the margins of the last three years in this segment, I believe the following assumptions seem fitting:
| More Personal Computing | 2021 | 2022 | 2023 |
| EBIT Margin | 36% | 34% | 30% |
| EBIT Margin More PC | 2023 | 2024 | 2025 | 2026 | 2027 | 2028 | 2029 | 2030 |
| Bear | 30% | 25% | 25% | 25% | 25% | 25% | 25% | 25% |
| Bull | 30% | 35% | 35% | 35% | 35% | 35% | 35% | 35% |
Discounted Cash Flow Analysis
We now have estimates for Microsoft’s sales and profit margins for every significant business sector for the years 2024 to 2030; nevertheless, a few more suppositions are required before we can fully evaluate the firm:
- Tax Rate: I averaged out the last three years and used 15%.
- Free Cash Flow Conversion: I calculated the EBIAT for each year with the above mentioned tax rate and then determined a suitable EBIAT to Free Cash Flow Ratio.
- WACC: For the Weighted Average Cost of Capital, I used 8.5%, which is right around MSFT’s current metric.
- Perpetuity Growth Rate: Here I used a reasonably conservative 3.5%.
Bear Case
I have summarized the main assumptions on margins and revenues here:
Revenue And Margin Assumptions Bear (own assumptions) Discounted Cash Flow Analysis Bear I (own assumptions, microsoft.com, seekingalpha.com) Discounted Cash Flow Analysis Bear II (own assumptions, microsoft.com, seekingalpha.com)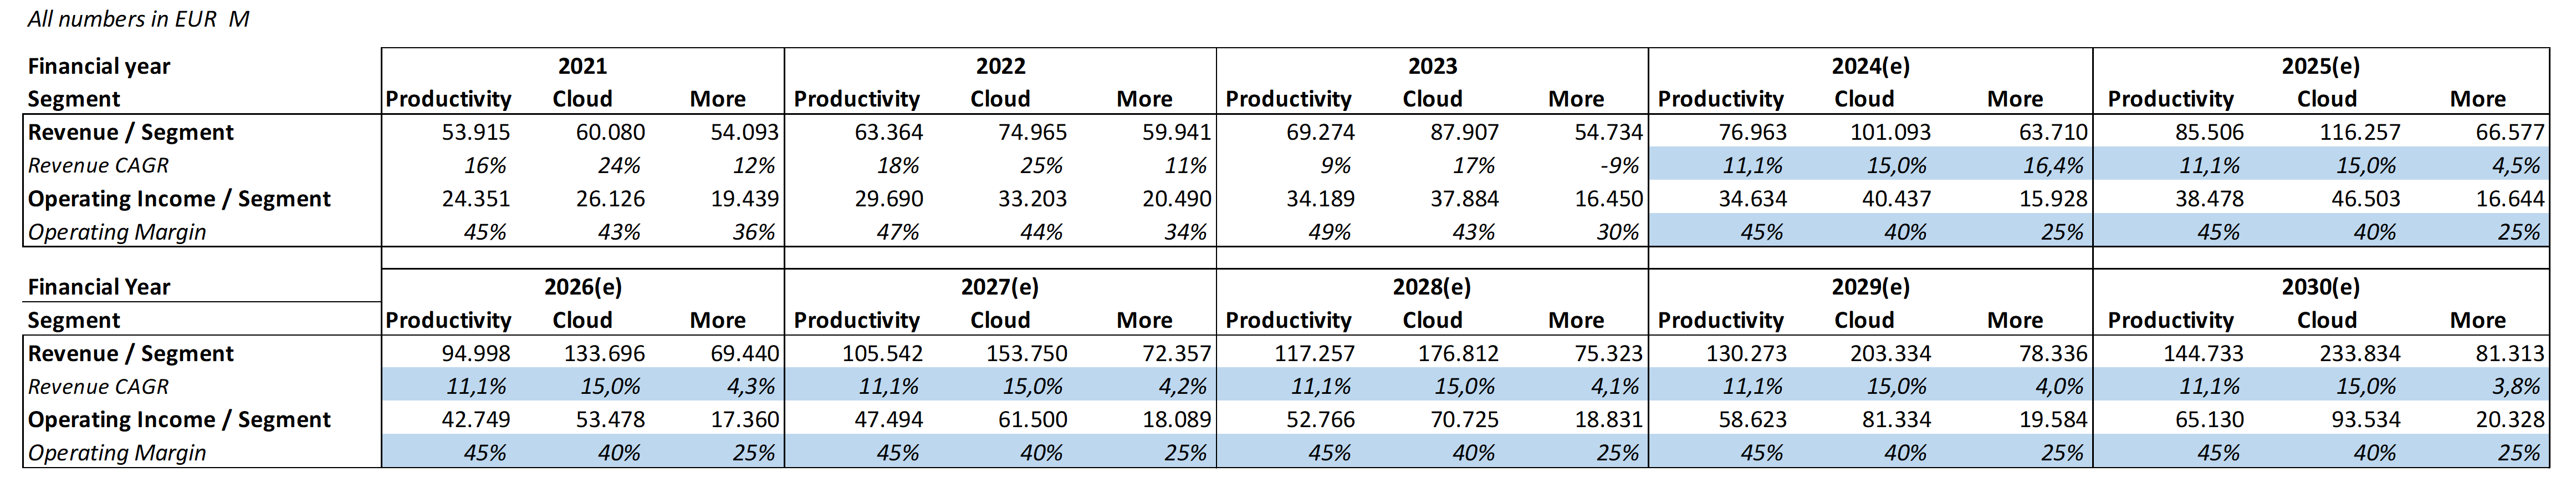
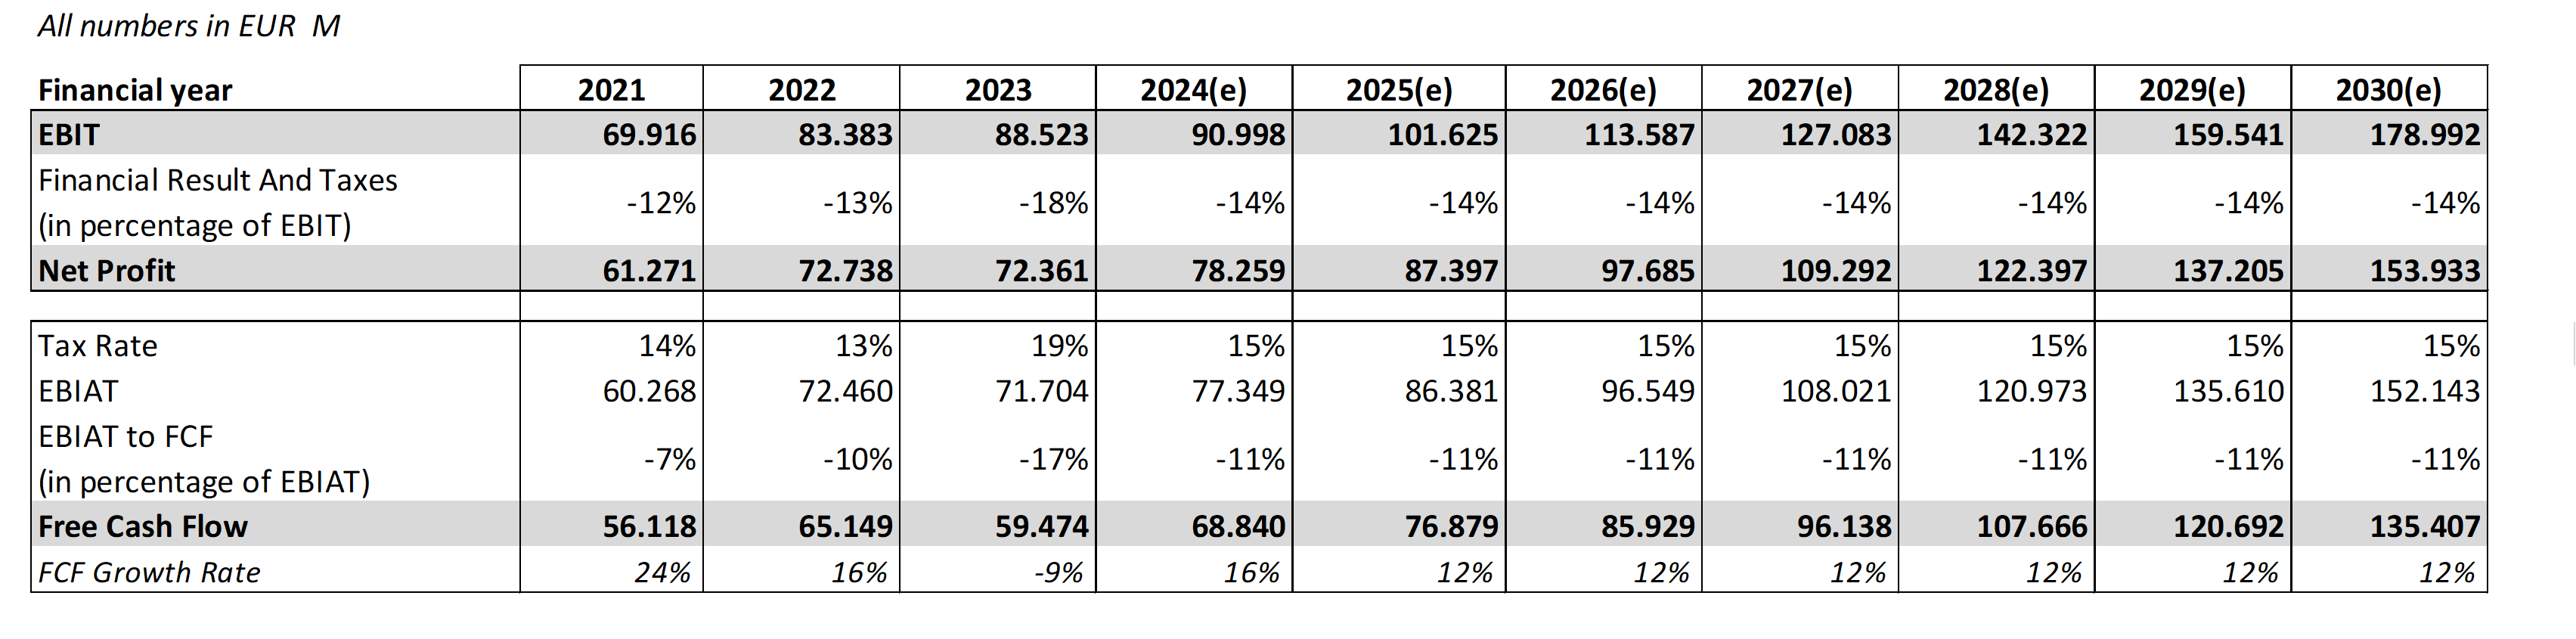
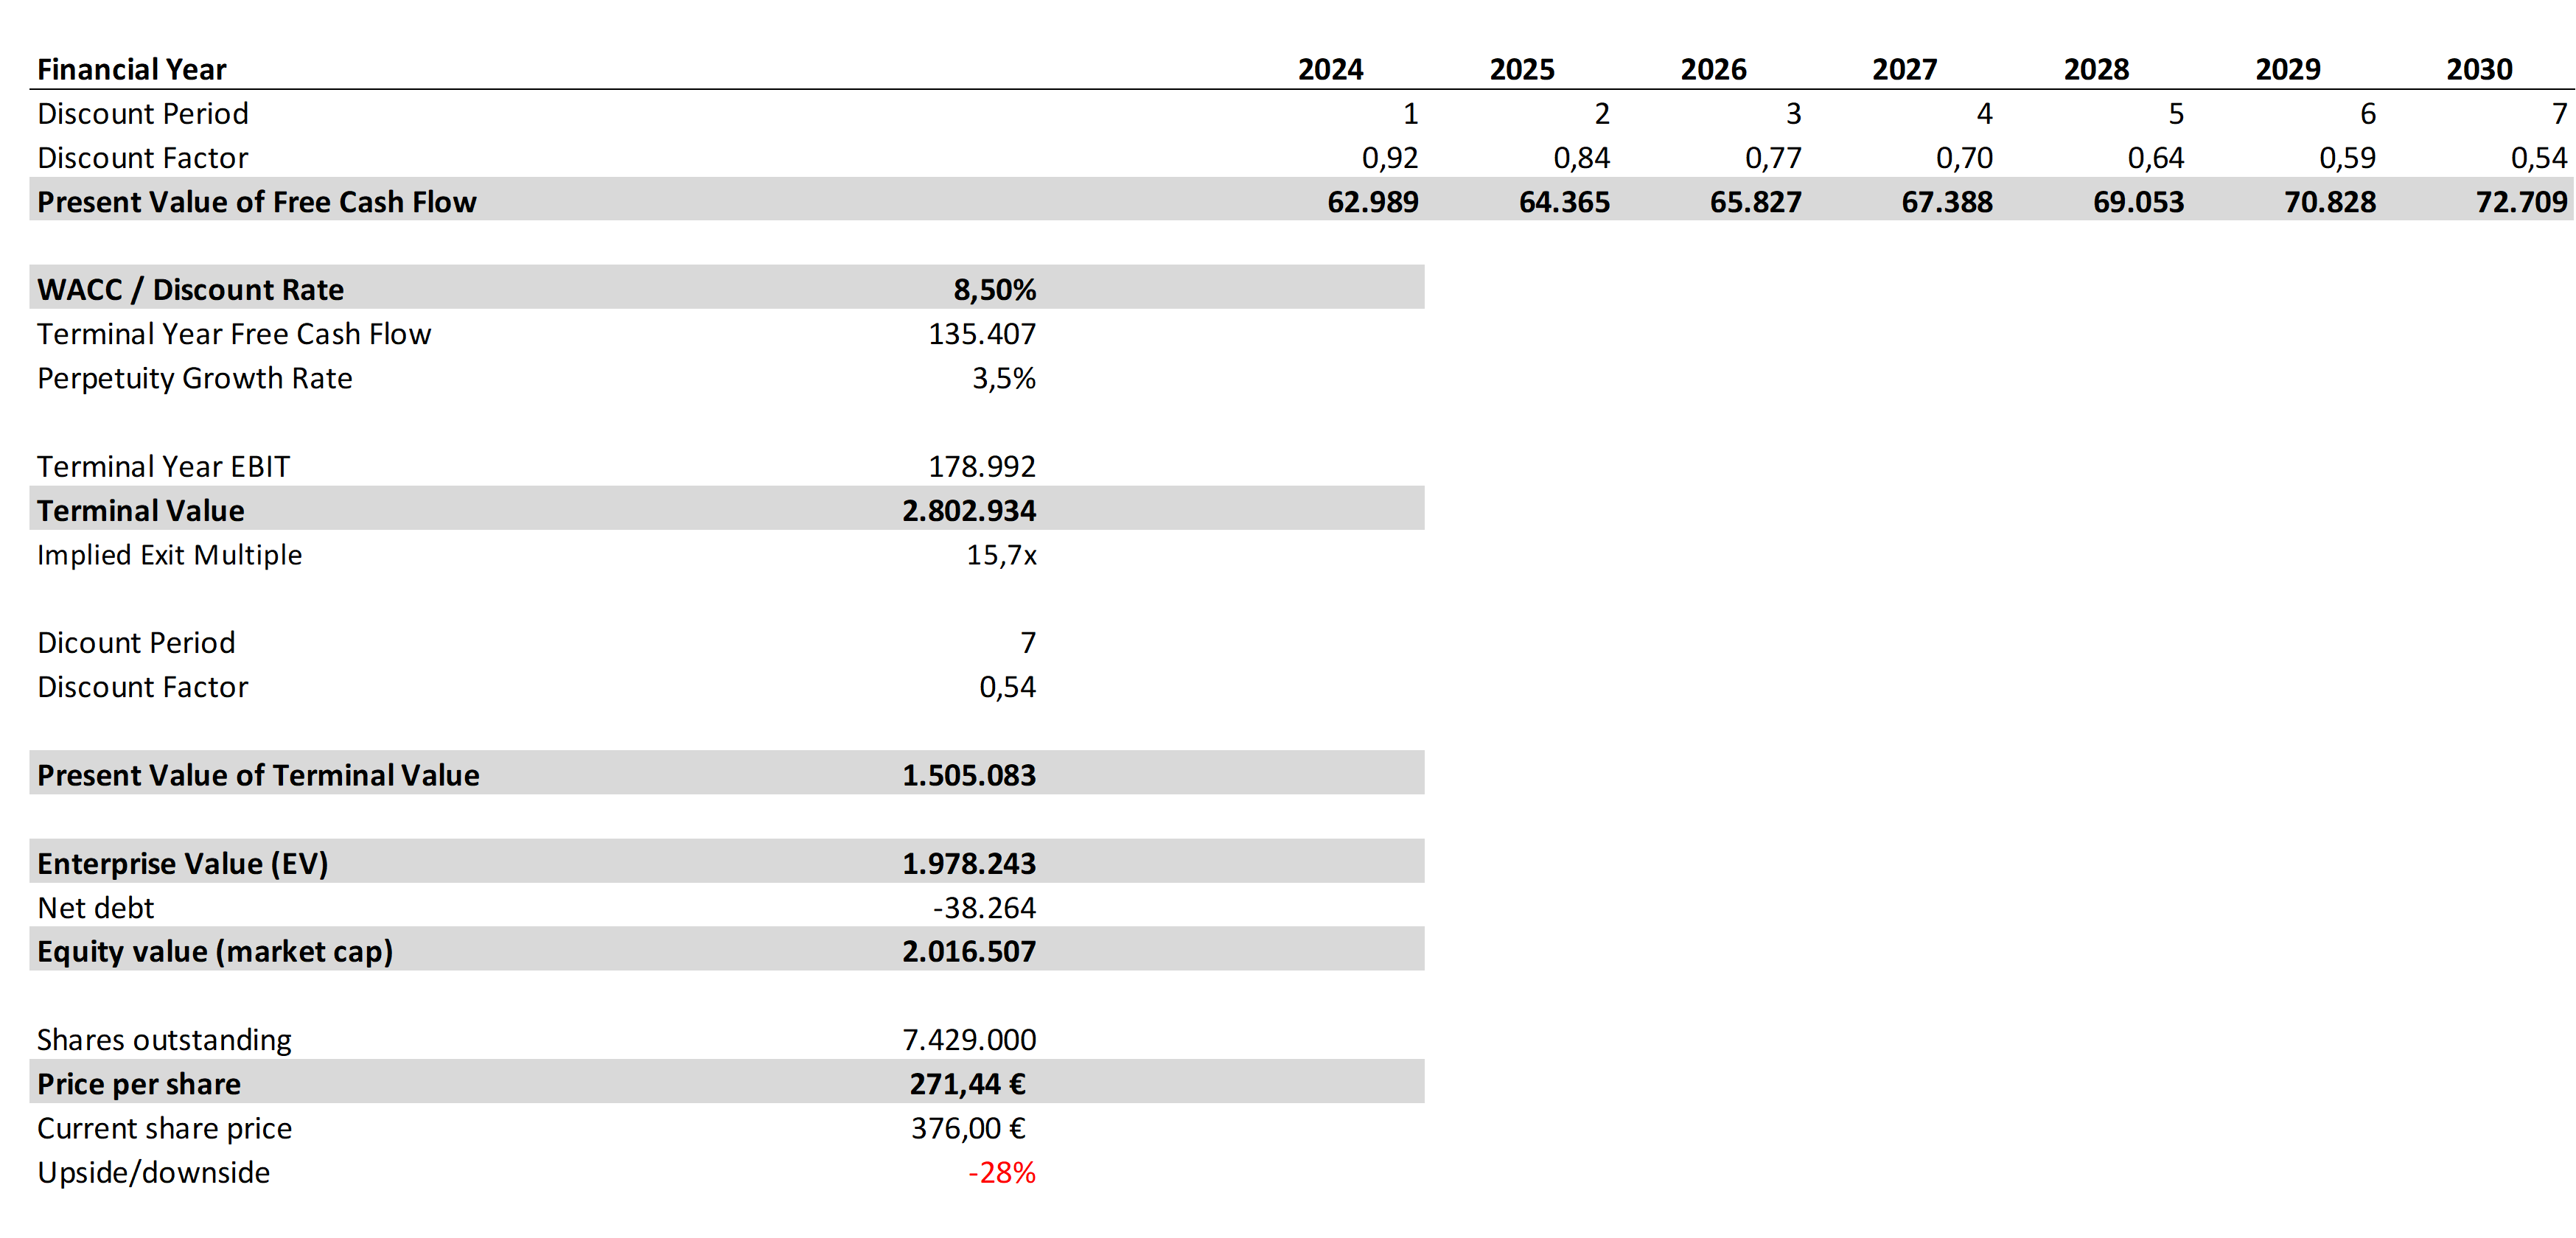
In this scenario we get a fair value share price of ~$271, indicating that the company could be overvalued by up to 28%. Note that this is the share price one should pay, if they believe the Bear Case will come to fruition. This scenario however includes worse growth than the market rate as well as below historical profitability margins.
Bull-Case
Again the main assumptions summarized for this scenario:
Revenue And Margin Assumptions Bear (own assumptions) Discounted Cash Flow Analysis Bull I (own assumptions, microsoft.com, seekingalpha.com) Discounted Cash Flow Analysis Bull II (own assumptions, microsoft.com, seekingalpha.com)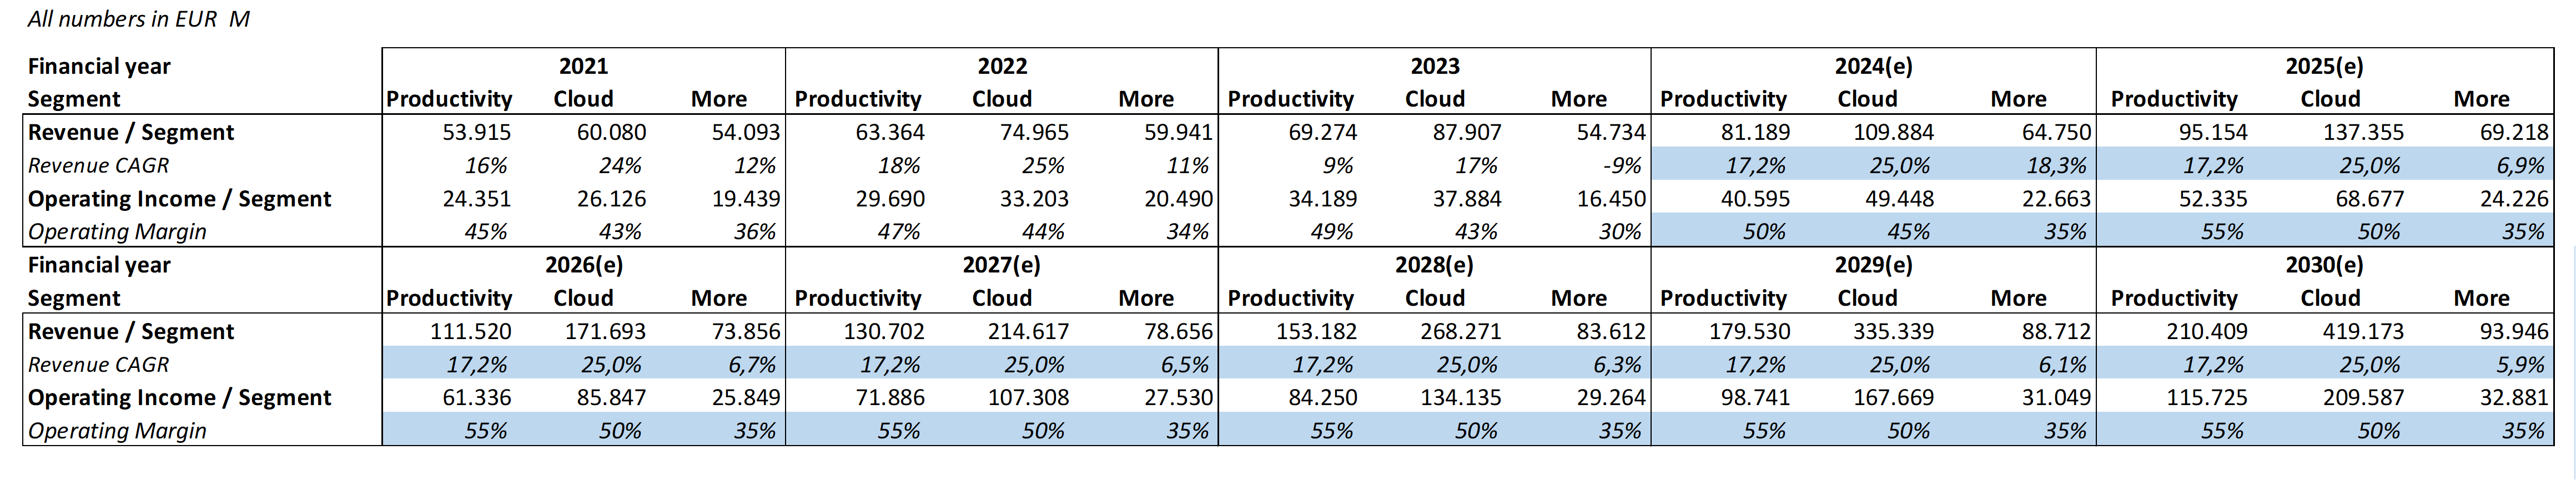
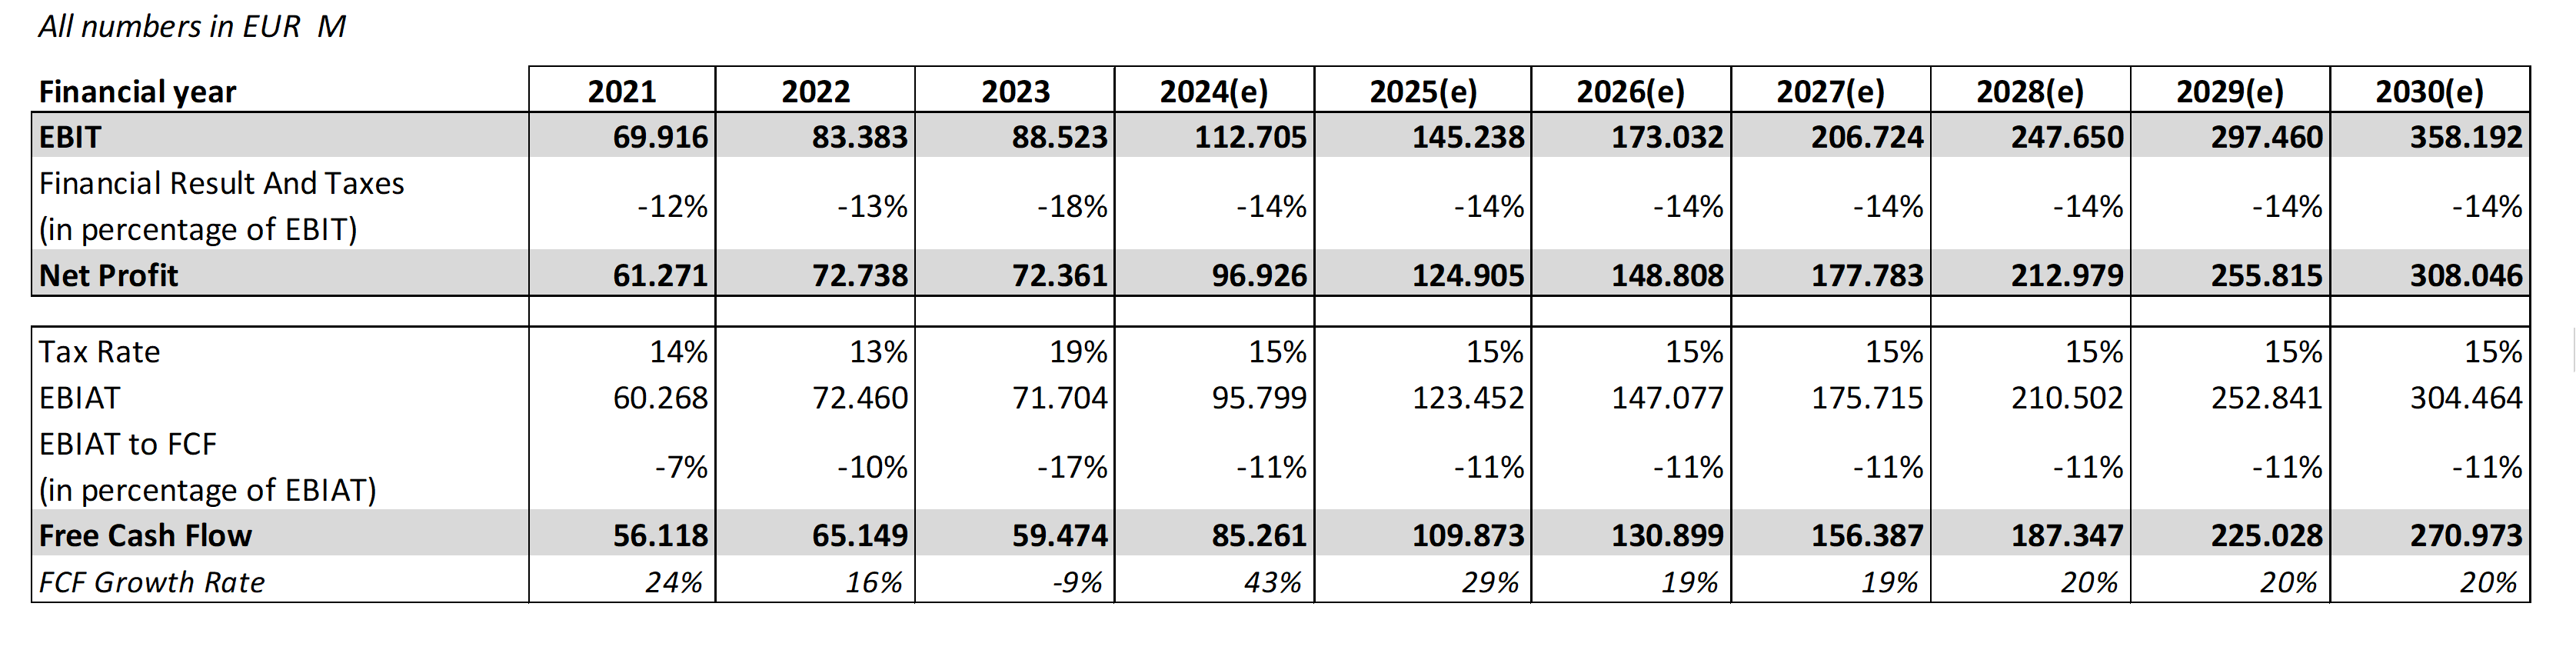
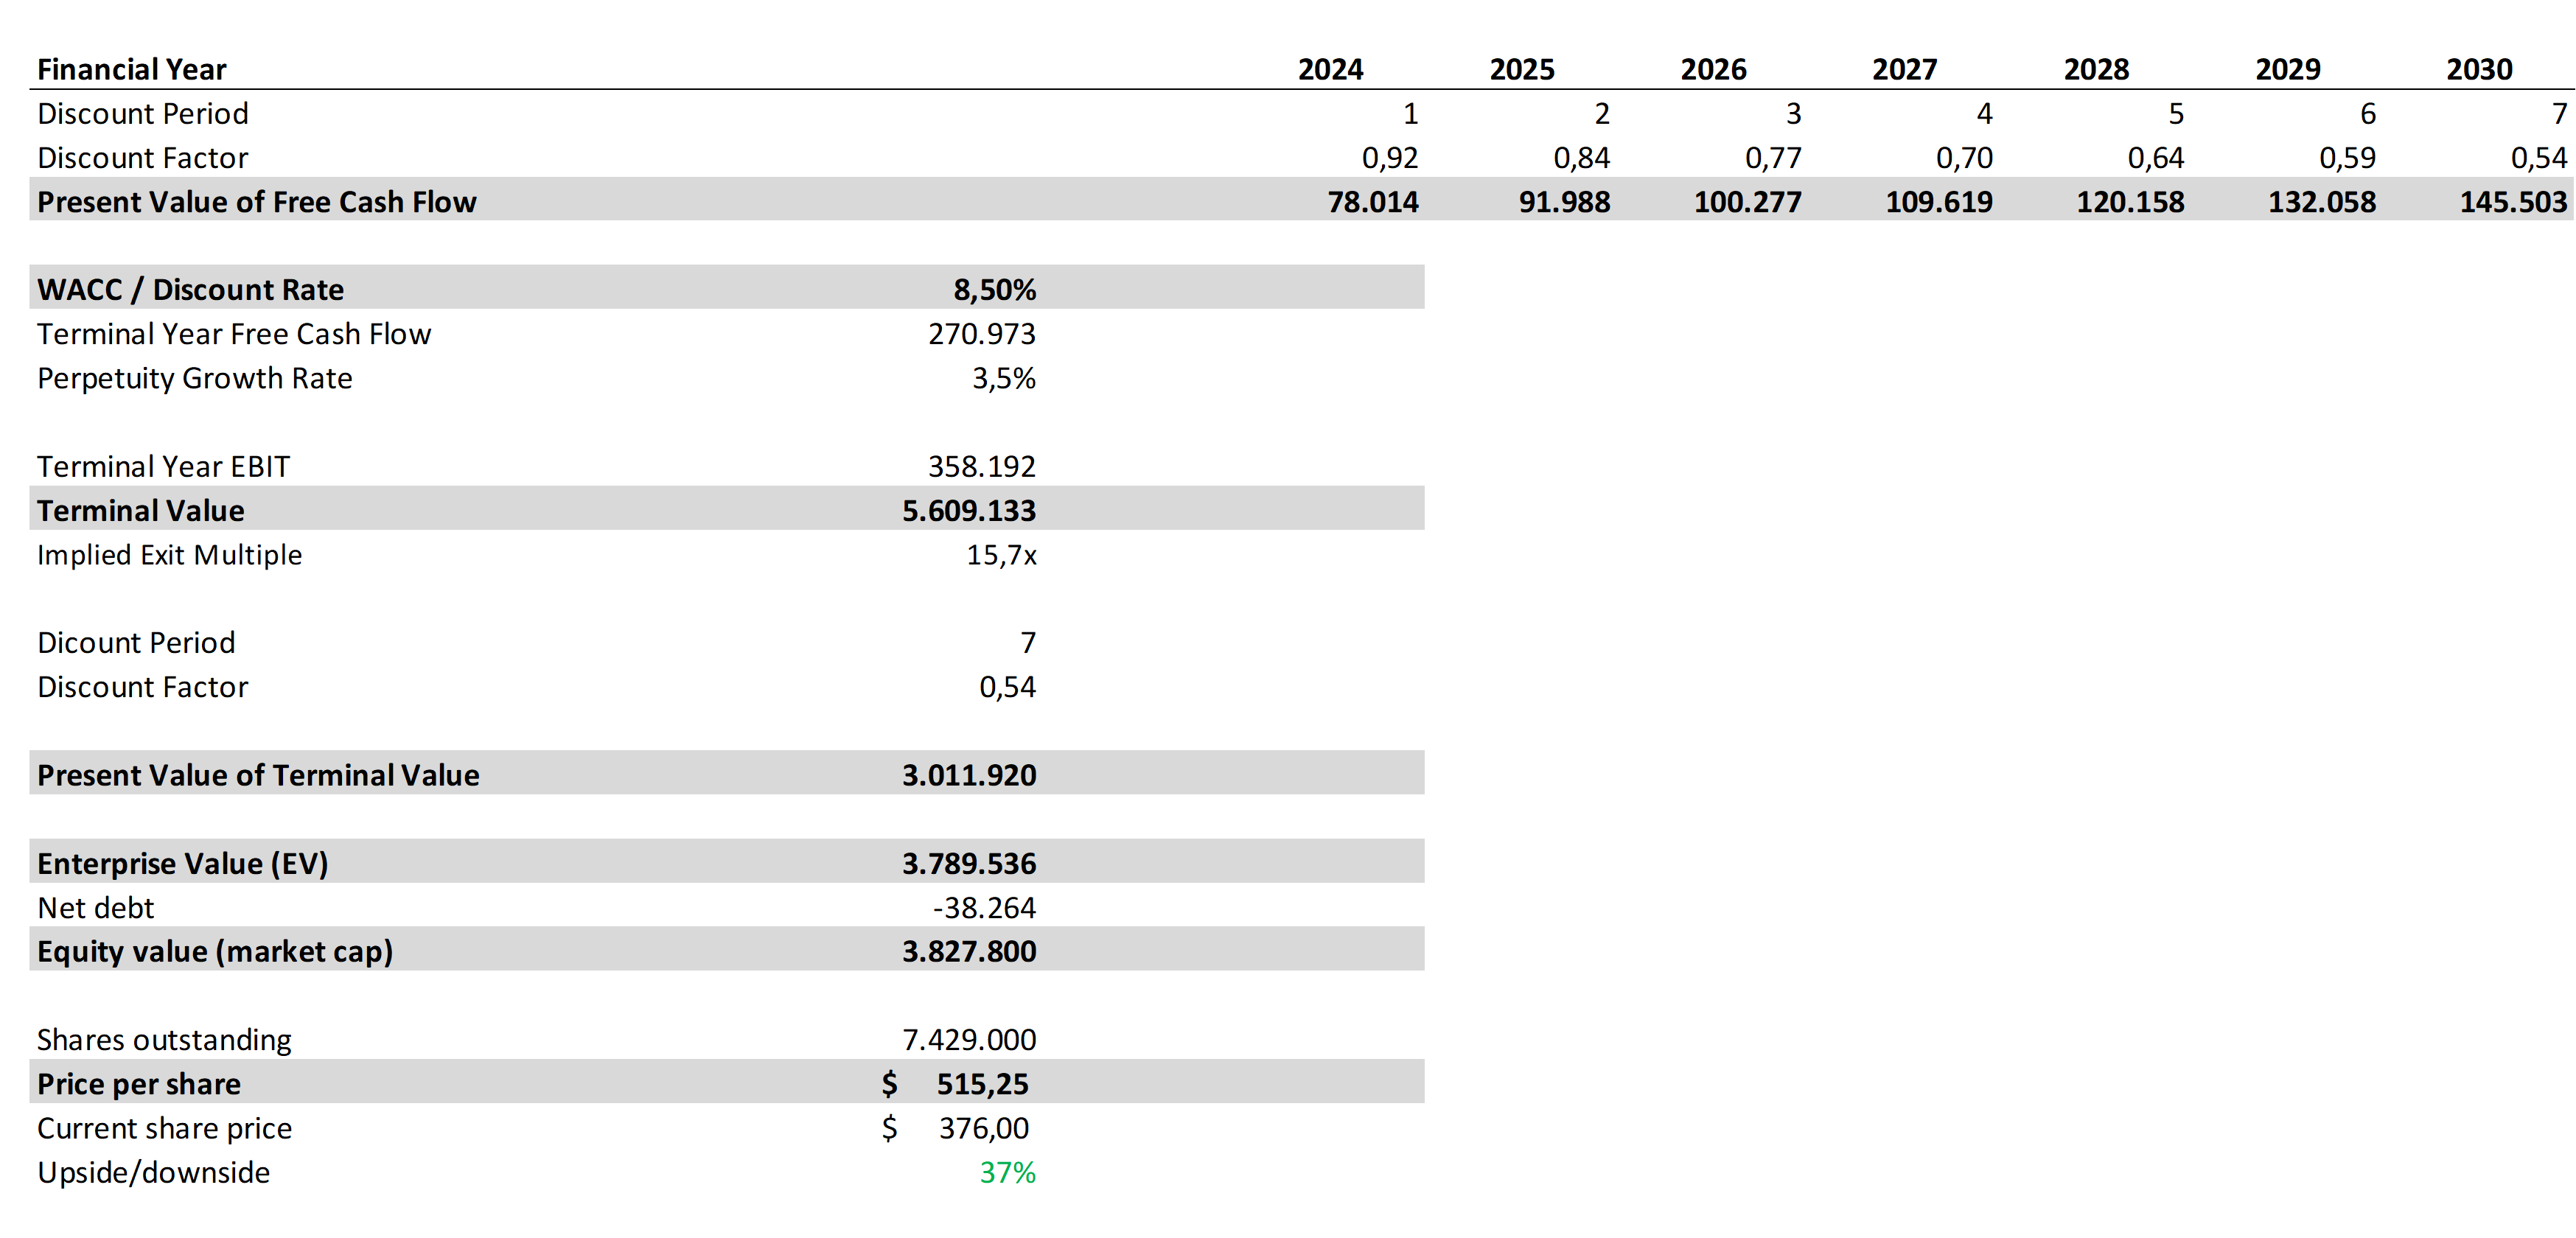
In our Bull Case scenario, we get a fair value share price of $515, which would translate in an undervaluation of up to 37%. However just like the Bear Case anticipated below average metrics for MSFT’s future, the assumptions in the Bull Case are rather optimistic and include higher than market growth rates as well as improvements in the different margins of each segment.
Conclusion
With our Bear and Bull Case scenario, the company is currently miss-priced by -28% to 37%, indicating that even after the recent Bull-Run the company somewhat trades in the fair value territory.
I believe that the assumptions we took, were pretty conservative and realistic and the current price can still be a solid entry point for investors that want to build a position in this very high quality company. This is why I currently rate the company a ‘Buy’, with a short-term price target of $400.
For the ones that already own the company – just like myself – I would wait for a slight decline to extend the position or in the meantime look for other opportunities. In my last article, I explained how Amazon could be such an opportunity right now.
Editor’s Note: This article was submitted as part of Seeking Alpha’s Top 2024 Long/Short Pick investment competition, which runs through December 31. With cash prizes, this competition — open to all contributors — is one you don’t want to miss. If you are interested in becoming a contributor and taking part in the competition, click here to find out more and submit your article today!
Analyst’s Disclosure: I/we have a beneficial long position in the shares of MSFT either through stock ownership, options, or other derivatives. I wrote this article myself, and it expresses my own opinions. I am not receiving compensation for it (other than from Seeking Alpha). I have no business relationship with any company whose stock is mentioned in this article.
Seeking Alpha’s Disclosure: Past performance is no guarantee of future results. No recommendation or advice is being given as to whether any investment is suitable for a particular investor. Any views or opinions expressed above may not reflect those of Seeking Alpha as a whole. Seeking Alpha is not a licensed securities dealer, broker or US investment adviser or investment bank. Our analysts are third party authors that include both professional investors and individual investors who may not be licensed or certified by any institute or regulatory body.