Summary:
- 23 companies are valuated based on Historical and Future Fair Value valuation methods. Additionally, they are analyzed for projected growth rates, dividend growth, and current yield.
- Apple and Microsoft are chosen for comparison, potentially representing the best of the best from a high-quality dividend growth perspective.
- Microsoft’s current valuation appears more attractive than Apple’s; however, both candidates are exceptional options for long-term investment and dividend growth.
- Qualcomm, Merck, UPS, Cisco, BlackRock, Home Depot, Texas Instruments, Fastenal, and Automatic Data Processing are also flagged as interesting candidates for potential current investment.

Artur Didyk
Introduction and Background
What to do? The market of high-quality dividend growers does not appear to be particularly, attractively valued at present, yet I know that I am terrible at timing the market, still working on my future prediction skills, and have money that I would like to invest to help fund my future early retirement. As I discussed previously, I have regular income that I set aside for early retirement investment but am also in the process of converting several mutual funds in my 401(k) into dividend growth investments.
Dollar cost averaging into high quality investments has worked well for me over the years. If I buy high, and the stock goes down, I rejoice in the new sale price, buying more with even more confidence (at least that’s what I tell myself). If I buy low, even if it appears over-valued, of course, I pat myself on the back for my prescience. Over the long term, regardless of the scenario, this has worked well, and is what I am considering falling back on given the current valuations.
To do this, I am going to look at what I consider to be the highest quality dividend growth stocks on my watchlist. Those companies that I just want to have ownership of over the long term because of the strong conviction that I have in them. The only real filtering I’ll do to my watchlist from there is to look at those companies with the strongest S&P and Moody’s credit ratings (A and A2 or better) and Value Line financial strength rating of A+ or better. The idea is that these are truly the best of the best companies, that should perform well long-term, even if the valuations aren’t bargains right now.
Using this first pass criteria, we will be looking at the following list of companies:

Finbox, Seeking Alpha, Author’s Analysis

Finbox, Seeking Alpha, Author’s Analysis

Finbox, Seeking Alpha, Author’s Analysis
Fair Value Estimation
Now, even though I’ve already said that valuations are high, let’s go ahead and look at my recently updated valuations for these stocks.
As I’ve described in previous articles, I like to calculate a fair value in two ways, using a Historical fair value estimation, and a Future fair value estimation. The Historical Fair Value is simply based on historical valuations. I compare 5-year average: dividend yield, P/E ratio, Schiller P/E ratio, P/Book, and P/FCF to the current values and calculate a composite value based on the historical averages. This gives an estimate of the value assuming the stock continues to perform as it has historically. I also want to understand how the stock is likely to perform in the future so utilize the Finbox fair value calculated from their modeling, a Cap10 valuation model, FCF Payback Time valuation model, and 10-year earnings rate of return valuation model to determine a composite Future Fair Value estimate.
I also gather a composite target price from multiple analysts including Reuters, Morningstar, Value Line, Finbox, Morgan Stanley, and Argus. I like to see how the current price compares to analyst estimates as another data point, and as somewhat of a sanity check to my own estimates.
Plotting three variables on one plot is tricky but using a bubble plot allows us to visualize three variables by plotting the Historical fair value versus the Future Fair Value on a standard x-y chart, and then use bubbles to represent the size of discount relative to analyst estimates.
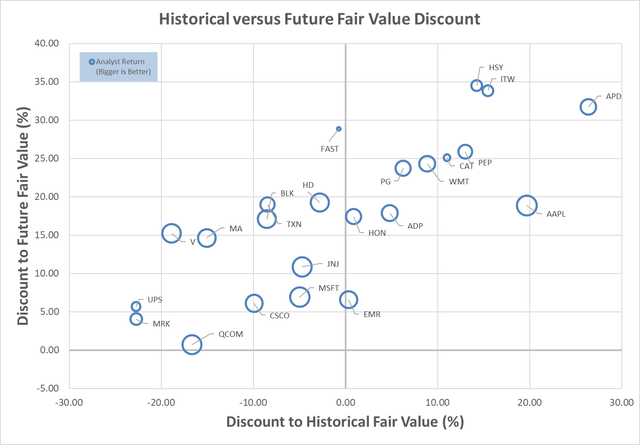
Author calculation of Historical and Future Fair Value, analyst estimates
This chart is insightful once you understand how to interpret it. What we are looking for are stocks that are trading at a discount to both the Historical Fair Value and the Future Fair Value. So, those stocks that are farther to the left, and farther to the bottom, are potentially the stocks trading at the largest discount to fair value. This would be the bottom left quadrant of the graph. Additionally, those stocks with the biggest bubbles are the stocks that are trading at the largest discount to analyst estimates, so in theory, stocks in the lower left quadrant that also have large bubbles, should be very decent candidates for investment.
Digging into this chart suggests that no companies are currently trading at a discount to both Historical and Future Fair Values, however, Qualcomm (QCOM), Merck (MRK), United Parcel Service (UPS), Cisco (CSCO), and Microsoft (NASDAQ:MSFT) are attractively valued from a Historical perspective, and only appear marginally overvalued from a Future Fair Value perspective.
I have recently written in-depth articles about Qualcomm here and Microsoft here, which I believe are both still relevant. I have also continued to invest in both of those companies.
Since we are not primarily concerned with valuation for this particular investigation, I want to look at another view that I also find interesting. The projected growth is a composite growth estimate based on historical and future growth metrics including: 5-year average EBITDA growth, EBITDA 5-year growth forecast, 5-year average dividend growth, 5-year change in shares outstanding, Analyst long term earnings growth forecasts, Forward Rate of Return forecast, and Net Income to Shareholder growth rate. I realize that this is quite the assortment of inputs, but all of them are indicators of future dividend growth and sustainability.
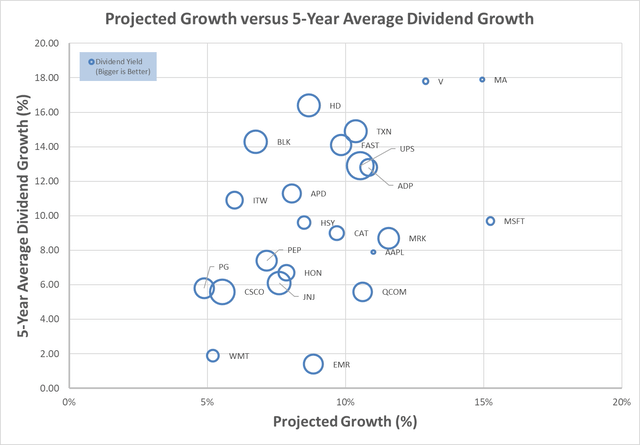
Finbox, Author’s Analysis
To keep you on your toes, with this chart, we now want to look at the upper-right quadrant. We are looking for those companies that have the desirable combination of high dividend growth and high projected growth, so those farthest up and to the right. Additionally, the size of the bubble shows the relative current yield, with the larger bubbles belonging to companies with higher current yields. It isn’t a real surprise that many companies with the highest growth also have the lowest current yields, and lower growth companies are showing higher current yields. Companies that don’t fit this trend could potentially be over-valued (too small of a yield for the projected growth), companies that don’t really focus on their dividend, or companies that are currently undervalued (high growth coupled with high yield).
From this chart companies like BlackRock (BLK), Home Depot (HD), Texas Instruments (TXN), Fastenal (FAST), United Parcel Service, Automatic Data Processing (ADP), Merck, and Microsoft look interesting.
Even though there are not any stocks that appear to be trading at exceptional value, there is still a lot of quality to be had that will likely perform well, long term, and produce reliable, increasing streams of income.
Since I am not overly concerned with valuation for this article, but more concerned with quality, and long term-returns, while also building future retirement income I, selfishly, want to do a comparison that I’ve been interested in for a while. Recently, I have been investing heavily in Microsoft, and feel it is one of the highest quality companies available. It also appears to be trading at reasonable valuation. At the same time, I’ve been reading a lot of articles about one of my favorite, and most successful investments, Apple (NASDAQ:AAPL). There seems to be a lot of opinion, as there usually is, about Apple’s inevitable demise. My own analysis shows that it is likely overvalued currently, but I can’t ignore the fact that it has been a healthy multi-bagger for me, and that investments in Apple, even at high valuations, over the past few years, have produced excellent returns. So, I want to compare Microsoft to Apple. Honestly, I have no plans to sell either (I’m a committed buy and hold investor, especially when I believe in the companies), but I do want to know if I should be investing in one or the other, or both, right now.
Apple and Microsoft Preliminary Analysis
I like to start simple when analyzing companies.
Apple has a 5-year average Return on Equity of 92% and Return on Invested Capital of 35%. These are exceptional numbers. One yellow flag is that RoE is considerably higher than RoIC, which could mean that the company is using excess debt to juice RoE. However, with both values being so high, this still looks very attractive, and Apple is obviously still very financially strong.
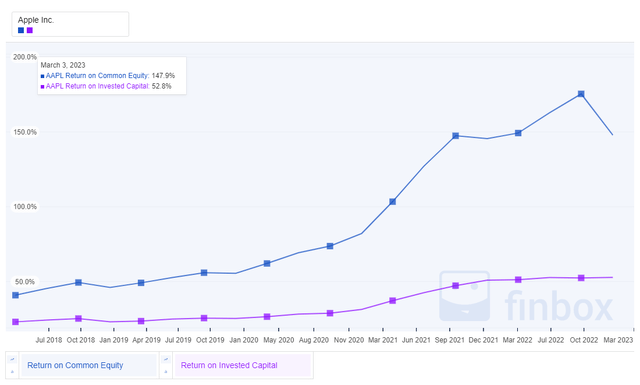
Finbox
Morningstar’s Wide Moat and Exemplary capital management ratings are excellent, and the current 3-star rating suggests the valuation isn’t extreme. Now, looking at the dividend, Apple’s 16% Earnings-based payout ratio and 15% Free Cash Flow-based payout ratios suggest the dividend is very comfortably covered and sustainable.
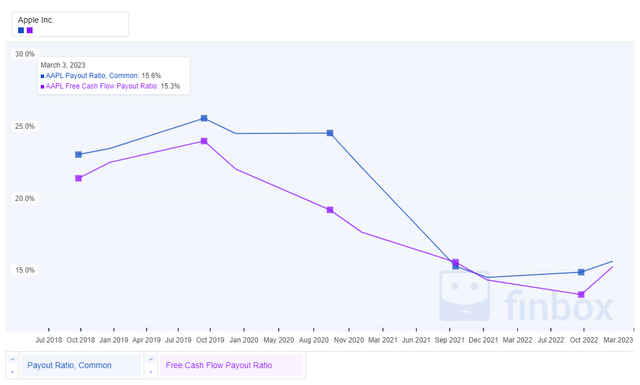
Finbox
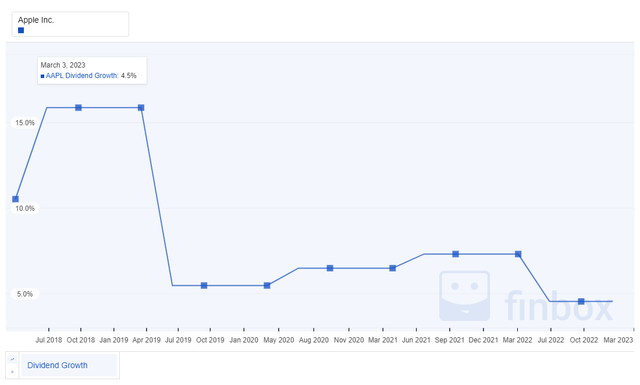
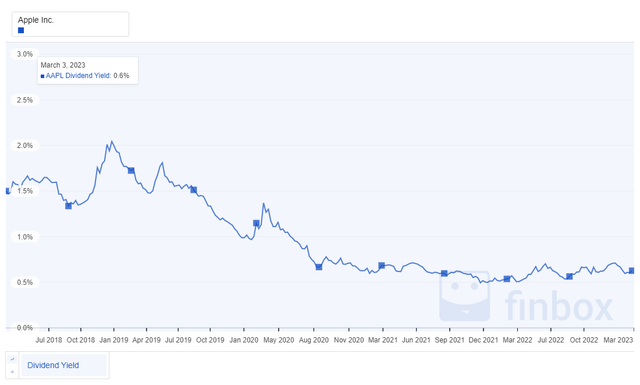
The 5-year dividend growth rate of close to 8% feels very conservative, the starting yield of 0.6% is low, and it will take a lot of compounding to overcome the low initial yield. With my estimated growth rate for Apple being above the dividend growth rate, I feel this is a very safe investment option for the dividend growth investor.
Finbox
Finbox
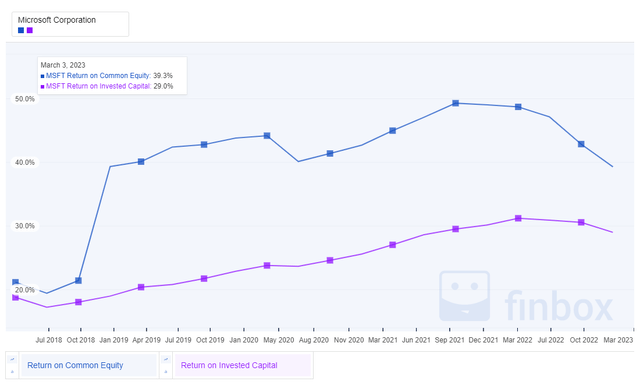
Microsoft has a 5-year average Return on Equity of 40% and Return on Invested Capital of 25%. These are also very good numbers, but lower than Apple’s. In this case, ROE and ROIC are much closer together, potentially signifying less leverage usage.
Finbox
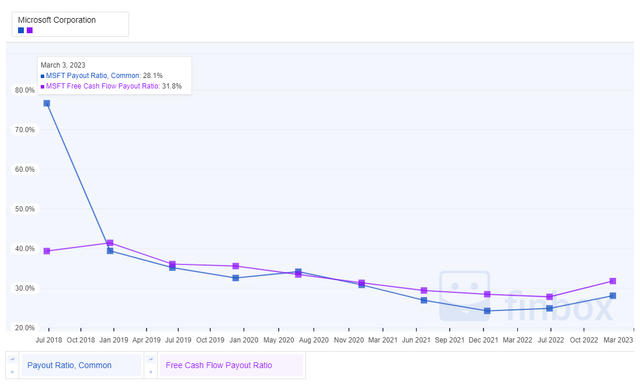
Microsoft also has Morningstar Wide Moat and Exemplary capital management ratings, and the current 4-star rating suggests the valuation is potentially still favorable. Now, looking at the dividend, Microsoft’s 30% Earnings-based payout ratio and 34% Free Cash Flow-based payout ratios suggest the dividend is very comfortably covered and sustainable, though higher than Apple’s ratios.
Finbox
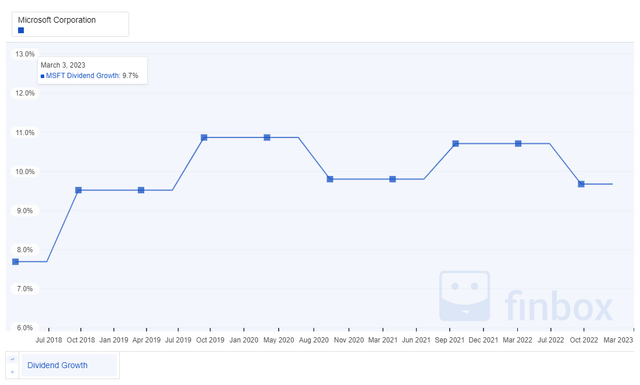
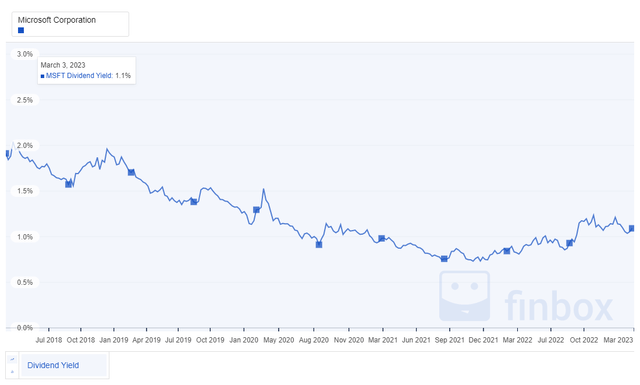
The 5-year dividend growth rate of close to 10% is a solid number, and better than Apple’s. The starting yield of 1.1% is low, but also better than Apple’s. With my estimated growth rate for Microsoft being above the dividend growth rate, I feel this is a very safe investment option for the dividend growth investor.
Finbox
Finbox
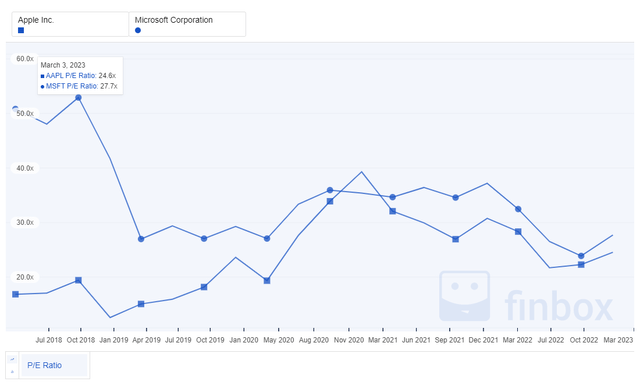
Before we move on from the initial announcement, let’s look at how the P/Es for the two companies compare between each other, and to their historical ranges.
Finbox
Apple’s P/E is currently lower than Microsoft’s. Compared to its 5-year average P/E of 23.7, it is trading at a higher value. Microsoft is trading at a discount to its 5-year average P/E of 34.5. It should be noted that Microsoft’s premium multiple seems to be coming down closer to Apple’s long-term average. Personally, I think they should likely trade at similar multiples of P/E.
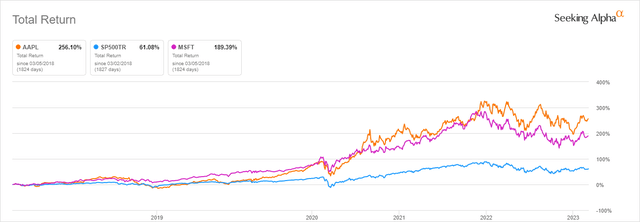
One more initial comparison, how about total return?
Seeking Alpha
Over the past 5 years, Apple has outperformed Microsoft from a total return perspective, and both have significantly outperformed the S&P 500. Given that Apple has achieved this outperformance at generally lower multiples of earnings, this is impressive.
Based on the initial assessment, it would be hard to pick between the two, so at this point, my personal answer may be to invest in both.
Next, let’s look at the Seeking Alpha Ratings summaries:
For Apple:
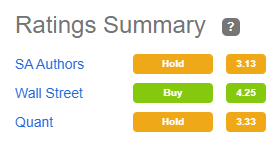
Seeking Alpha
Sentiment is not great currently for Apple. In line with many of the recent Apple analysis articles, SA Authors and Quant analysis rates it as a hold. Wall Street on the other hand, is still bullish. Personally, for long-term investment, I don’t view a hold rating as a red flag.
For Microsoft:
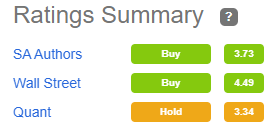
Seeking Alpha
Sentiment is better for Microsoft. SA Authors are on the weaker side of buy, and Wall Street feels even more bullish about Microsoft than Apple. Quant analysis, which I see as more short term in nature, again isn’t a red flag for me.
Based on the overall consensus, it would seem that Microsoft is more attractive currently than Apple, so would get a slightly higher weighting for current investment. Apple is more neutral, but with sufficient investment horizon, there probably isn’t a lot of difference here either.
Apple and Microsoft Future Analysis
Since, for this article, we are less concerned with valuation, and more concerned with future performance, let’s spend some time looking at how these companies are likely to perform in the future.
Looking at future Earnings Per Share projections, both companies have solid future earnings growth expectations. Potentially one of the reasons Microsoft continues to demand a P/E premium over Apple is due to the higher expected growth. I like the smoothness of both projections, and both projections suggest these companies should be able to support growing dividends.
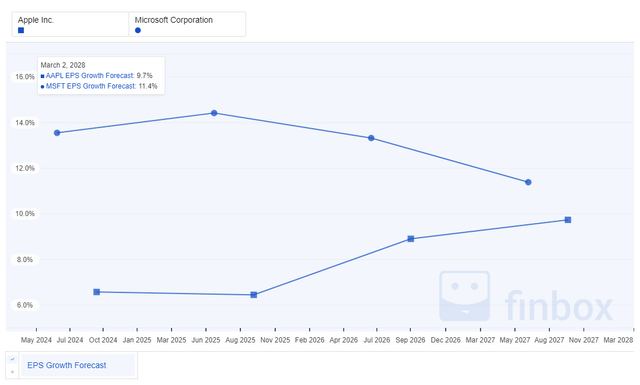
Finbox
Growth is one of the hardest things to predict in investing, otherwise, investing would be much simpler. Looking back at historical growth for both companies, they have both achieved low-double digit, consistent growth. This is another promising sign. Their growth profiles have both also been similar. So, a key question is whether Microsoft’s future predicted growth is really going to be that much higher than Apple’s. If they remain similar, it could mean that Apple is more attractively valued from a future earnings perspective than it appears.
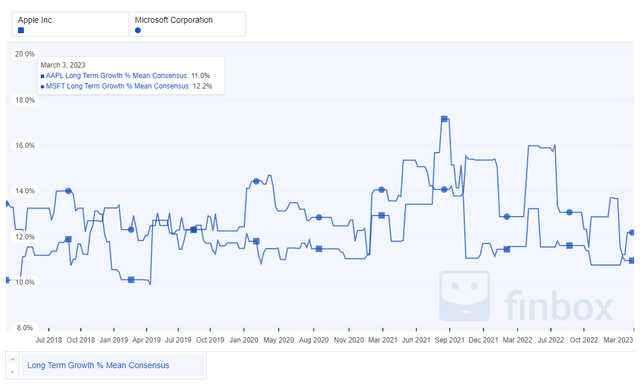
Finbox
My own estimates for growth, which I described how I arrive at earlier in the article, are for Apple at 11% and Microsoft at 15%. Those look a little optimistic compared to the projections from analysts, but are reasonable, and also do suggest that Microsoft might have a slight advantage on the growth front.
Given the strength of both companies, both past, and projected though, I am left feeling that Microsoft might have a slight advantage currently, due to valuation, but both are strong long-term investment candidates, even currently.
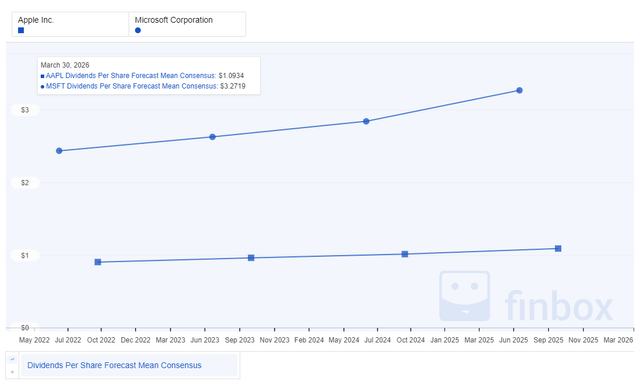
For a dividend growth investor, understanding future dividend growth potential is also important, especially in as much as it is sustainable. Here are the long-term dividend growth projections for these companies. The forecast growth looks very consistent. Microsoft could potentially increase its dividend around 25% over the next 3 years, and Apple by around 13% over the same time. To me, Microsoft’s projected increase looks more optimistic than Apple’s, but it seems safe to say that both have the capacity to continue to afford solid growth into the future.
Finbox
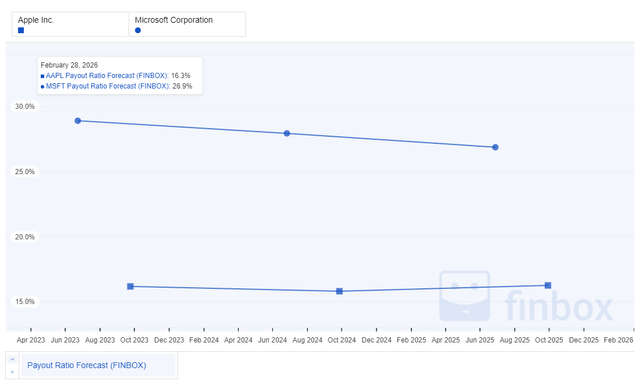
Based on this forecast, and what we’ve seen already as far as earnings growth and projected dividends, it shouldn’t come as a surprise that the earnings payout ratio is also forecast to be well controlled for the near future. The low levels of the payout ratio forecast suggest there will be room for incremental investment back into the business, increased dividend payouts beyond the forecasts, or incremental share buy-backs. All of these are positive for the investor looking for sustained dividend growth. It should also be noted that these projections expect Apple to continue to have very low payout ratios, which could also support the argument that the projected dividend growth is conservative.
Finbox
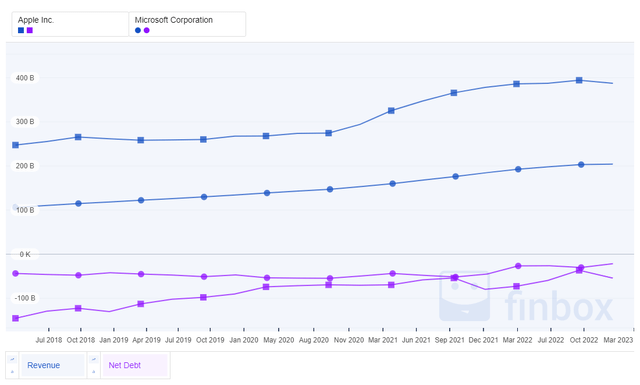
We have already established that these are some of the highest quality companies available for investment. To demonstrate that, let’s just check the revenue forecasts, and net debt situation. Both companies show strong, increasing revenue, which is also amazingly smooth, while at the same time, maintaining net negative debt positions. In our earlier discussions about the flags of using leverage because of the discrepancy between ROE and ROIC, it looks like there shouldn’t be anything to fear. These are solid companies.
Finbox
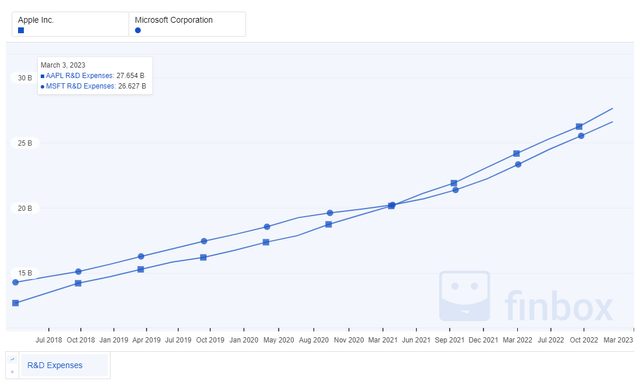
One more past metric, that I also believe portends things to come, since it shows investment that should provide future returns, is historical R&D expenses. Both companies have been increasing their R&D expenses at a similar rate. This, while maintaining strong balance sheets (net negative debt). This shows that both are generating returns that are then able to be turned around and re-invested to achieve further returns. The smoothness of this, coupled with the smoothness of the revenue, is a positive sign for both. It is interesting to note that Apple invests less than Microsoft as a percent of revenue, which is obviously why the ROE and ROIC numbers are so much higher for Apple.
Finbox
Apple and Microsoft Risks
Well, how much risk is there really when investing in some of the highest quality companies there are? Apple has an S&P credit rating of AA+ and a Moody’s rating of Aaa, with a Value Line financial strength of A++. Microsoft one-ups Microsoft with the same Moody’s and Value Line (best possible ratings), but also being one of the only companies to have a perfect AAA S&P rating.
Maybe the biggest risk to consider for both companies is just how good they are. Both have faced and are facing anti-competition pressures from various regulators. Continued scrutiny of Apple’s isolated eco-system, control over the store, and many unique services could cause problems and be a target for regulatory or business strategy disruption. Similarly, Microsoft’s dominance with Windows, on-going concerns over subscription models for the extended Office products offerings, and even the scrutiny currently being witnessed with the Activision acquisition, demonstrate potential risk. I feel like these risks are relatively low, and even if their business models do evolve over time, they are best in class for other reasons that just lack of competition. I personally feel they will adapt and excel. Plus, rarely are the final implications of regulatory actions as severe as initially predicted.
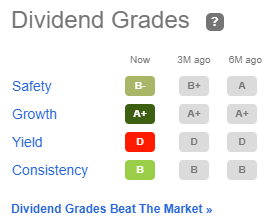
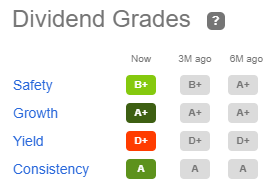
For the dividend growth investor, both appear very safe. Based on Seeking Alpha’s dividend grades, these are strong contenders. The only red flag is the low current yield that these companies offer.
For Apple:
Seeking Alpha
For Microsoft:
Seeking Alpha
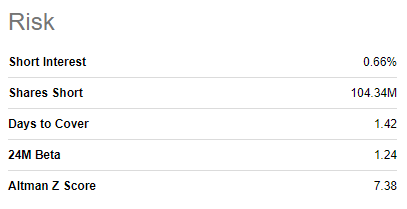
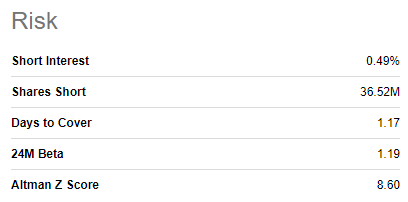
I also like to look at short-term risk indicators for any new investments, with Short Interest being one key indicator for me that I might be missing something that others might know.
For Apple:
Seeking Alpha
For Microsoft:
Seeking Alpha
Based on the very low short interest currently in both of these companies, I would not hesitate to initiate or add to my position in either.
Summary
So, what to do, where do we go from here? In my opinion, Apple and Microsoft are two of the highest quality companies that I can invest in for future returns, and dividend growth. The comparison of these two companies has not produced a clear winner in my mind. Based on the analysis completed in this article, I do believe that Microsoft is a better value currently, and that its growth prospects are maybe marginally better than Apple’s. The difference is not enough for me to dissuade investment in either, especially with a long-term focus in mind. I plan to continue to hold both, and strategically add to my positions in both over time. As to what I will do currently, I believe I likely will add to my position in Microsoft, but may wait for Apple’s valuation to change by around 10% before adding to that position. I am torn, since there aren’t a lot of other attractive prospects currently, and Apple has been my best investment since I first invested in it in 2015.
As part of the analysis, Qualcomm, Merck, United Parcel Service, Cisco, and Microsoft were also identified as being reasonably valued from a Historical and Future Fair Value perspective. I have recently written in-depth articles about Qualcomm and Microsoft, which I believe are both still relevant. Additionally, from a dividend growth, future growth, and dividend yield perspective BlackRock, Home Depot, Texas Instruments, Fastenal, Automatic Data Processing, look interesting relative to some of the other high-quality stocks investigated in this article.
Disclosure: I/we have a beneficial long position in the shares of AAPL, BLK, CAT, CSCO, MRK, MSFT, QCOM, TXN, UPS, V, WMT either through stock ownership, options, or other derivatives. I wrote this article myself, and it expresses my own opinions. I am not receiving compensation for it (other than from Seeking Alpha). I have no business relationship with any company whose stock is mentioned in this article.
