Summary:
- Stock rose 31.47% (and 75.52% since my first coverage), driven by successful strategies like password-sharing crackdown and ad-enabled tier.
- Password-sharing crackdown could yield $799M and advertisements $16.9B by 2029.
- Fair price estimated at $733.25, and future price is projected at $1,287.74. This last one implies 17.1% annual returns throughout 2029.
- Potential upside stands at 15.3%, which is not as incredible as before. Therefore, I am downgrading the stock to “buy”.
JHVEPhoto/iStock Editorial via Getty Images
Thesis
In my previous article about Netflix, Inc. (NASDAQ:NFLX) I rated the stock as a strong buy citing that its password-sharing crackdown efforts as well as the inclusion of an ads-enabled tier, will help the stock increase significantly its revenue and net income. I estimated a fair stock price of $941.8 and a future price of $1,466.88 for 2028.
Since then, the stock has increased by 31.47% thanks to its beat in Q4 2023 (report released on January 23), where it added nearly 13.12M new subscribers, and non-GAAP EPS beat by 9.24%. However, the overall increase since my first article on Netflix has been 75.52%.
In this article, I will update my models according to how the situation of the password-sharing crackdown and adoption of the ad-enabled plan has been going.
After reevaluating Netflix, I concluded that the stock was no longer a “strong buy” because the potential upside to be realized is (according to my estimates) around 15.3%, which implies a fair stock price of $737.25. Then the estimated future price is around $1,287.74, which translates into 17.1% annual returns throughout 2029. For this reason, I am downgrading Netflix to “buy”.
Seeking Alpha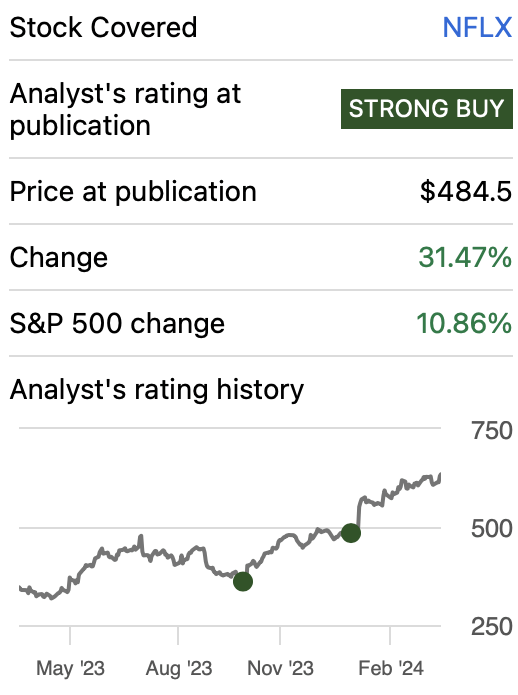
Overview
Netflix’s Growth Plan
Netflix’s plan to boost earnings is cracking down on password sharing which is estimated to be affecting around 100 million passwords. It’s important to mention that password sharing does not only include two individuals, but it could be three, four, etc. If we assume the password-sharing is with only an additional person. This means that Netflix, by charging $7.99 per additional non-household member, could potentially generate $799M.
Then, as a complement to this password-sharing crackdown, Netflix created an ad-enabled tier that costs around $6.99 per month. This ad tier can potentially generate a lot of additional revenues and net income as I will explain in the valuation section.
How does Netflix compare against Peers?
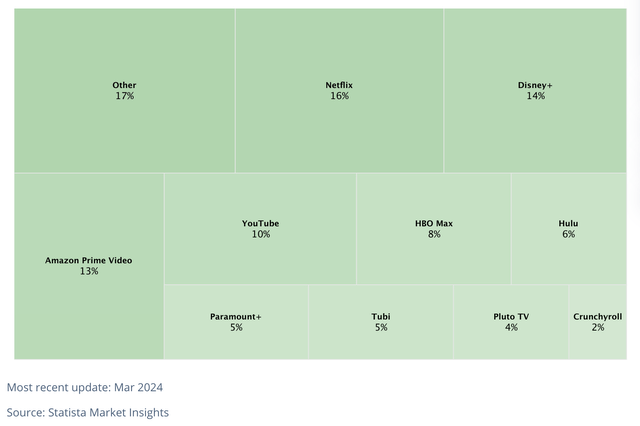
Netflix was a pioneer in streaming and this dominance is maintained, however, by a small margin. Netflix currently holds 16% of the market, meanwhile, Disney+ holds 14%, Amazon Prime Video 13%, HBO Max 8%, and Hulu 6%.
It’s common for households to have a mix of streaming platforms, however, when hard times arrive, they are prone to cut their spending. That is why having the largest library is important because it will ensure that families on a limited budget stick with Netflix.
Industry Outlook
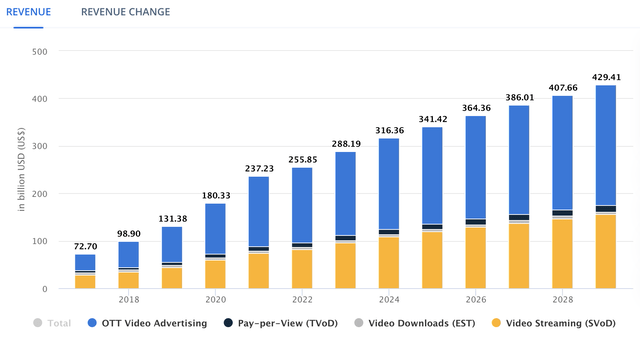
The Worldwide OTT Video Market reached a total market volume of $288.30B in 2023 and is expected to reach $429.41B by 2029, which is an annual growth rate of 6.30%. Netflix’s $33.72B revenues in 2023 mean that it was responsible for around 11.6% of the market’s total volume.
Valuation
To value Netflix, I will use a DCF model. In the table below you will be able to see the financial data necessary for doing so. The equity market value was the market cap of Netflix when I started doing the model.
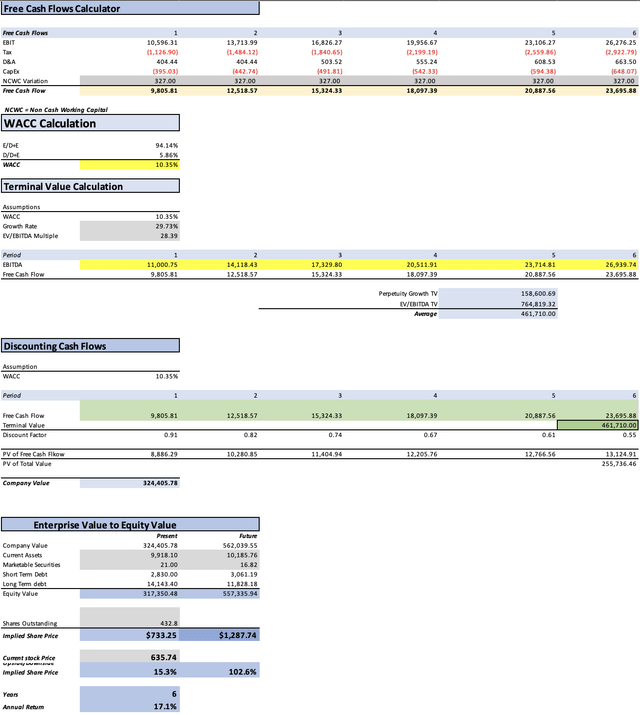
The WACC will be calculated with the already-known formula. In the case of Netflix, the WACC came out at 10.35%. If you want to see a more elaborated calculation, you can go to the section labeled “WACC Calculation” in the DCF model.
Additionally, D&A and CapEx will be calculated with margins tied to the revenue which you can see in the table below.
| TABLE OF ASSUMPTIONS | |
| (Current data) | |
| Assumptions Part 1 | |
| Equity Market Value | 272,670.00 |
| Debt Value | 16,973.40 |
| Cost of Debt | 4.12% |
| Tax Rate | 12.85% |
| 10y Treasury | 4.345% |
| Beta | 1.04 |
| Market Return | 10.50% |
| Cost of Equity | 10.75% |
| Assumptions Part 2 | |
| CapEx | 348.60 |
| Capex Margin | 1.03% |
| Net Income | 5,408.00 |
| Interest | 699.80 |
| Tax | 797.40 |
| D&A | 356.90 |
| Ebitda | 7,262.10 |
| D&A Margin | 1.06% |
| Interest Expense Margin | 2.08% |
| Revenue | 33,723.0 |
First of all, the impact of password cracking, as previously mentioned in the overview section, could add around $799M more in revenue. I will imply that the benefits of this strategy would increase by $133.16M annually throughout 2029. This takes into account that each user that can no longer use the shared password, would be added by the account owner for $7.99 a month.
Then, to predict how much Netflix could earn from advertisements, I will take Hulu as a reference. This platform has around 30M subscribers enrolled in its Ad tier. That is 62.5% of its total user base of 48M. If we keep that percentage, it would mean that Netflix could have 162.5M subscribers from its total 260M base enrolled in the advertisement tier.
Then, of course, Netflix will not get 162.5M ad-tier subscribers in one shot. As of January 2024, Netflix has around 23M subscribers enrolled in the ad tier, which is around 8.8% of the total 260M subscriber base. This means that Netflix still has to make 139.5M subscribers move themselves to the ad tier to achieve Hulu’s proportion of 62.5%. Therefore, I will assume that this will happen at a rate of 23.25M per year.
After that, I need to determine how much ad revenue each user will generate. For that, I have picked the number $103 per year because when you divide Hulu’s $3.1B ad revenue in 2022 by the 30M subscribers enrolled in the ads tier, that’s the number you would get.
| Netflix’s Core Revenue | Advertisements | Password Cracking | |
| 2022 | 31,615.8 | ||
| 2023 | 31,172.7 | 2,550.3 | |
| 2024 | 33,136.6 | 4,945.0 | 133.2 |
| 2025 | 35,224.2 | 7,339.8 | 266.3 |
| 2026 | 37,443.3 | 9,734.5 | 399.5 |
| 2027 | 39,802.2 | 12,129.3 | 532.6 |
| 2028 | 42,309.8 | 14,524.0 | 665.8 |
| 2029 | 44,975.3 | 16,918.8 | 799.0 |
Lastly, the reason why I am directly adding password-sharing crackdowns and ads to net income is because these are essentially capital-free. The only thing that Netflix needs to do to crack down on password-sharing is to change the way the system works, and for advertisements, Netflix needs to pay the company that will give them the software to manage the ads. This contrasts with Netflix’s core streaming business because to do that, Netflix needs to pay for the shows/movies user license or spend on the production of its shows.
However, before doing that I would need to predict how much net income could Netflix generate without password-sharing crackdowns and ads. To do that I assumed that Netflix (without both things) would grow at pace with the OTT Streaming market of 6.32% annually. Then I will use a net income margin of 11.4% which is Netflix’s 2018-2023 average. Subsequently, I add the estimated income that Netflix would receive from both strategies.
| Net Income without Password-Cracking & Ads | |
| 2023 | 3,472.6 |
| 2024 | 3,691.4 |
| 2025 | 3,924.0 |
| 2026 | 4,171.2 |
| 2027 | 4,434.0 |
| 2028 | 4,713.3 |
| 2029 | 5,010.2 |
| Revenue | Net Income | Plus Taxes | Plus D&A | Plus Interest | |
| 2024 | $38,214.8 | $8,769.61 | $9,896.51 | $10,300.95 | $11,000.75 |
| 2025 | $42,830.3 | $11,549.45 | $13,033.56 | $13,438.00 | $14,118.43 |
| 2026 | $47,577.3 | $14,324.03 | $16,164.68 | $16,668.21 | $17,329.80 |
| 2027 | $52,464.2 | $17,114.21 | $19,313.40 | $19,868.64 | $20,511.91 |
| 2028 | $57,499.6 | $19,920.95 | $22,480.81 | $23,089.34 | $23,714.81 |
| 2029 | $62,693.0 | $22,745.30 | $25,668.10 | $26,331.60 | $26,939.74 |
| ^Final EBITA^ |
Finally, before going to the results, I always like to know where the stock be for the final year of my protection. In this case, that year is 2029. To calculate the potential stock price for that year, I will imply that all the elements that compose equity will continue to evolve at the pace displayed in 2020-2023. This means that short-term debt will grow at 1.6% annually, long-term debt will decrease by 3.5% annually, marketable securities will decrease at -4.3% annually (because that is the average evolution that cash reserves displayed in the already mentioned period), and current assets will grow by 0.53% annually.
As you can see the estimated fair price by my model is around $733.25 which is a 15.3% upside from the current stock price of $635.74. Then, the estimated fair price is $1,287.74 which implies 17.1% annual returns throughout 2029.
How do my Estimates Compare with the Average Consensus?
If I did a model completely based on the average consensus, I would get a fair price estimate of $576,29 which is a 9.4% downside risk from the current stock price of $635.74. Additionally, the future stock price of that hypothetical model would be $1,015.02 which implies annual returns of 9.9% throughout 2029.
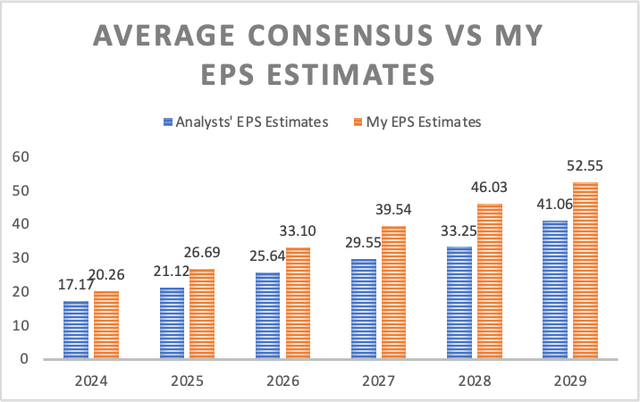
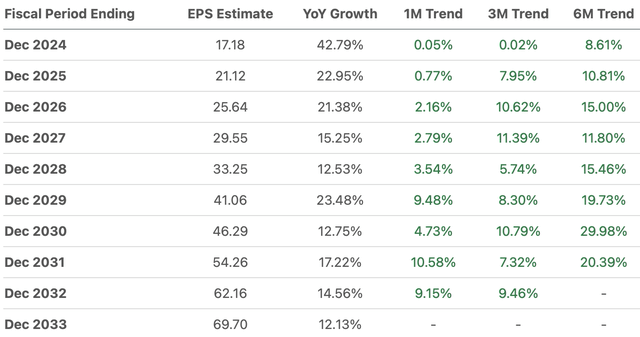
Starting with my EPS estimate for 2024, mine is around 18.01% and throughout all the projections, they remain around 25% higher. This situation peaks in 2028 where my estimates are around 38.43% higher than the average consensus.
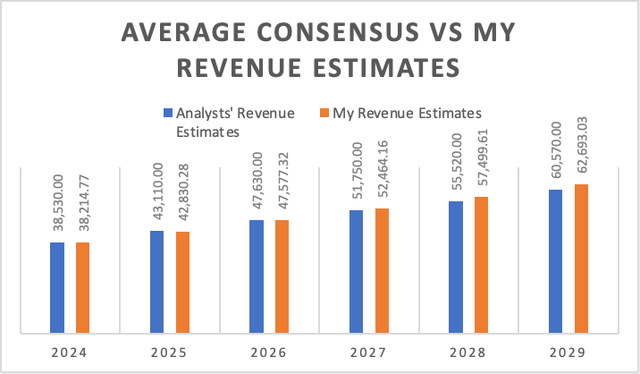
The reason for this is not revenue, since my revenue estimates are almost in line for years 2024-2027 and are just 3.57% and 3.51% higher for years 2028 and 2029 respectively. This leaves net income margin as the sole cause of why my EPS estimates are higher than the average consensus.
Risks to Thesis
The main risk for my thesis is that these strategies fail. That the password-crackdown efforts end in reduced traffic which would in turn affect Netflix’s pricing power for advertisements, would probably bring my fair price estimate down significantly.
Then there is the risk of the market, because apparently is not a very difficult market to enter, someone just needs to create a platform and then have enough money to buy the content licenses. This means that the market could be flooded pretty easily. Furthermore, companies such as The Walt Disney Company (DIS) and Amazon.com, Inc. (AMZN) whose core business does not come from streaming, can cause a severe pricing war that Netflix will of course not win since both of those companies can subsidize the streaming business with their main operations.
Finally, there is the possibility that the average consensus does not adjust to my optimist EPS targets as it has been doing since my first article on Netflix, which at that time implied an upside of around 120.8%.
Conclusion
In conclusion, Netflix’s possible upside of 15.3% and fair price of $733.25, no longer justify a “strong buy” rating. Nevertheless, I am still optimistic about the opportunities that are password-sharing crackdown and ads tier potential.
There are still risks concerning my optimistic targets, and Netflix is not able to deliver surprises as it has been doing so far, which has upward revision trends.
For these reasons, I am downgrading the stock to “buy”. In future earnings, I will continue to monitor the evolution of the two strategies Netflix is trying to implement to boost earnings
Analyst’s Disclosure: I/we have no stock, option or similar derivative position in any of the companies mentioned, but may initiate a beneficial Long position through a purchase of the stock, or the purchase of call options or similar derivatives in NFLX over the next 72 hours. I wrote this article myself, and it expresses my own opinions. I am not receiving compensation for it (other than from Seeking Alpha). I have no business relationship with any company whose stock is mentioned in this article.
Seeking Alpha’s Disclosure: Past performance is no guarantee of future results. No recommendation or advice is being given as to whether any investment is suitable for a particular investor. Any views or opinions expressed above may not reflect those of Seeking Alpha as a whole. Seeking Alpha is not a licensed securities dealer, broker or US investment adviser or investment bank. Our analysts are third party authors that include both professional investors and individual investors who may not be licensed or certified by any institute or regulatory body.

