Summary:
- Nike’s shares spiked nearly 8% after exceeding analysts’ profitability forecasts in its Q1 2024 financial results.
- Revenue increased by 2% to $12.94 billion, but sales missed expectations by $62.1 million.
- Weakness in North America and Converse operations were offset by strong performance in Greater China and EMEA regions.
- In all, the company is doing fine, but there are better prospects to be had right now.
Scott Olson
One thing that investors of individual stocks should get used to is volatility. Some days will be really positive, while others will be really negative. One company that graced its shareholders with a really positive day on September 29 was Nike (NYSE:NKE). The footwear, apparel, and accessories behemoth saw its shares spike, trading up nearly 8% after news broke the day before that the enterprise had exceeded analysts’ forecasts when it came to profitability and indicated that the future outlook, while not exactly guaranteed, should be positive. While this is great to see, especially during such uncertain times, this doesn’t necessarily mean that the company makes sense to buy into at this moment.
A solid quarter
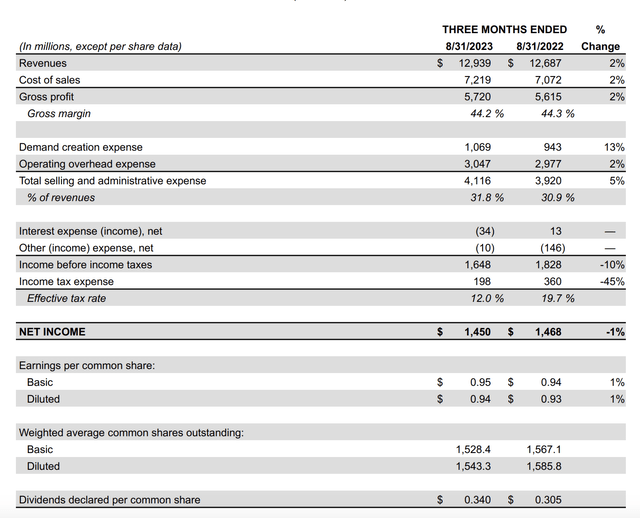
After the market closed on September 28, the management team at Nike announced financial results covering the first quarter of the company’s 2024 fiscal year. For the most part, the results reported by management were positive. Revenue, for instance, managed to come in at $12.94 billion. That is 2% higher than the $12.69 billion the company reported the same time last year. Although the revenue increase was great to see, it’s important to note that sales missed analysts’ forecasts by $62.1 million. So even though it’s great to see an increase in revenue, the picture wasn’t as positive as some had hoped.
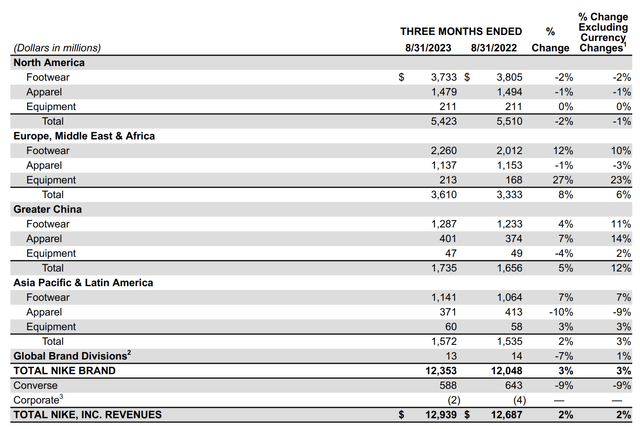
As with any large and complex organization, there are many working parts that go together to determine that revenue figure. After all, the company’s product line is not a monolith. As an example, there were some areas of weakness. Revenue in North America, for instance, actually fell by roughly 2% from $5.51 billion to $5.42 billion. However, that drop would have been around 1% had it not been for foreign currency fluctuations. The biggest weakness in North America was footwear, with revenue declining from $3.81 billion to $3.73 billion. Although wholesale revenue for the quarter for the company was down only 1%, throughout North America it was down 8%. And that was driven, according to management, by its restrained selling of marketplace supply. The fact of the matter is that there have been serious concerns regarding bloated inventory levels across the economy more broadly. So this seems to be a consequence of that. The good news is that inventories for the company as a whole were down 10% compared to what they were the year prior. It’s clear that management is working through those concerns.
Regionally speaking, the only other weak spot for the company that was of any significant size involved its Converse operations. Revenue there dropped around 9% from $643 million to $588 million. Outside of this, the picture as a whole was quite robust. Greater China revenue was particularly strong on an organic basis, with revenue shooting up 12%. However, if we factor in foreign currency fluctuations, that becomes a much more modest 5%. Both footwear and apparel did well in China. If we factor in foreign currency fluctuations, the greatest strength of the company came from its EMEA (Europe, Middle East, and Africa) operations, with revenue spiking 8%. Equipment revenue led the way, surging 27%, while footwear posted a rather remarkable 12% increase. Extended lockdowns from certain countries in response to the COVID-19 pandemic caused a delayed recovery in those economies that the company is only now just benefiting significantly from. But as the world finishes opening back up, activities like sports and the return of millions of students to school have proven to be a boon for the enterprise.
Across the board, the company posted some rather impressive results with Nike Direct and with the company stores. In Greater China, Nike Direct revenue jumped 10%, while the company’s stores reported a 12% increase in sales. In the EMEA region, Nike Direct revenue was up 6%, while store-related revenue shot up 17%. Even in North America, where financial performance was the weakest for the Nike brand, Nike Direct revenue had gone up 7%, while growth for stores totaled 11%.
On the bottom line, the picture was somewhat mixed as well, but positive as far as analysts were concerned. The company reported earnings per share of $0.94. That was slightly higher than the $0.93 per share reported one year earlier. It also exceeded analysts’ forecasts by $0.18. However, the increase in profitability on a per-share basis was only driven by a 2.7% reduction in share count year over year. Actual net profits for the company dipped from $1.47 billion to $1.45 billion. There were a couple of primary culprits in this regard. For starters, income tax expense dropped from $360 million last year to $198 million this year. Selling and administrative costs grew from 30.9% of sales to 31.8%, while other income dropped from $146 million to only $10 million.
Management has not revealed all of the financial details behind two of these three changes. But we do know that selling and administrative costs increased because of a 13% jump in what management calls demand creation expense. This mostly centers around advertising and marketing activities. When I see margins decline, I see an investment in these types of activities as being a positive, so long as the margin compression associated with it does not represent a new normal. At the end of the day, this should be seen as a boost to revenue in the long run. If it does not materialize, then it becomes a negative. So this is something that investors will probably want to keep an eye on in future quarters.
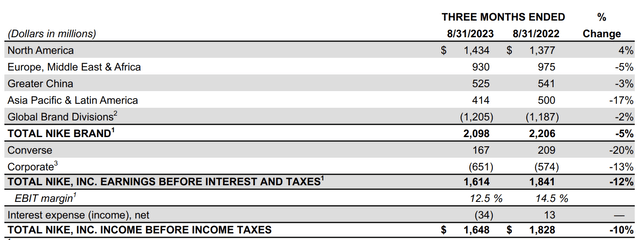
Unfortunately, management has not provided details when it comes to other major profitability metrics that I like to follow, such as operating cash flow and EBITDA. They did provide estimates for EBIT, however. Due to the same aforementioned issues, this particular metric fell from $1.84 billion to $1.61 billion. This weakness has not stopped the company from buying back stock. During the most recent quarter, it repurchased 10.5 million shares for a combined $1.1 billion. And in subsequent quarters, it’s likely to continue those repurchases.
When it comes to the future, we don’t have much in the way of guidance. On the investor call that management held, they did provide a general outlook, but nothing terribly concrete. They did say that they expect reported revenue to grow at a mid-single-digit rate, so that likely will mean somewhere between 4% and 6% year over year. But they cautioned that they are keeping a close eye on the current operating environment, including things like foreign currency fluctuations and consumer demand as the holiday season approaches. This outlook does, fortunately, factor in four percentage points of headwind associated with the accelerated liquidation and higher wholesale selling that the company experienced in the prior year. And that stemmed from the company selling what was basically five seasons’ worth of supply over the span of four fiscal quarters. So while the company certainly discounted products at that time, this revenue growth is coming off of a high base of revenue the year prior.
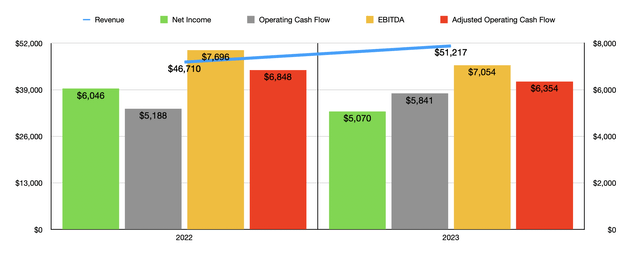
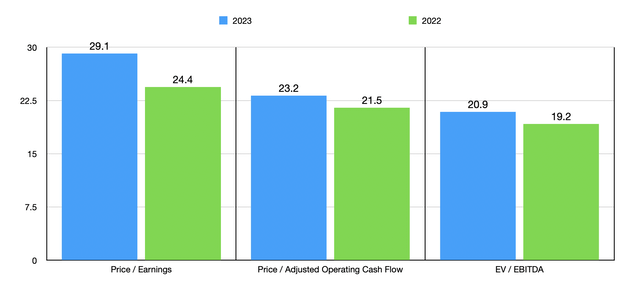
This actually makes sense when you look at the financial data covering the 2023 fiscal year. Revenue during that time was $51.22 billion. That represents an increase of 9.6% over the $46.71 billion reported for 2022. But even though revenue increased significantly, that does not mean that profits followed suit. As you can see in the chart above, operating cash flow did improve during that time. But net profits, adjusted operating cash flow, and EBITDA were all down from 2022 through 2023.
Using data from the past two completed fiscal years, I was able to price the company as shown in the chart above. As you can see, the stock does look more expensive using data from last year than from the year prior. In the table below, meanwhile, I compared Nike to five similar firms. When it comes to the price to earnings approach, the price to operating cash flow approach, and the EV to EBITDA approach, it was more expensive than all five of its peers.
| Company | Price/Earnings | Price/Operating Cash Flow | EV/EBITDA |
| Nike | 29.1 | 23.2 | 20.9 |
| Deckers Outdoor (DECK) | 25.7 | 19.9 | 16.5 |
| Skechers U.S.A. (SKX) | 16.3 | 11.7 | 8.6 |
| Crocs (CROX) | 8.3 | 6.5 | 6.6 |
| Steven Madden (SHOO) | 14.8 | 7.8 | 9.3 |
| Wolverine World Wide (WWW) | 5.6 | 5.6 | 8.2 |
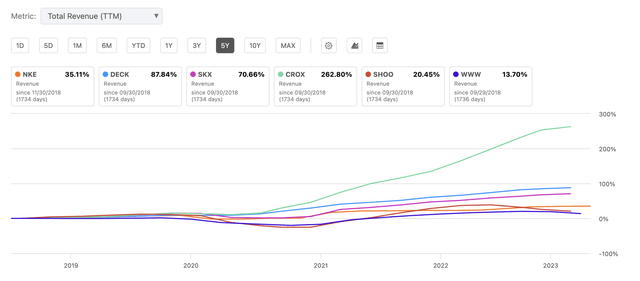
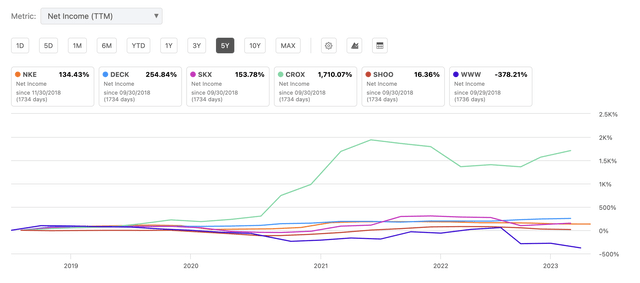
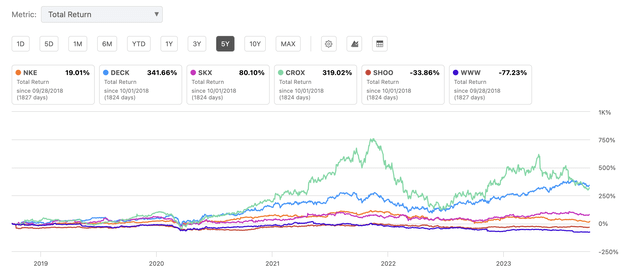
A close observer of these different companies might point out that Nike is a world-class brand that is significantly greater in size than any of the companies I listed here. This is an entirely fair point to make, and it can be used to justify paying a premium for the stock. But at some point, you would expect that premium to show up in some way, shape, or form. As the first chart below illustrates, it does not show up in the form of more rapid revenue growth compared to some of its competitors. Then again, how fast can the largest player in a highly competitive and developed market grow? As the next chart below illustrates, it doesn’t seem to show up in the form of profit growth either. But the same argument that one could make regarding revenue also applies. Surely, though, you would expect it to show up in the form of shareholder return. But this, unfortunately, is not the case either. As you can see in the third chart below, Nike has lagged some of its competitors on that front as well.
Takeaway
Based on the data provided, I would argue that Nike is a solid company that will do well for itself and its shareholders in the long run. Having said that, I would argue that it’s also not the best prospect in the space at this time. Yes, revenue did grow year over year in a difficult environment, but it still fell short of expectations. Profits per share improved, but total profits weakened. And when you compare the company to similar enterprises, you see a firm that is decent, but not likely to generate robust returns on a relative basis moving forward.
Analyst’s Disclosure: I/we have no stock, option or similar derivative position in any of the companies mentioned, and no plans to initiate any such positions within the next 72 hours. I wrote this article myself, and it expresses my own opinions. I am not receiving compensation for it (other than from Seeking Alpha). I have no business relationship with any company whose stock is mentioned in this article.
Seeking Alpha’s Disclosure: Past performance is no guarantee of future results. No recommendation or advice is being given as to whether any investment is suitable for a particular investor. Any views or opinions expressed above may not reflect those of Seeking Alpha as a whole. Seeking Alpha is not a licensed securities dealer, broker or US investment adviser or investment bank. Our analysts are third party authors that include both professional investors and individual investors who may not be licensed or certified by any institute or regulatory body.
Crude Value Insights is a service geared toward investors who are interested in keeping track of oil and gas E&P firms. It offers its subscribers cash flow deep dive analyses into a portfolio of 36 different E&P companies of all sizes, as well as periodic sensitivity analyses. The world of E&P companies is incredibly volatile and understanding how healthy these firms are and how well they can stand up in different environments can result in attractive returns, especially in an environment where oil and/or gas prices are elevated.

