Summary:
- Nvidia’s Q4 2024 earnings surpassed expectations, with an 11.20% beat in EPS and 7.54% in revenue.
- Following the earnings surprise, Nvidia’s fair price estimate is $877.27, 1.5% above the current stock price, with projected annual returns of 25.8% by 2033.
- Nvidia maintains dominance in AI chips with 84% market share in a market projected to reach $867.76B in volume by 2030.
- Despite client developments, Nvidia’s position remains strong, with performance parity and a cloud business venture mitigating risks.
- Despite valuation concerns, Nvidia’s performance and market outlook support a continued “buy” rating, with resilience against emerging risks highlighting long-term growth potential.
wellesenterprises
Thesis
In my previous article about Nvidia Corporation (NASDAQ:NVDA), I rated the stock as a buy, explaining that the potential downside was very low. Therefore, this was a perfect opportunity to enter and wait for the company to surprise in their Q4 2024 earnings. Needless to say, the company indeed surprised us, and the stock price increased by 22.73% since that previous article.
In Q4 2024 earnings, the company reported an EPS of $5.16, which beat the consensus by 11.20%. Regarding revenue, the company reported $22.1B, which beat estimates by 7.54%. Data center revenue was up 409% from a year ago, and gaming was up 56%.
After re-evaluating Nvidia, I arrived at a new fair price estimate of $877.27, which is 1.5% over the current stock price of $864.02, and a future price for 2033 of $3,090.27, which implies annual returns of 25.8% by 2033.
Furthermore, I concluded that the creation of custom AI chips by some of Nvidia’s biggest clients does not constitute a huge risk for Nvidia. For these reasons, I continue to reiterate my “buy” rating on the stock.
Overview
Growth Plan
The vast majority of the growth that Nvidia has witnessed recently, comes from being a pioneer in the sale of GPUs capable of being used for artificial intelligence.
As it can be deducted, Nvidia’s growth plan is to remain the N°1 AI chips vendor. This will be achieved by continuing to innovate to maintain its chips’ performance advantage over that of the competition (more on this will be explained in the following section).
An example of this is that Nvidia presented this year the Blackwell Platform, which is, as Jenseng Huang called it, a “very big GPU”. The GPU is twice the size of the GH200 Grace Hopper super chip and has 1.28B more transistors, 4x the on-die memory, and 5x the AI performance. The main advantage of this chip is efficiency, as it has more power within its structure, which makes it more energy efficient. This chip will be launched later this year.
How does Nvidia Compare against Peers?
Speaking about performance, I want to clarify that currently Advanced Micro Devices (AMD) and Intel Corporation (INTC) are not near Nvidia in terms of power and performance. Nvidia’s chips may be more expensive than those of the other two companies, but, clients may save money in other ways, like for example, in energy costs, and space. Nvidia maintains a market share of around 90% in the AI chips market.
Forbes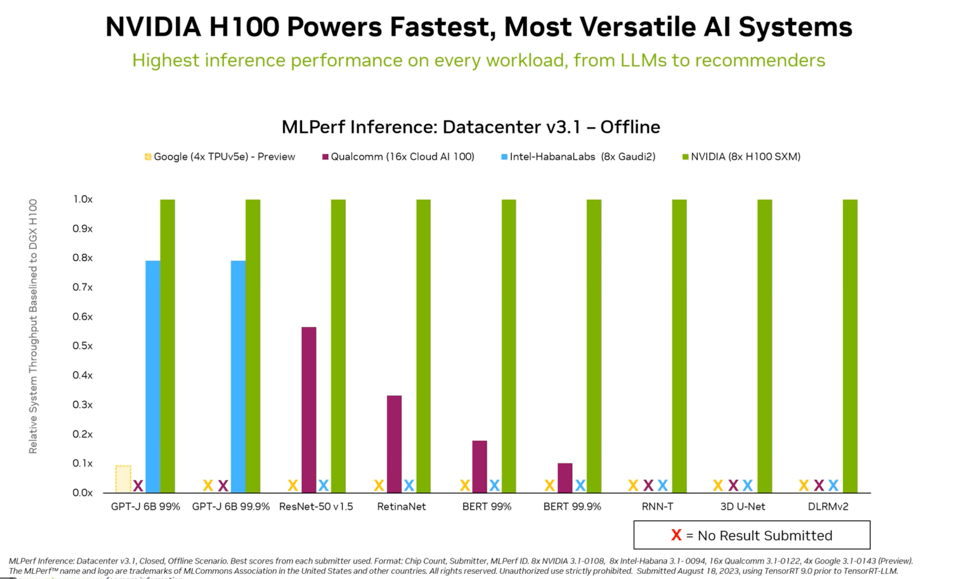
Then, there’s the sale of GPUs. This market is in practice a duopoly between Nvidia and AMD. Nevertheless, Nvidia takes the lead by a huge margin, since it holds around 84%, which leaves AMD with a 16% market share.
Bottom-line & top-line performance
Nvidia’s top-line performance has been incredible over the years. Even before the AI boom, the company registered annual revenue growth of 20,50 and even 60%. Nevertheless, all that pales behind the incredible 125.85% revenue growth in FY2024 (which corresponds to the year 2023).
Meanwhile, net income has seen equally high growth rates, and since 2018, it has grown at a 146.1% annual rate, faster than revenue, which grew by 87.8% annually.
| Revenue | Growth % | Operating Income | Growth % | Net Income | Growth % | |
| FY2018 | 9,714 | 3,210 | 3,047 | |||
| FY2019 | 11,716 | 20.61% | 3,804 | 18.50% | 4,141 | 35.90% |
| FY2020 | 10,918 | -6.81% | 2,846 | -25.18% | 2,796 | -32.48% |
| FY2021 | 16,675 | 52.73% | 4,721 | 65.88% | 4,332 | 54.94% |
| FY2022 | 26,914 | 61.40% | 10,041 | 112.69% | 9,752 | 125.12% |
| FY2023 | 26,974 | 0.22% | 5,577 | -44.46% | 4,368 | -55.21% |
| FY2024 | 60,922.0 | 125.85% | 32,972.0 | 491.21% | 29,760.0 | 581.32% |
| Avg Annual Growth Rate | 87.9% | 154.5% | 146.1% |
The faster growth of net income can be visualized in the operating & net income margins, which have expanded, which means that Nvidia has become a more efficient business throughout the years. Currently, the net income margin stands at an incredible 48.85%, and the operating margin at 54.12%.
| OperatingMargin % | Net IncomeMargin % | |
| FY2018 | 33.05% | 31.37% |
| FY2019 | 32.47% | 35.34% |
| FY2020 | 26.07% | 25.61% |
| FY2021 | 28.31% | 25.98% |
| FY2022 | 37.31% | 36.23% |
| FY2023 | 20.68% | 16.19% |
| FY2024 | 54.12% | 48.85% |
| Avg | 33.14% | 31.37% |
Lastly, cash flow has increased by 120.5% annually since 2018, higher than revenue, which also means that the FCF margin has been improving throughout the years. The FCF margin currently stands at 38.1%.
The growth has been primarily thanks to the increase in cash from operations since interest payments and CapEx have remained almost flat since FY2022 (which corresponds to the year 2021).
| Free Cash-Flow | FCF Margin % | |
| FY2018 | 2,821 | 29.0% |
| FY2019 | 3,446 | 29.4% |
| FY2020 | 4,150 | 38.0% |
| FY2021 | 4,801 | 28.8% |
| FY2022 | 8,179 | 30.4% |
| FY2023 | 4,257 | 15.8% |
| FY2024 | 23,220 | 38.1% |
| Avg Annual Growth Rate | 120.5% | 29.9% |
Industry Outlook & Addressable Market
The data center market, which is where Nvidia’s AI chips are used generated $329.30B in 2024 and is expected to reach $438.63B in 2028. This is a 6.56% CAGR throughout 2028.
However, a data center includes many things such as networking equipment, storage for servers, and the servers by themselves, things in which Nvidia does not specialize. Taking only artificial intelligence, we will see that this market generated around $135.94B in 2023 and is expected to generate $826.76B in 2030, which is a 28.46% CAGR throughout 2030.
In its AI offerings, Nvidia offers its AI-capable GPUs such as the H100, the GH200 Grace Hopper, and the soon-to-be-released, Blackwell Platform.
Statista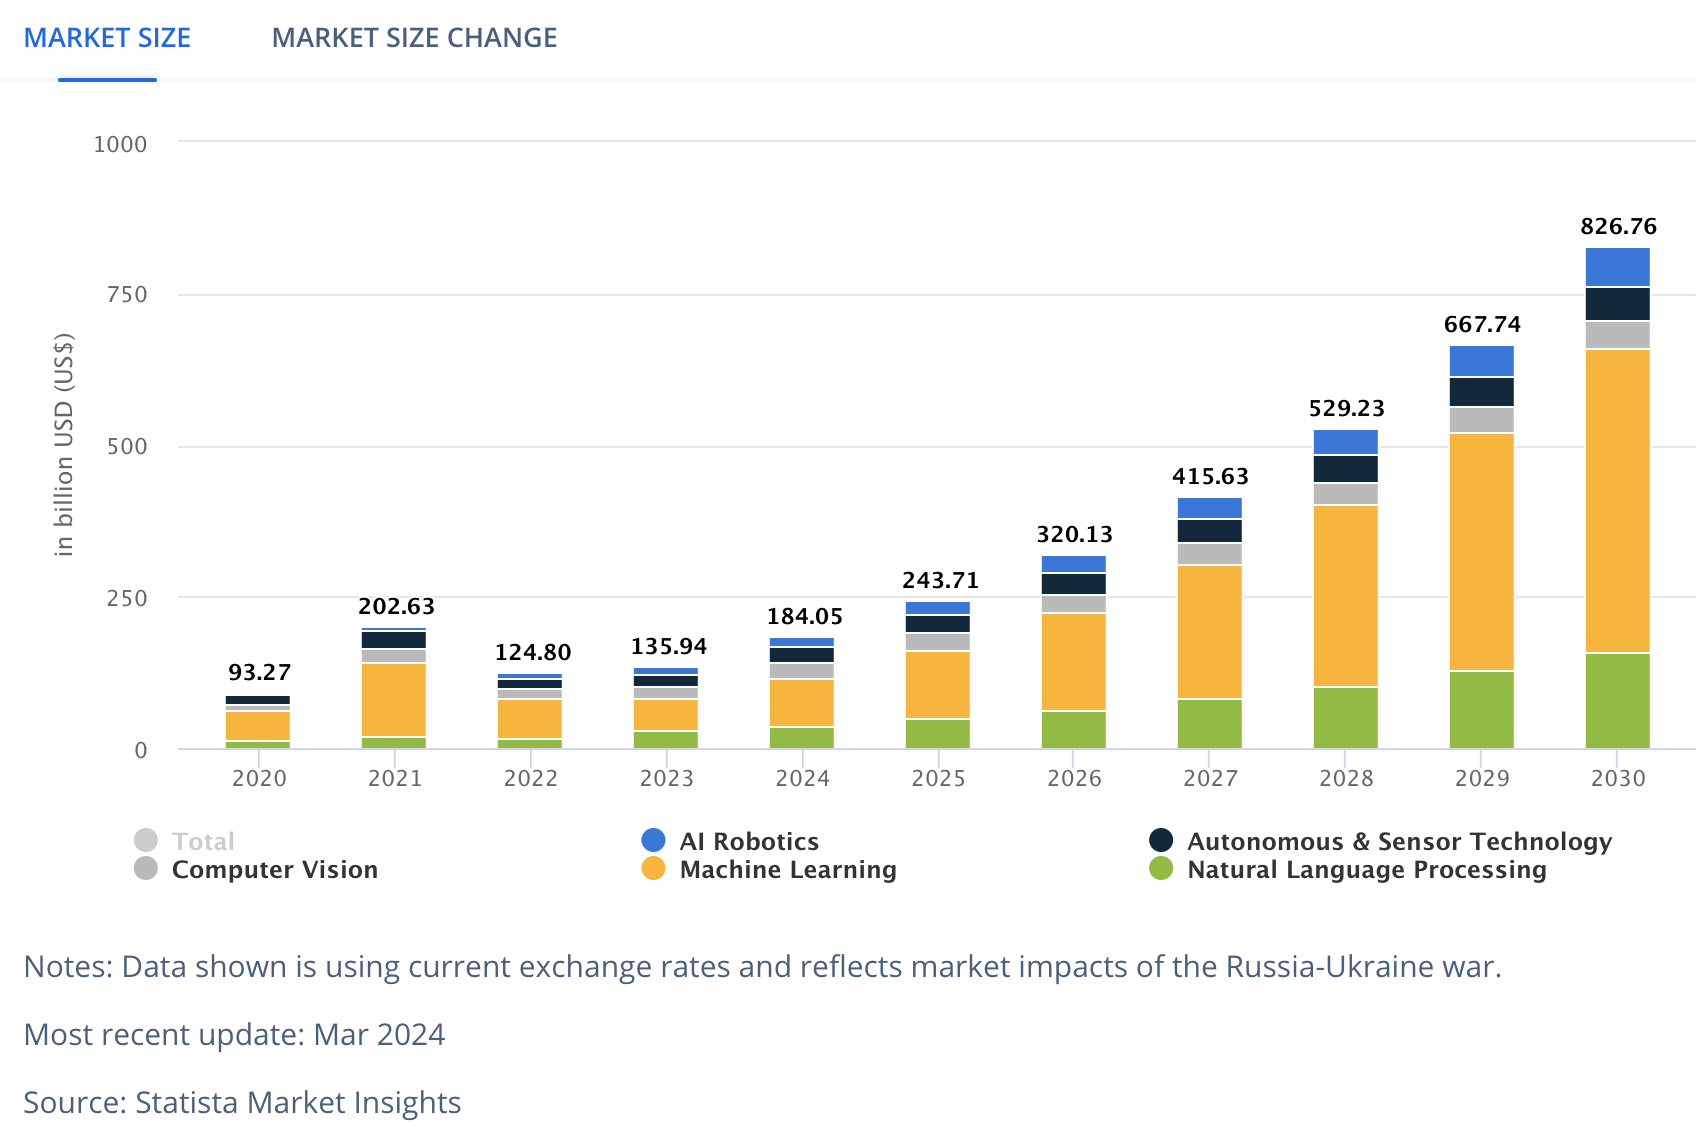
Then, it’s Nvidia’s second largest segment: gaming. This market is divided into cloud gaming and conventional GPUs. The first one is offered through GeForceNow. The worldwide cloud gaming market generated around $4.34B in revenues for 2023 and this number is expected to increase to $25.30B by 2029, which is an annual CAGR of 80.49% throughout 2029.
Meanwhile, the conventional GPUs refer to Nvidia’s GTX16 and RTX20, RTX30, and RTX40 series. The gaming GPU market is valued, as of 2023, at $3.65B and is expected to grow by 33.84% annually until it becomes a $15.70B market by 2029.
Then, it’s professional visualization, which is a service Nvidia offers to help customers learn to use in the best way their Nvidia hardware. Nvidia also offers the Nvidia Omniverse, a platform where users can build virtual world simulation applications. The data visualization market is expected to reach a size of $9.84B in 2024 and thereafter, grow at a CAGR of 10.95% until it reaches a $16.54B size by 2029.
Lastly, Nvidia’s automotive business focuses on providing solutions for autonomous driving and in-vehicle cockpits. Nvidia’s offering include the Nvidia Drive Hyperion. This offering has two subcategories, the Drive AGX, which is a reference sensor for full-self driving capability, and the modular Drive software, for FSD, mapping, and parking. Additionally, it offers the Nvidia Drive Sim (based on the previously-mentioned Nvidia Omniverse), for digital cockpit development, and as well as for testing FSD platforms. The automobile semiconductor market is estimated to be around $76.28B in 2023, and it will grow up to $155.4B by 2032. This implies an annual growth rate of 13.02%.
With this information, we can infer that Nvidia’s addressable market currently stands at around $230.05B as of 2023, and that number could increase up to $1.02T in 2030. This is a CAGR of 49.28% throughout 2030, and most of that coming from AI.
Is Nvidia Capable of Achieving these Growth Rates?
The most important segments for Nvidia are data center & AI, and gaming. Regarding data centers, demand is estimated to stay strong for 2024. For instance, the demand for HBM memory, which is nearly completely used for AI, is expected to grow about 60% in the mid-to-long term. That means that the 28.46% growth rate for AI is very conservative.
Then, concerning gaming, I think that the real catalyst is cloud gaming, because it provides people with a cheap solution for playing demanding games. This could even make the console wars more difficult since now PCs will be able to compete. The 80.49% CAGR pales beside the 950% annual growth that GeForce Now registered in its user base two years ago when it had around 1M users. Now this platform has around 20M.
But cloud gaming is also a catalyst for normal GPUs because the companies that are going to host the servers need GPUs to process the graphics and deliver that image to the client. Furthermore, Nvidia can offer cheaper prices since it doesn’t need to pay for another company’s profit because the GPUs that will be used are those of Nvidia, which ensures GeForce Now’s competitiveness.
Nvidia FY2024 10K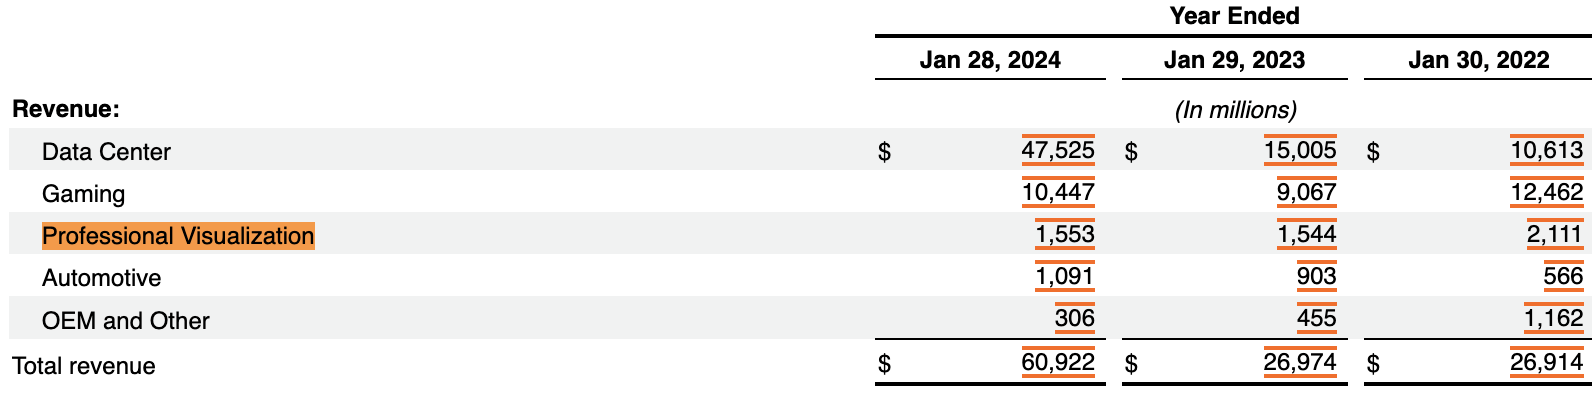
Lastly, professional visualization has shrunk by 13.21% annually, but automotive has grown by 46.37% annually. So, in other words, Nvidia can and has the means necessary to achieve (and even surpass) these growth rates. The only thing to check would be professional visualization.
How will custom AI Chips Affect Nvidia’s Business?
Nvidia has prominent clients such as Amazon.com, Inc. (AMZN), Alphabet, Inc. (GOOG)(GOOGL), Microsoft Corporation (MSFT), Meta Platforms, Inc. (META), which have spent collectively around $14B, considering that the H100 average price is around $35K. These contracts with just these four companies account for over 29.4% of Nvidia’s data center revenue in FY2024 (corresponding to the year 2023).
All of these companies have announced plans to make their custom AI chips to cut costs. This approach was done by Amazon when it started to phase out its Oracle Cloud infrastructure with its own AWS cloud.
Nevertheless, this does not mean that Nvidia will be completely phased out, instead, companies such as Amazon plan to continue offering Nvidia’s chips along with their custom chips to its cloud customers. Furthermore, yes, those custom alternatives may be cheaper, however, they also need to match Nvidia’s performance, if not, then it would be the same as Intel’s Gaudi2, which is way cheaper, but has less power.
Aside from this, last year Nvidia announced its cloud business, which could potentially create a new stream of revenues for the company which could replace the lost revenue due to the custom AI chips of its Big 4 clients. Furthermore, Nvidia has all the means to create a cheaper and less powerful chip.
Statista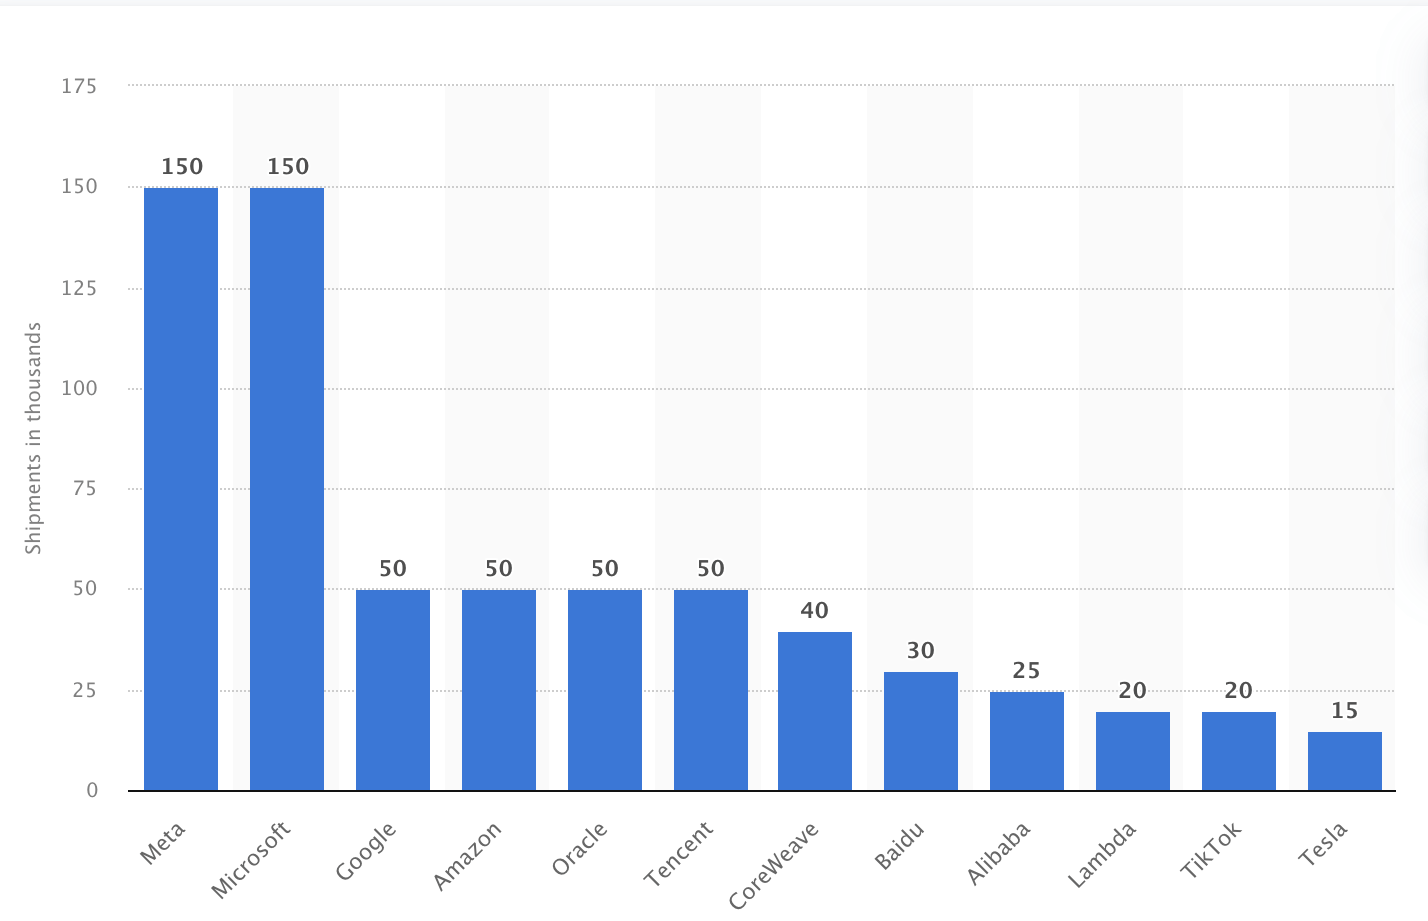
Valuation
I will value Nvidia with a DCF model. Before starting, you will observe that I am doing a DCF for 10 years instead of 6 as I always do. The reason for this is that Nvidia’s estimates run up to the year 2034, which means that everyone is valuing Nvidia under those terms. This means that If I do a 6-year DCF, I would get a “hugely overvalued” result.
Starting with the WACC was calculated with the already-known formula. You can see the process in the DCF model. The result was 14.74%. Furthermore, S&A will be calculated with a margin tied to revenue, meanwhile, R&D will be projected with a margin tied to gross profit. Lastly, CapEx will grow at the rate displayed in 2018-2023 of 13.4%.
| TABLE OF ASSUMPTIONS | |
| (Current data) | |
| Assumptions Part 1 | |
| Equity Market Price | 2,160,000.00 |
| Debt Value | 11,056.00 |
| Cost of Debt | 2.32% |
| Tax Rate | 2.20% |
| 10y Treasury | 4.688% |
| Beta | 1.74 |
| Market Return | 10.50% |
| Cost of Equity | 14.80% |
| Assumptions Part 2 | |
| CapEx | 1,069.00 |
| Capex Margin | 1.75% |
| Net Income | 29,760.00 |
| Interest | 257.00 |
| Tax | 4,058.00 |
| D&A | 894.00 |
| Ebitda | 34,969.00 |
| D&A Margin | 1.47% |
| Revenue | 60,922.0 |
| R&D Expense Margin | 19.58% |
The first revenue I will calculate is that of the gaming segment. As previously said in the overview section, the cloud gaming market is expected to grow at a rate of 80.49% annually throughout 2029, and GPUs for gaming at 33.38%.
However, after 2029 (which is FY2030 for Nvidia), Growth rates will halve every two years. That means that in 2030, cloud gaming growth will be halved to 40.24% and then in 2032 it will be halved again to 20.12%. Concerning the sales of GPUS, the growth will halve in the same periods, which means that in 2030, the segment will be growing by 16.9% and in 2032 by 8.45%.
| GeForce NOW | Sale of GPUs for gaming | |
| FY 2025 | 2,017.26 | 10,258.45 |
| FY 2026 | 2,906.67 | 13,725.80 |
| FY 2027 | 4,188.22 | 18,365.12 |
| FY 2028 | 6,034.81 | 24,572.53 |
| FY 2029 | 8,695.55 | 32,878.05 |
| FY 2030 | 12,529.42 | 43,990.83 |
| FY 2031 | 18,053.65 | 58,859.73 |
| FY 2032 | 26,013.50 | 78,754.32 |
| FY 2033 | 37,482.85 | 105,373.28 |
| FY 2034 | 54,009.04 | 140,989.44 |
Then, it’s time to calculate the revenue of the data center, which as previously said, most of its growth has come from the sale of Nvidia’s AI-capable GPUs. As previously said in the overview section, the AI market is expected to grow at a CAGR of 28.46% throughout 2030. Then, I will halve the growth rate to 14.23% in 2031 and 7.11% in 2033.
Lastly, Professional visualization will grow by 10.95% annually, automotive by 13.02% (which is the growth rate of their respective market) and OEM & Other will stay constant at $306M per year. I think that these growth rates are appropriate because most of the impact is coming from data center and gaming revenue which are Nvidia’s most important segments.
| Data Center | Gaming | Professional Visualization | Automotive | OEM & Other | |
| FY 2025 | 47,525.0 | 10,447.0 | 1,553.0 | 1,091.0 | 306.0 |
| FY 2026 | 61,050.6 | 12,785.3 | 1,723.1 | 1,233.0 | 306.0 |
| FY 2027 | 78,425.6 | 18,286.5 | 1,911.7 | 1,393.6 | 306.0 |
| FY 2028 | 100,745.6 | 26,596.8 | 2,121.1 | 1,575.0 | 306.0 |
| FY 2029 | 129,417.7 | 39,429.9 | 2,353.3 | 1,780.1 | 306.0 |
| FY 2030 | 166,250.0 | 59,694.0 | 2,611.0 | 2,011.9 | 306.0 |
| FY 2031 | 213,564.8 | 92,391.0 | 2,896.9 | 2,273.8 | 306.0 |
| FY 2032 | 243,955.0 | 119,304.1 | 3,214.1 | 2,569.9 | 306.0 |
| FY 2033 | 278,669.9 | 155,312.8 | 3,566.1 | 2,904.5 | 306.0 |
| FY 2034 | 298,483.3 | 179,546.2 | 3,956.6 | 3,282.6 | 306.0 |
| FY 2035 | 319,705.4 | 208,062.5 | 4,389.8 | 3,710.0 | 306.0 |
| Growth Rate % | 28.46% | 10.95% | 13.02% |
Now it’s time to calculate the possible net income that the company will generate. For this, I will first some assumptions.
The first one is that General & Administrative expenses were at $2.64B for FY2024, which divided by the total amount of full-time employees of 29.6K, shows us that Nvidia is spending around $89.66K per employee. Then I will assume that Nvidia will continue the annual hiring of 3.563K employees as displayed in 2021-2023.
Then, in what concerns interest expenses and interest income, I calculated the return rate on Nvidia’s marketable securities in 2023, which came to around 4.63%. Furthermore, during 2019, when interest rates were low, this calculation would yield a result of 2.05%.
Concerning Interest payments, during 2023, the cost of debt was around 2.32%, and in 2019 it was 2.92%. The reason why during 2019 the interest on the debt was higher may be because most of Nvidia’s current exponential growth has come before 2020, therefore, Nvidia has become a more solid company with better prospects of growth. This increases the overall creditworthiness of the company and therefore makes it possible for Nvidia to access cheaper financing.
| During High Interest Rates (2023) | During Low Interest Rates (2019) | |
| Marketable Securities | 18,704.00 | 6,640.00 |
| Interest Income | 866.00 | 136.00 |
| Return % | 4.63% | 2.05% |
| Total Debt | 11,056.00 | 1,988.00 |
| Interest Payment | 257.00 | 58.00 |
| Cost % | 2.32% | 2.92% |
Now, I need to distribute that on the projection. For this, I will assume that total debt will continue to grow at the pace showcased in 2021-2023 of 15.2%. Then the interest payment on debt will stay constant at 2.62%, which is the average between 2.32% and 2.92%.
Meanwhile, marketable securities will grow at the pace of cash reserves from 2021 to 2023 of 41.6%. Then, I will assume that interest rates will remain low during 2025-2026, and 2028-2029. Beyond that year, I will assume an average return rate of 3.34% (which is the average of (4.63% and 2.05%. For the year 2027, I am assuming that the FED will increase interest rates again. For my argument on this, you can check the valuation section of my article about Bank of America Corporation (BAC).
Finally, gross profit will be calculated with the assumption that Nvidia will maintain its 72.71% gross margin. My argument for this is that Nvidia is a pretty capital-light business since their job is to design, and then, they outsource the production to Taiwan Semiconductor Manufacturing Company Limited (TSM). For instance, Nvidia spent around $1B in capital expenditure, which is merely 2.32% of revenues. Lastly, R&D expenses will be calculated with a margin of 19.58% tied to gross profit.
You can see the resulting net incomes in the chart below:
Author’s Calculations
| Revenue | Net Income | Plus Taxes | Plus D&A | Plus Interest | |
| FY 2025 | $77,098.0 | $42,054.42 | $41,107.99 | $42,239.36 | $42,572.99 |
| FY 2026 | $100,323.5 | $54,526.18 | $53,299.08 | $54,430.45 | $54,814.72 |
| FY 2027 | $131,344.4 | $72,208.82 | $70,583.76 | $72,511.18 | $72,953.76 |
| FY 2028 | $173,287.0 | $98,156.24 | $95,947.24 | $98,490.14 | $98,999.90 |
| FY 2029 | $230,872.9 | $129,427.69 | $126,514.93 | $129,902.88 | $130,490.00 |
| FY 2030 | $311,432.5 | $175,983.71 | $172,023.21 | $176,593.33 | $177,269.56 |
| FY 2031 | $369,349.1 | $212,641.68 | $212,641.68 | $218,061.69 | $218,840.55 |
| FY 2032 | $440,759.2 | $255,948.35 | $255,948.35 | $262,416.28 | $263,313.35 |
| FY 2033 | $485,574.7 | $285,234.08 | $285,234.08 | $292,359.64 | $293,392.86 |
| FY 2034 | $536,173.8 | $319,513.30 | $319,513.30 | $327,381.38 | $326,191.35 |
| ^Final EBITA^ |
Now, before going to the results, I would like to calculate which could be the stock price for 2029. To do this I will use the undiscounted cash flows that you can see highlighted in green in the model below. Then, I will assume that the variables that compose equity will evolve at the pace displayed in 2021-2023. This means that short-term debt will grow by 19.7% annually, long-term debt by 13.9%, and current assets by 26.91%.
Author’s Calculations Author’s Calculations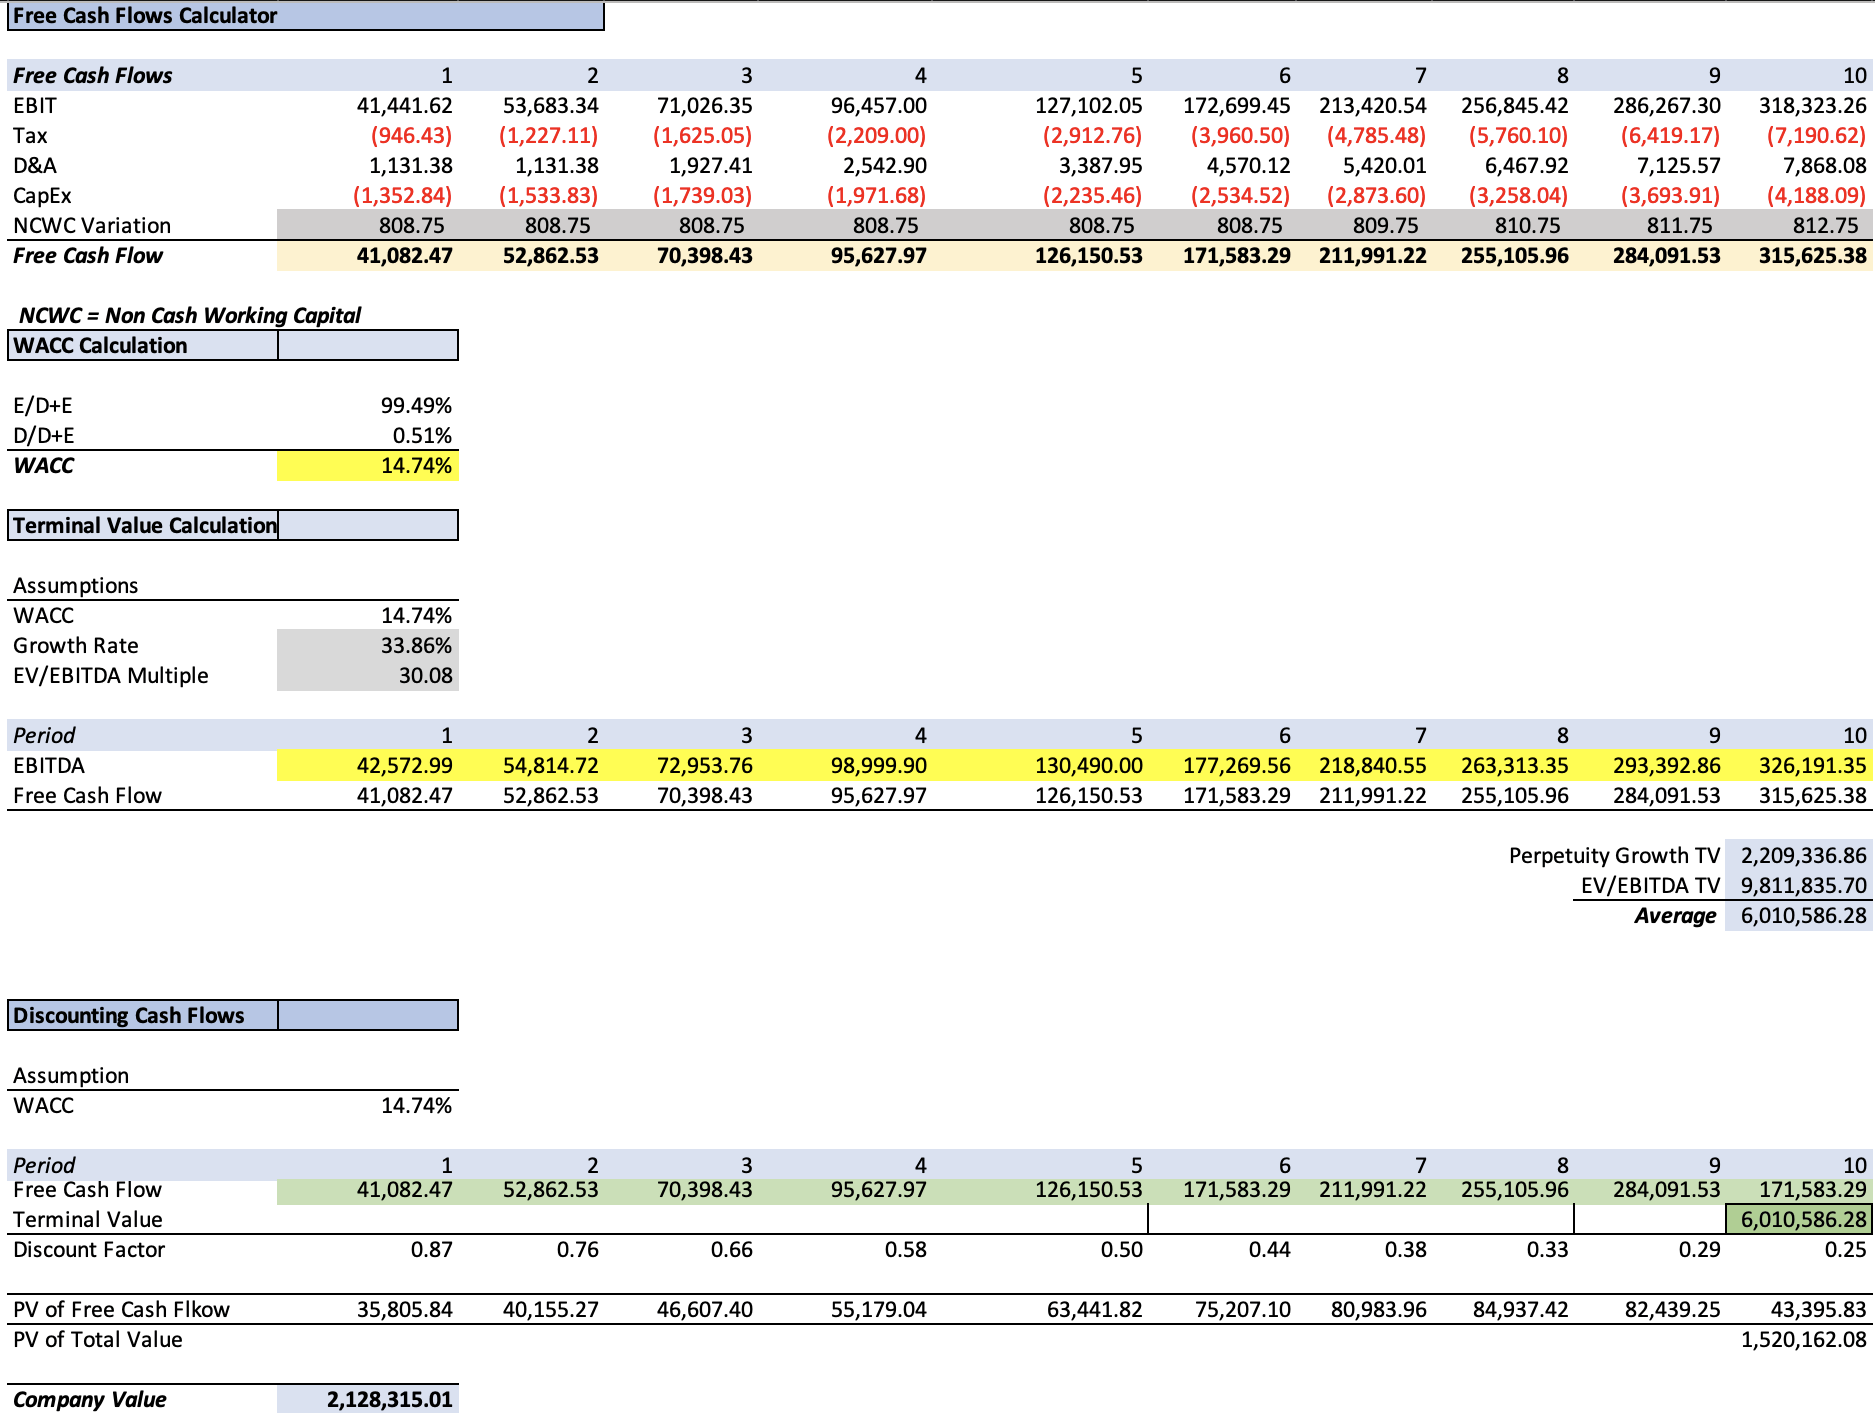

As you can see, the suggested present fair price for Nvidia stands at $877.27, which is a 1.5% upside from the current stock price of $864.02. Then the future stock price for 2033 came out at $3,090.27, which translates into 25.8% annual returns throughout 2033 (which corresponds to FY2034 for Nvidia).
My present fair price estimate for Nvidia has increased significantly since my first coverage. The reasons for this are three: 1)My first two articles were made as 6 years projections, whereas the last two are over 10 years, 2) At the end of 2023 all models needed to take out the year 2023 and replace it with 2033 (or 2029 if it was a 6 years model), which increased the overall amount of cash flows in the model and therefore the fair price, 3) My revenue estimates have been increasing as the company continuously beat on estimates.
Author’s Calculations
Risks to Thesis
The main risk for Nvidia is that the incredible rally that the stock has witnessed has created the perception that it’s a bubble and therefore when there is the smallest doubt, the stock price could be considerably affected. Even though throughout all my coverage on Nvidia I reiterated that Nvidia was fairly valued. Even though other analysts said that the stock was going down because of excessive valuation.
Furthermore, that more companies enter the data center market does not necessarily mean that Nvidia’s data center revenue will shrink dramatically. As long as the market continues to grow at that extraordinary growth rate, Nvidia’s smaller piece could be worth more and more in a pie that becomes bigger and bigger. Nevertheless, if the market decelerates dramatically, then there will be a problem.
Lastly, by no means do I see TSMC’s supply chain as a risk to Nvidia since TSMC is just so big that it’s the market, therefore something that affects this behemoth would affect the entire sector. This means that even if Nvidia manufactured its chips, it would not escape from these headwinds. I think that Nvidia should never start an adventure in chip manufacturing, since it would drill a hole in the near-term financials, and they will need to change the foundry infrastructure very frequently in order to stay updated.
Conclusion
In conclusion, Nvidia continues to be able to justify its current valuation according to my estimates, which has been the case in my precedent articles. In my assessment of the possible impact derived from Nvidia’s four major clients developing their custom AI chips, I concluded that first, those chips would need to be able to compete with the performance of Nvidia’s chips, which is the moat of Nvidia right now. If this wasn’t true, then Intel’s Gaudi 2 would already become the number one AI chip in the market because of its considerably lower price.
After re-evaluating the stock, I arrived at a fair value estimate of $877.27, which is 1.5% above the current stock price of $864.02, and a future price for 2029 of $3,090.27, which implies annual returns of 25.8% throughout 2033. For these reasons, I continue to reiterate my buy rating on Nvidia.
In the upcoming quarters, I will continue to review the performance of its data center and gaming segments, which are the most important to the company in terms of revenue generation
Analyst’s Disclosure: I/we have no stock, option or similar derivative position in any of the companies mentioned, and no plans to initiate any such positions within the next 72 hours. I wrote this article myself, and it expresses my own opinions. I am not receiving compensation for it (other than from Seeking Alpha). I have no business relationship with any company whose stock is mentioned in this article.
Seeking Alpha’s Disclosure: Past performance is no guarantee of future results. No recommendation or advice is being given as to whether any investment is suitable for a particular investor. Any views or opinions expressed above may not reflect those of Seeking Alpha as a whole. Seeking Alpha is not a licensed securities dealer, broker or US investment adviser or investment bank. Our analysts are third party authors that include both professional investors and individual investors who may not be licensed or certified by any institute or regulatory body.