Summary:
- PYPL is looking like a potential turnaround play as management delivered on operational efficiency to start off the year.
- There is a wide margin between the market and future earnings expectations.
- Both my PEG analysis and scenario analysis show that this is an asymmetric risk/reward opportunity.
- As a result, I rate PYPL a buy.
Justin Sullivan
Introduction
PayPal Holdings Inc. (NASDAQ:PYPL) is down ~27% over the past year due to a short-term fluctuation in their EPS that occurred in 2022. Despite these results, PYPL has compounded revenue at 15.74% over the past 5 years and currently has 18 billion in cash on the balance sheet. My valuation approach estimates a fair value of $91.37 for PYPL stock.
Potential Turnaround Opportunity
PYPL’s EPS was down 40% in 2022 as operating expense growth outpaced revenue growth for the year. PYPL also experienced 471 million in other expenses primarily driven by impairment charges on investments. However, the major factor in PYPL’s drop in EPS in 2022 was their increased effective tax rate of 28%. This increase in tax rate was primarily driven by intra-group transfer of intellectual property and lower stock-based compensation expense deductions. The key to assessing a turnaround is to check if things are beginning to change course. I will now compare these results to the most recent quarterly report. For Q1 2023, revenues grew 9% while operating expenses only grew 5%. Other expenses and effective tax rate were both up significantly. However, the operating efficiency derived from the reduction in operating expenses led to an increase in diluted EPS of 61%. My conclusion here is that management is focusing on controllable variables and executing well as their cost optimization is showing meaningful improvement in the bottom line results.
Earnings Expectations
Before I dive into my scenario analysis, I will use this section to explain how I chose my growth assumptions. As we can see from the chart above, consensus expectations are for EPS to rebound in 2023 and then continue to grow from there. Overall, the implied EPS CAGR from 2022 to 2027 is 34.56%. I will use this as the growth rate in my best case scenario, which is only assigned a probability of 10%. I will use a growth rate of 25% for my base case to be conservative relative to consensus expectations.
Valuation & Scenario Analysis
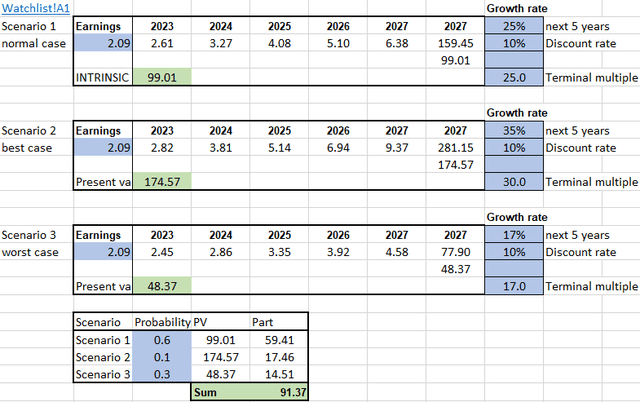
For all my calculations of value, I will be using a discount rate of 10%. 10% is my minimum required return because this has historically been the return you can expect if you decide to just put your money in an index fund that tracks the S&P 500. Lastly, keeping the discount rate the same allows for comparability between different investments.
Also, I assign a weight of 60% to my base case, 10% to the best case, and 30% to my worst-case scenario. With that out of the way, I will move to the individual scenarios.
Scenario 1 is my base case, which assumes 25% growth for the next 5 years with a terminal multiple of 25x. Discounting the 2027 sales price back to present value yields a fair value of $99.01 for an investor with a target return of 10%.
Scenario 2 is my best case, which assumes 35% growth for the next 5 years with a terminal multiple of 30x. Discounting the 2027 sales price back to present value yields a fair value of $174.57 for an investor with a target return of 10%.
Scenario 3 is my worst case, which assumes 17% growth for the next 5 years with a terminal multiple of 17x. Discounting the 2027 sales price back to present value yields a fair value of $48.37 for an investor with a target return of 10%.
The sum of the weighted PVs is $91.37, implying ~47% upside from current prices.
PEG Analysis
I like to use PEG analysis to determine what the market is currently pricing in the stock and compare that to what consensus estimates are. If I take the average of the 5 years of estimates from the chart in my earnings expectations section, I get 6.75. Based on the current stock price, PYPL currently trades at 9.18x this number. However, as we have already established, consensus estimates say that EPS will grow at 34.56% over the next 5 years. When comparing the multiple of 9.18x and the eps growth of 34.56% we can see that there is a wide disconnect between the market and analysts’ estimates. The PEG based on these numbers is 0.27x. This large margin is something I like to see for buy ratings as even if analyst estimates are off, you have a margin of safety to protect you.
Risks
Interest Rate Risk
PYPL holds an investment portfolio that could be negatively affected by continued interest rate increases.
Competitive Risk
PYPL experiences heavy competition from other digital payment services. They will need to retain and gain market share in order to deliver on growth expectations.
Recession Risk
If business activity declines, PYPL could experience a decline in the number of transactions on their platform. This could temporarily depress PYPL’s results.
Conclusion
Overall, PYPL is attractive as a potential turnaround opportunity. Q1 results show promise as management has delivered revenue growth outpacing operating costs. My scenario analysis shows that this is an opportunity with asymmetric risk/reward. The base case has ~60% upside while the worst case has ~23% downside. I target a ratio of at least 2.0x for my buy ratings.
As a result, I rate PYPL stock a Buy.
Analyst’s Disclosure: I/we have no stock, option or similar derivative position in any of the companies mentioned, and no plans to initiate any such positions within the next 72 hours. I wrote this article myself, and it expresses my own opinions. I am not receiving compensation for it (other than from Seeking Alpha). I have no business relationship with any company whose stock is mentioned in this article.
Seeking Alpha’s Disclosure: Past performance is no guarantee of future results. No recommendation or advice is being given as to whether any investment is suitable for a particular investor. Any views or opinions expressed above may not reflect those of Seeking Alpha as a whole. Seeking Alpha is not a licensed securities dealer, broker or US investment adviser or investment bank. Our analysts are third party authors that include both professional investors and individual investors who may not be licensed or certified by any institute or regulatory body.


