
Summary:
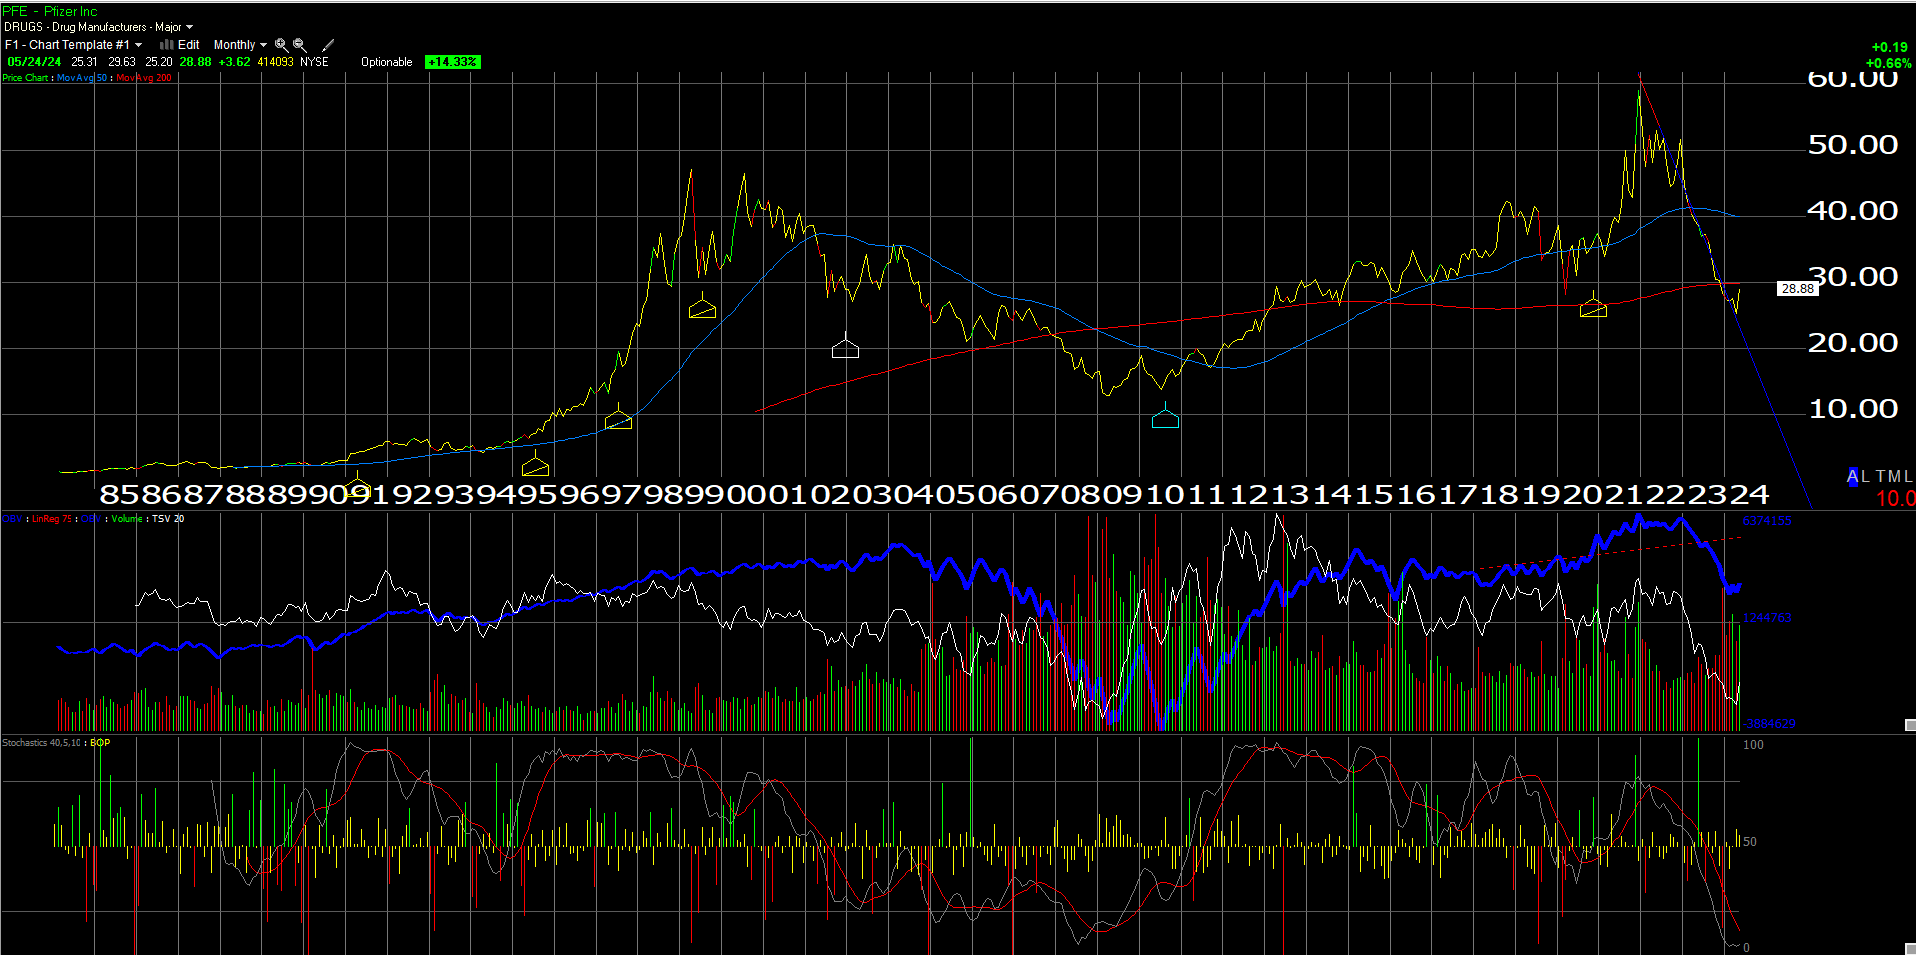
- A monthly chart of PFE using Worden’s TC2000 Gold shows the stock oversold on a monthly basis.
- A stock with a 5.8-6% dividend yield in today’s market immediately draws attention.
- Is the dividend sustainable, and will the pharma giant be able to sustain the current $0.42 per quarter ($1.68 per year) dividend pace and also continue to boost that dividend at a $0.04 per year (one penny per quarter) rate?
JHVEPhoto

A couple of weeks ago, this blog’s technician (Gary S. Morrow) shot me a message, noting that he thought Pfizer (NYSE:PFE) was putting in a longer-term bottom.
The above chart, which is a monthly chart of PFE using Worden’s TC2000 Gold (and is not the chart that was sent to me), shows the stock “oversold” on a monthly basis, and not that many stocks ever get truly oversold on a monthly basis, so you can say it’s an important technical indicator when it happens. Looking at the bottom third of the above chart, that bottom third panel denotes “overbought vs. oversold”. Looking at the lower third of PFE, you can see how the stock became overbought in the 2020 through 2022 period, when revenue spiked to over $100 billion by the end of 2022, thanks to Paxlovid and Comirnaty’s demand for the Covid vaccine, and now has fallen back to oversold (even more oversold than 2008) again, as annual revenue is projected at $60 billion in calendar ’24 and then $62.7 billion in calendar ’25.
Not to bury the lede, but a stock with a 5.8-6% dividend yield in today’s market immediately draws attention.
Is the dividend sustainable, and will the pharma giant be able to sustain the current $0.42 per quarter ($1.68 per year) dividend pace and also continue to boost that dividend at a $0.04 per year (one penny per quarter) rate?
To keep this brief, I do think the dividend is safe (for now).
The Pfizer common stock dividend in dollars per year is a little over $9 billion being returned currently to shareholders. Pfizer still sports an investment-grade credit rating of A / A2 and A by Standard & Poor’s, Moody’s, and Fitch respectively, which is important, since currently PFE’s free cash flow generation, which has fallen to $4.7 billion and $5.1 billion respectively the last two trailing quarters, isn’t covering the dividend. (Share repurchases are a pipe dream in 2024. PFE used the pandemic and the spike in revenue to $100 billion and free cash flow to $29.8 billion as of the September ’21 quarter to buy back a lot of stock, so don’t count on any share repurchases in the immediate future or the even next few years.)
While I do think the dividend is sustainable at its current level, and PFE management may decide to just maintain the $1.68 per year and not increase the dividend annually, the $30 billion in long-term debt issued for Seagan doubled PFE’s total outstanding term debt to $61-62 billion, along with the pharma giant now sporting $132 billion of goodwill and intangible assets on the balance sheet, comprising nearly 60% of PFE’s total assets of $221 billion.
There is no question the stock is a little gamey with the Covid revenue dissipating (Paxlovid is expected to contribute at a higher rate than Comirnaty, since it’s targeted to higher-risk patients, with Comirnaty revenue falling 90% from Q1 ’23 to Q1 ’24) and while investors await Seagen’s potential contributions.
Morningstar did note that Pfizer is on track for $4 billion in cost cuts in ’24, which represents 50% of the current dividend payout in dollars.
Completely removing the pandemic period’s influence on PFE’s cash flow and free cash flow, and looking back pre-Covid, here’s what the numbers show readers for PFE’s cash flow and free cash flow (FCF):
- 2019: $12.5 billion in cash flow and $10.4 billion in FCF
- 2018: $15.8 billion in cash flow and $13.8 billion in FCF
- 2017:$16.8 billion in cash flow and $14.8 billion in FCF
- 2016: $12.4 billion and $10.9 billion
- 2015: $14.5 billion and $13.1 billion
Summary / conclusion
The first technical level that I’d like to see PFE trade back above (and remain above) is that 200-month moving average at $29.85-30.00 per share.
The stock’s valuation in terms of EPS estimates are currently expecting $2.35 in ’24 and $2.73 in 2025, leaving PFE trading 11x and 10x those estimates for expected growth of 28% in ’24 and 16% in ’25. While that might sound great, the estimates (looking back to the middle part of last decade) show PFE earning in the low $2’s to the high $2’s for that decade. In other words, PFE looks to be returning to where it was from an earnings perspective 10 years ago, even though revenue estimates look to be a little higher.
The stock is not yet a big holding for clients, but is held in more conservative accounts with more interest in dividend and interest income. A 4.8-5% dividend yield is about on par with where investment-grade ETFs (PFE’s current 4.8% dividend yield is almost exactly what Vanguard’s Intermediate-Term Bond ETF (BIV) is yielding, but with a mid-A credit rating, PFE that is.)
From a portfolio construction standpoint, Pfizer is one of those stocks that is trading at 2014 levels, and thus is “uncorrelated” with the AI crowd, the Mega Cap 7 and the S&P 500 concentration. In other words, it’s a name that might just shine (i.e., outperform) in the next equity bear market, but readers need to stay abreast of the fundamentals and do your homework, making sure free cash flow remains sufficient for that dividend payout.
Readers should use the multi-year low for PFE of $25.23 in April of this year as your stop loss.
The real fundamental driver, in my opinion, will be what Pfizer can squeeze out of Seagen, both in terms of cost savings and patented drug product. That acquisition could drive substantial EPS growth if the Seagen pipeline is any good.
Past performance is no guarantee of future results. This is an opinion on PFE’s dividend, but that can change quickly. All EPS and revenue figures for Pfizer are provided by LSEG.
Thanks for reading.
Editor’s Note: The summary bullets for this article were chosen by Seeking Alpha editors.