Summary:
- Qualcomm reported strong Q2 earnings, surpassing analyst expectations with adjusted per-share earnings of $2.44 and adjusted revenues of $9.39 billion.
- The company’s handset sales and automotive segment showed strong growth rates, while IoT revenues shrank by 11%.
- The stock’s surging bullish momentum could continue, based on technical indicators and positive quarterly earnings and investors should consider buying on short-term declines.
AutumnSkyPhotography
For the second quarter, QUALCOMM Incorporated (NASDAQ:QCOM) posted strong quarterly results, with adjusted per-share earnings of $2.44 (soundly surpassing analyst expectations of $2.32 per share) and adjusted revenues of $9.39 billion (modestly surpassing consensus estimates of $9.34 billion for the period).
Quarterly Results And Guidance (Qualcomm, Inc.)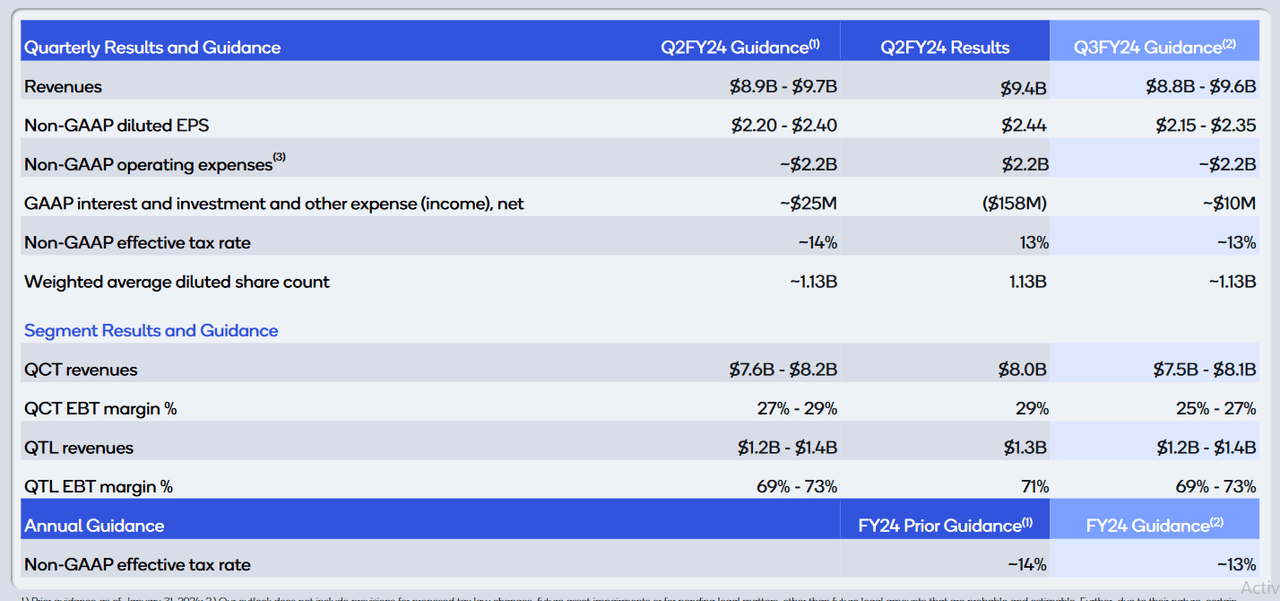
The smartphone hardware components company also recorded per-share net income of $2.06 (at $2.33 billion), indicating annualized gains of nearly 21.2% when compared to the $1.52 per share ($1.7 billion) Qualcomm reported during the same quarter the previous year. For the current period, the company expects to see quarterly sales fall within an $8.8-9.6 billion range (against consensus expectations of $9.05 billion), with per-share earnings falling within the $2.15-2.35 range (beating consensus expectations of $2.17).
Quarterly Results (Qualcomm, Inc.)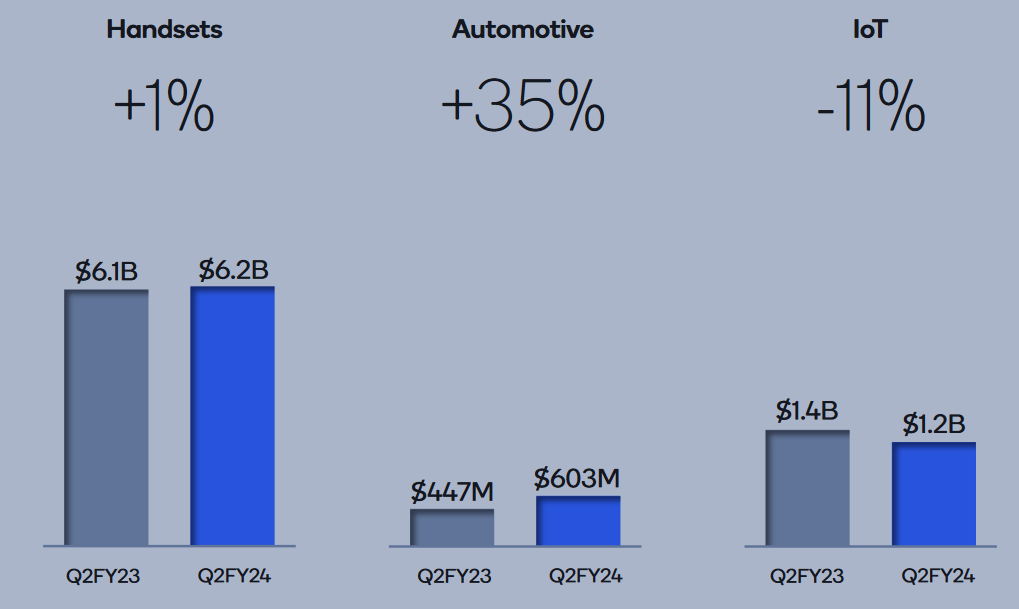
With Qualcomm, most of the attention tends to center around the company’s handsets segment. Qualcomm’s handset sales posted at $6.18 billion (indicating annualized gains of 1% for the period) and this largely suggests that trends in this part of the market might be stabilizing following various instances of weakness during the post-pandemic period. Perhaps most surprising were Qualcomm’s sales figures related to smartphone manufacturers in China, where annualized growth rates posted at roughly 40% for the quarter. Somewhat similar growth rates were also visible in Qualcomm’s automotive segment, where sales of $603 million indicated growth rates of 35% for the period. On the downside, the company’s IoT revenues shrank by 11% during the quarter (at $1.24 billion), indicating sales weaknesses in less expensive processing components and processors used in virtual reality products.
QCOM Monthly Chart: Prior Resistance Level (Income Generator via TradingView)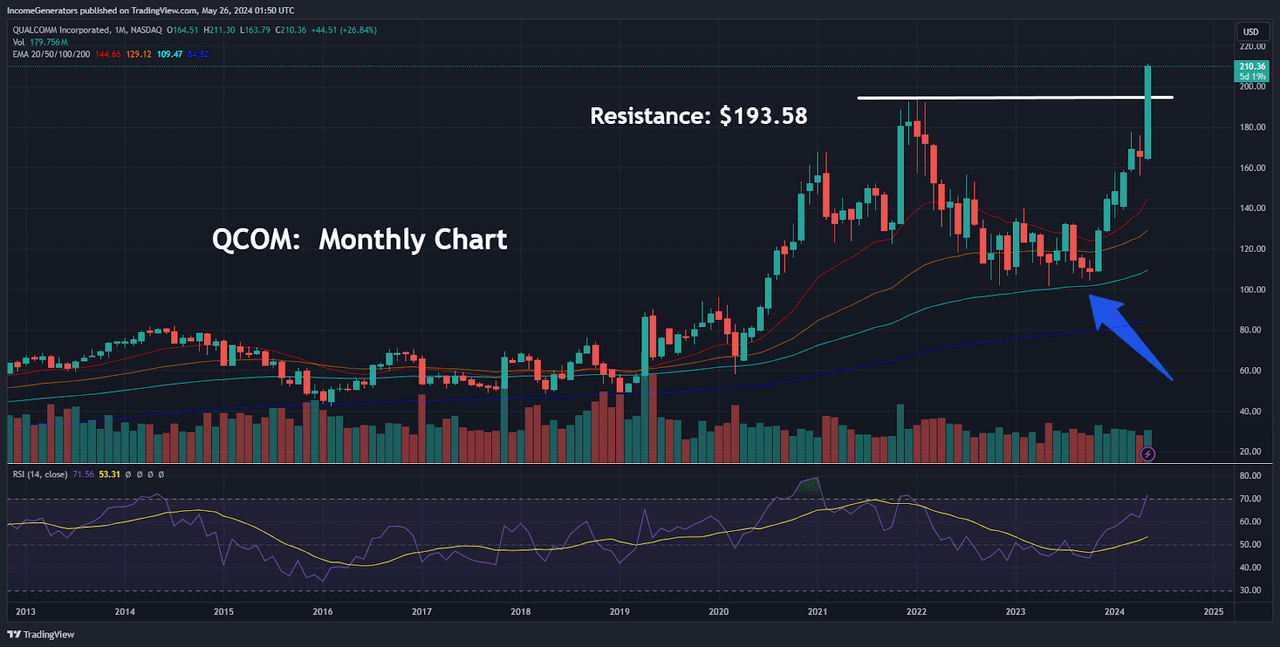
On balance, these quarterly figures are quite encouraging – and it is not entirely surprising to see QCOM share prices continuing to move higher. However, the surging strength of the stock’s current uptrend might be surprising to some investors because we have already blown past important long-term resistance levels on the monthly charts. Specifically, we have outlined Qualcomm’s January 2022 highs as the stock’s main long-term resistance level, and we can see in the chart above that the current uptrend has had relatively little trouble recording new all-time highs this month. Given the strength of the May 2024 candle, we believe that the stock’s surging bullish momentum has the potential to continue. Further evidence pointing in this positive direction can be found in the monthly indicator readings in the Relative Strength Index (RSI), which has not reached severely overbought territory. Additionally, share prices were able to find strong support near the 100-month exponential moving average – and we believe that this type of price action could limit potential declines in share prices going forward.
QCOM Weekly Chart: Downtrend Breaks (Income Generator via TradingView)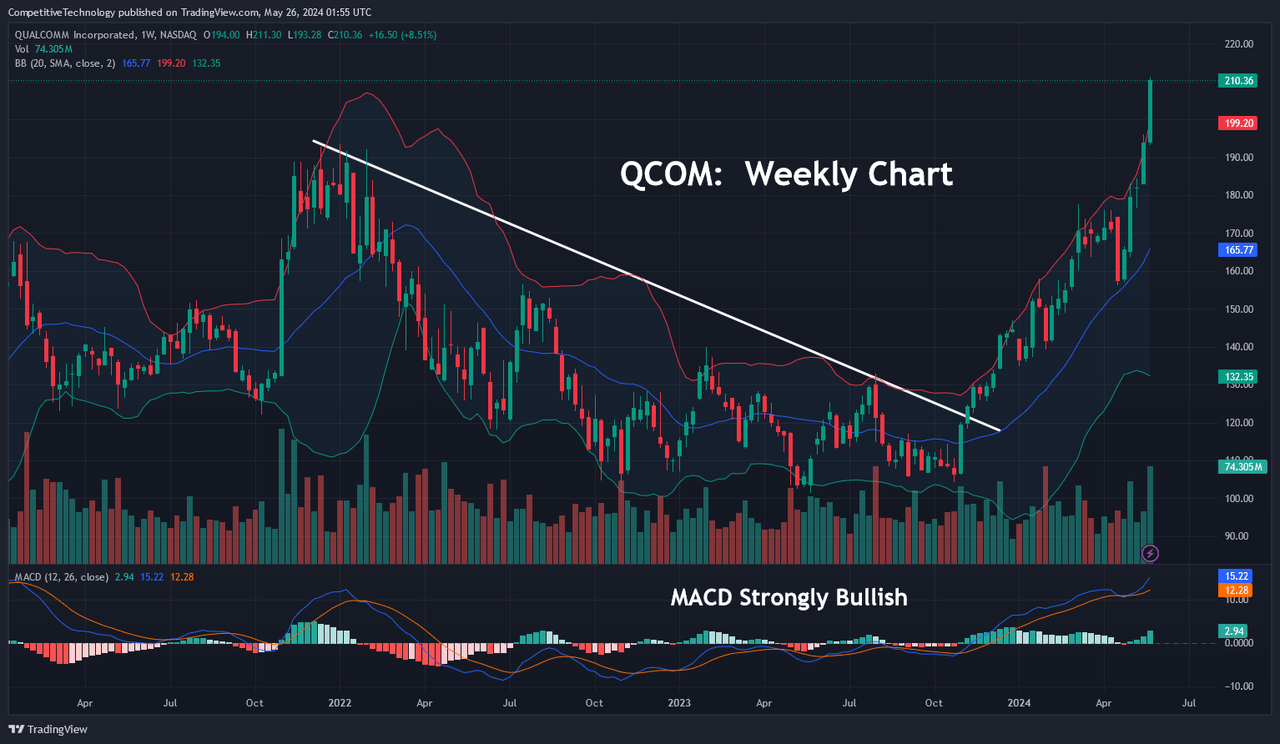
In highlighting the technical price action events that ultimately led up to this point, we can see that a developing downtrend on the weekly charts began to break near the end of 2023, just as weekly indicator readings in the Moving Average Convergence Divergence (MACD) began to turn positive. Clearly, this confluence of bullish signals helped the stock establish a solid foundation near the beginning of this year, and we are currently seeing very little evidence of weakness when looking at this stock’s price history from multiple timeframe perspectives. Weekly MACD readings remain strongly bullish, and we think this is another reason to believe that downside corrective moves in this stock might be somewhat limited near-term.
QCOM Weekly Chart: Moving Average Support (Income Generator via TradingView)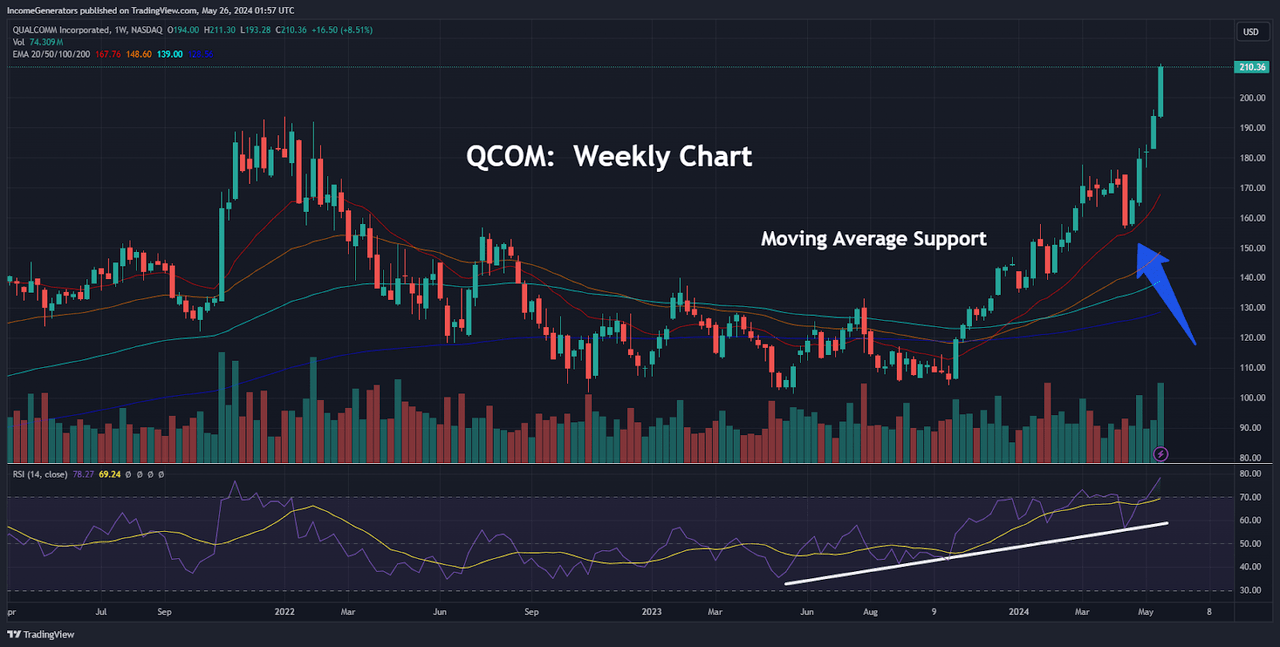
Another factor to consider would be the frequency with which QCOM share prices seem to be finding support near long-term moving averages. In the first price chart, we saw a clear example of this positive activity near the 100-month exponential moving average. In the chart above, we can see a similar example of strong buying activity as share prices dropped toward the 20-week exponential moving average. Also in this chart, we can see that the stock’s exponential moving average cluster (composed of the 20-week, 50-week, 100-week, and 200-week exponential moving averages) is also beginning to slope strongly in the upward direction. Ultimately, this suggests that share prices are likely to continue finding support at higher levels. RSI readings are also strongly bullish on this timeframe, but we should point out that this indicator reading has finally moved into the overbought territory – and this suggests that we might at least need to see a period of sideways consolidation before share prices can take the next leg higher.
QCOM Daily Chart: Potential Downside Targets (Income Generator via TradingView)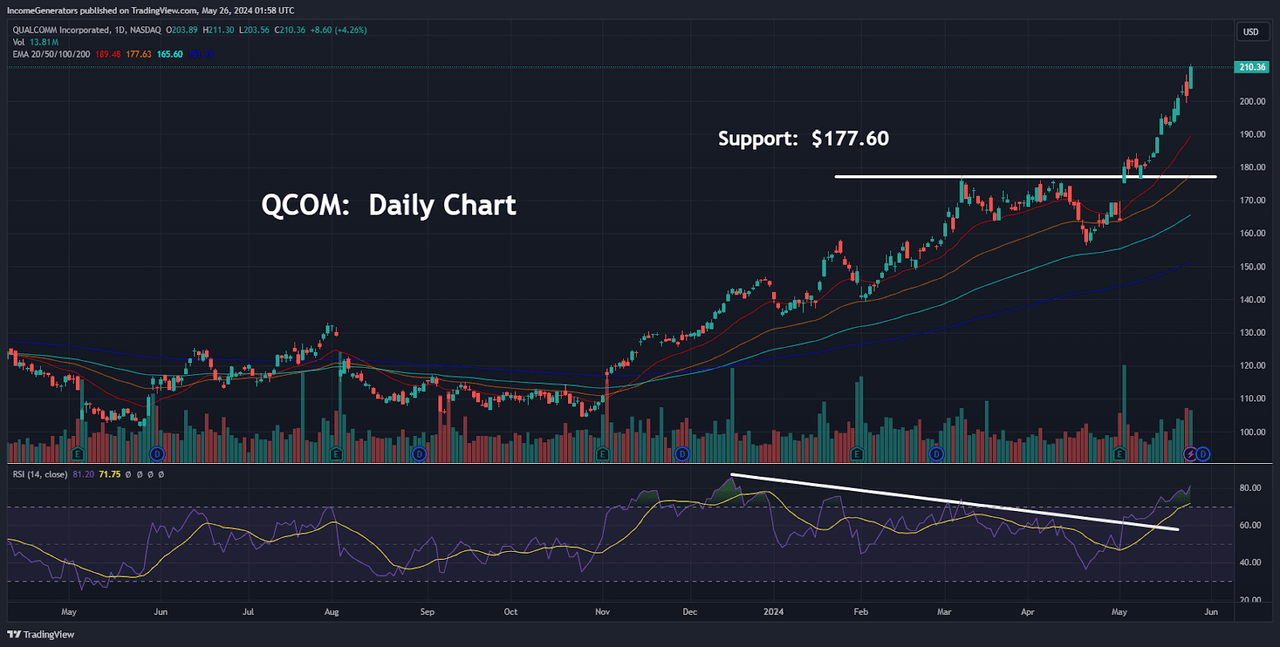
Finally, we will move down to the daily charts, so that we can identify possible levels of support to the downside in the event that our main stance is incorrect, and share prices begin to sharply reverse from here. Specifically, we have outlined the March 2024 highs near $177.60 as a bearish downside target. As we can see, this price level also aligns with the 50-day exponential moving average, and this gives the region an increased level of validity as a potential downside target if QCOM prices fall back below $200 per share. One factor that seems to be making this bearish outcome less likely, however, would be the broken downtrend in the daily RSI readings. But, at the same time, those indicator readings have moved well into the overbought territory – and this tells us that the stock’s recent moves higher might require a period of consolidation (or even downside corrective retracements) before QCOM can continue with the resumption of the broader uptrend. For these reasons, the daily timeframe currently looks least constructive when compared to the longer-term outlook for this stock – but this is the type of scenario that will often lend itself quite well to buying-on-dips strategies. Overall, Qualcomm’s share price performance this year has been nothing short of impressive. Surging share price valuations have easily overcome prior resistance levels, and pullbacks from the highs have been quite limited. We are seeing some evidence of potential trend exhaustion on the daily charts, but it remains clear that most of the price momentum is strongly focused on the bullish direction. Qualcomm’s most recent quarterly earnings figures remain supportive of this outlook, so it is our view that investors should look for instances of short-term decline in order to build long positions at more favorable levels.
Analyst’s Disclosure: I/we have a beneficial long position in the shares of QCOM either through stock ownership, options, or other derivatives. I wrote this article myself, and it expresses my own opinions. I am not receiving compensation for it (other than from Seeking Alpha). I have no business relationship with any company whose stock is mentioned in this article.
Seeking Alpha’s Disclosure: Past performance is no guarantee of future results. No recommendation or advice is being given as to whether any investment is suitable for a particular investor. Any views or opinions expressed above may not reflect those of Seeking Alpha as a whole. Seeking Alpha is not a licensed securities dealer, broker or US investment adviser or investment bank. Our analysts are third party authors that include both professional investors and individual investors who may not be licensed or certified by any institute or regulatory body.
