
Summary:
- Southwest Airlines had a consistent track record of profitability until the COVID-19 pandemic disrupted its operations.
- The airline lost its position as the largest domestic air carrier in the US and now ranks third.
- Southwest has focused on operational efficiency and has the lowest operating cost per available seat mile among major US domestic airlines.
- Airline financial metrics have yet to cyclically bottom, and a recession will cause further financial stress.
Boarding1Now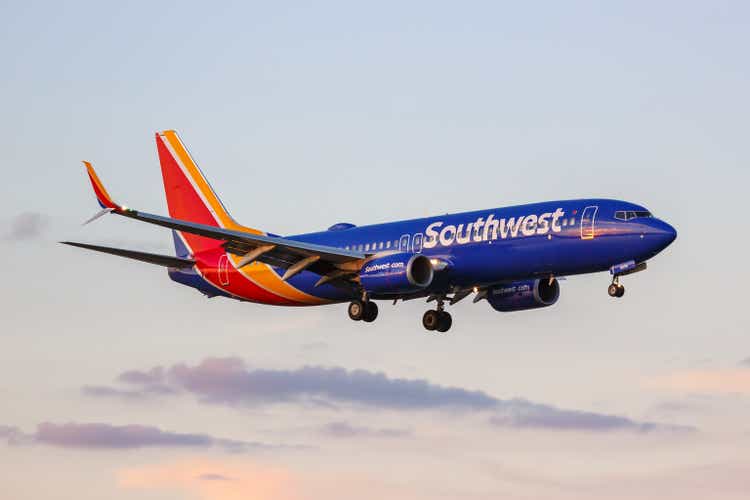
Company Description
Prior to the COVID-19 pandemic, Southwest Airlines (NYSE:LUV) had an unusual track record of consistent profitability. Until FY2020 it had never reported an operating loss. Its profitability record is extremely rare in the airline sector.
COVID not only interrupted its unbroken profitability record but Southwest also lost its place as the largest domestic air carrier in the US (as measured by the number of domestic originating passengers boarded) and it has now fallen to 3rd place (source: U.S. Department of Transportation).
The company does not report revenues by route and it has only one reportable operating segment, but it does provide the following break-down as shown below for FY2022:
Author’s compilation using data from Southwest Airlines’ 10-K filing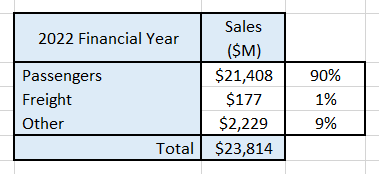
Southwest has essentially grown organically by increasing the number of cities that it services. Throughout its history, there have only been three, relatively small, acquisitions – the last of which was in 2011.
The cornerstone of Southwest’s strategy has been a focus on operational efficiency. Its goal was to be the lowest-cost operator of the major US domestic airlines. For the most part, the company has achieved its efficiency goals and management has been historically very “process” focused which has ensured that the company achieved its operating objectives.
The US domestic low-cost operating segment airlines comprise Alaska Airlines (ALK), JetBlue (JBLU), Spirit (SAVE), and Southwest Airlines. According to the US Department of Transport’s most recent data, Spirit has the lowest operating cost. To a large degree, Southwest has outgrown this group – Southwest’s operations are nearly 4 times larger than Spirit.
Southwest has the lowest operating cost per available seat mile of the four major US domestic airlines comprising Delta Air Lines (DAL), United Airlines (UAL), and American Airlines (AAL).
Southwest achieves its comparatively low operating cost by only having one aircraft type and by operating a predominantly point-to-point route service (a hub and spoke model is favored by its competitors). This has led to:
- Greater volume purchasing power with the aircraft supplier.
- Lower levels of maintenance spares.
- Lower crew training costs.
- High asset and crew utilization through a combination of better scheduling and the use of smaller less congested airports which enables faster turnaround times.
- Improvement in fuel efficiency through fleet modernization and focused operating pathways.
US Domestic Airline Sector Overview
I have used two data sources to develop historical and current airline comparisons:
The U.S. Department of Transportation “(DOT)” is a very rich source of present-day data for the US Airline sector. The DOT provides a website called Bureau of Transportation Statistics.
The Massachusetts Institute of Technology “(MIT)” is a very useful source of historical airline industry data. MIT has a Global Airline Industry Program which compiles data from the sector participants and makes it publicly available.
The airline sector measures available capacity in terms of the number of seats available for passengers. It then multiplies this number by the number of miles flown by the aircraft when they are available to carry passengers. This metric is called Available Seat Miles “(ASM)”.
When an available seat is used by a fare-paying passenger the number of miles traveled by the passenger becomes a measure of usage called Revenue Passenger Miles “(RPM)”.
The following chart shows the total volume of passengers carried in the Domestic US market since 2004:
Author’s compilation using data sourced from U.S. Bureau of Transportation Statistics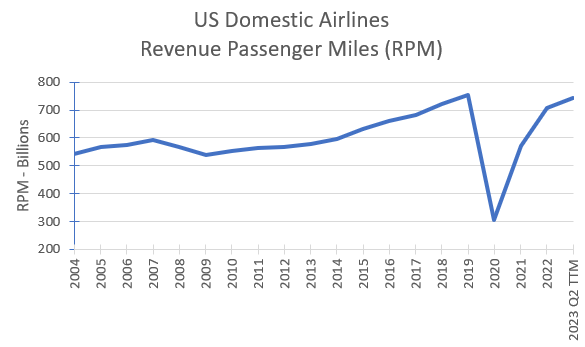
The airline sector is cyclical and demand is heavily influenced by the health of the economy. This can be seen by the downturn in passenger numbers during the global financial crisis in 2008 to 2009 (unfortunately the dip in GFC demand is dwarfed by the impact of the COVID shutdowns).
The sector recovered reasonably well post the GFC and demand grew by 3.4% per year between 2009 and 2019. The relatively modest demand growth rate is in line with the growth of the economy and indicates that the sector is mature.
The curtailment of travel during the COVID pandemic makes it difficult to analyze the recent performance of the airline sector relative to the long-term trends. The above chart indicates that demand and capacity have only recently returned back to pre-COVID levels.
Post COVID, there has been a worldwide surge in demand for travel services but the data indicates that the airlines have been very careful in returning capacity back into the networks (or were unable to ramp up capacity due to equipment and labor constraints).
The following chart shows the market share of the 4 largest domestic airlines since 2013 based on their US domestic revenue passenger mile comparisons:
Author’s compilation using data from U.S. Bureau of Transportation Statistics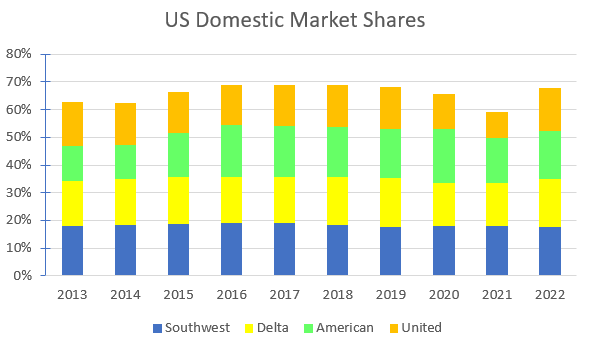
The data indicates that, except for the COVID disruptions, the domestic market share of the major airlines has been quite stable both at the aggregate and individual levels. The last of the major airline market consolidations took place in 2015 when US Air merged with American Airlines.
The chart indicates that the market appears to be reasonably “orderly” and the major airlines are no longer taking significant share from each other or from the remaining smaller operators.
Airline profitability is particularly sensitive to volume. All airlines utilize sophisticated IT systems to manage ticket pricing and capacity utilization. Fares can rise and fall very quickly depending upon demand and supply.
The following chart shows the industry’s aggregate domestic US route revenues and operating margins since 2013:
Author’s compilation using data from U.S. Bureau of Transportation Statistics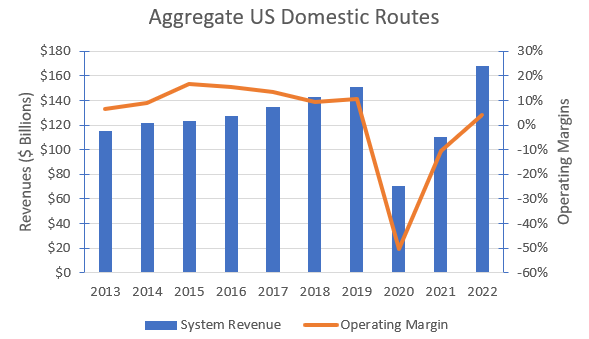
Prior to COVID, system revenues grew at 4.5% per year between 2013 and 2019.
Note that the publicly reported airline operating earnings during COVID were higher than what is shown in the chart. Individual airlines were given government COVID payments which were used to ensure that the airlines maintained their workforce numbers whilst not bankrupting themselves. The BOT data does not include these payments.
Southwest Airlines’ Historical Financial Metrics
Revenues and Operating Margins
Southwest’s consolidated historical revenues and adjusted operating margins are shown in the chart below:
Author’s compilation using data sourced from Southwest Airlines’ 10-K filings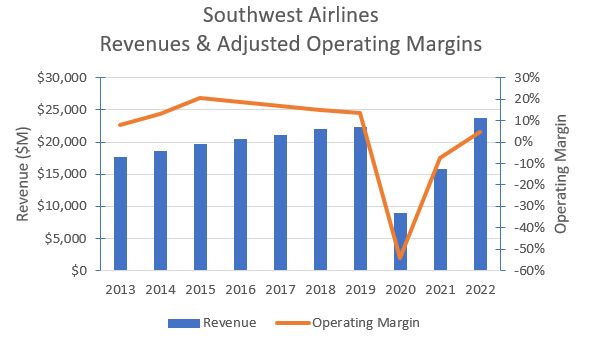
It should be noted that the operating margins have been adjusted for the impact of the change in accounting standards for the treatment of operating leases prior to FY2019. I have also excluded any government COVID payments in the operating result.
The chart shows three distinct periods: pre-COVID, COVID, and post-COVID. Prior to COVID, revenues were growing at 4% per year and operating margins on average were around 15%. The COVID years (FY2020 and FY2021) saw lower revenues and consequently operating losses. FY2022 saw revenues return to the pre-COVID growth trajectory but margins have not fully recovered.
The following chart shows Southwest’s revenues and operating expenses on a per revenue passenger mile “(RPM)” basis over the same period:
Author’s compilation using data sourced from the U.S. Bureau of Transportation Statistics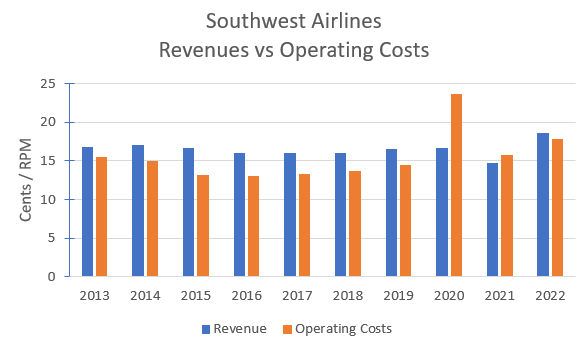
The chart shows that Southwest’s current revenue and operating costs per RPM are now significantly higher than before the COVID pandemic.
Airline margins are currently lower than normal because Southwest (along with its competitors) has not been able to raise prices in the same proportion that costs have increased without sacrificing volume.
The following chart indicates that Southwest’s costs have increased across all their reported cost buckets (for ease of viewing I have aggregated the smaller cost buckets):
Author’s compilation using data sourced from U.S. Bureau of Transportation Statistics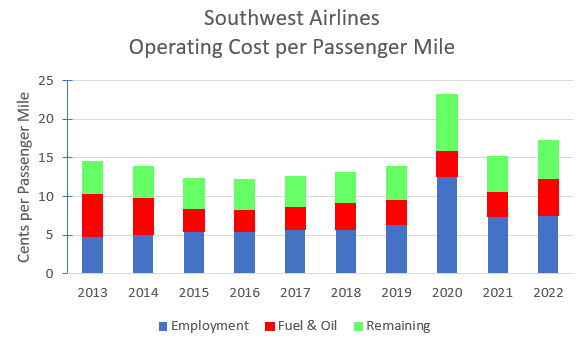
Labor and fuel are very important cost drivers in the airline industry and the data indicates that both are currently significantly higher than historical levels. Although fuel costs are high, the current price of fuel has been at these levels before. It is labor costs which are currently most unusually high.
Cash Flows
The following table summarizes Southwest’s cash flows for the last 10 years:
Author’s compilation using data sourced from Southwest Airlines’ 10-K filings
Once again the data trends have been severely impacted by the distortions caused by the COVID pandemic.
Prior to the pandemic, Southwest was generating sufficient free cash to be able to fund, on average, nearly $2 billion of share buy-backs and consistently raise its dividend each year whilst only modestly increasing its debt level.
Airline operations were partially shut down during COVID. This left the companies vulnerable to potentially becoming bankrupt. Southwest was forced to raise new equity and take on additional debt (some of it from the government and the remainder from the public in the form of convertible notes) in order to strengthen its balance sheet.
At the time of writing this report, quarterly dividend payments have restarted but the company is not yet generating sufficient free cash to restart its share buy-back program. I expect that the first priority for any excess cash will be to retire a portion of the debt before any cash is diverted to buy back stock.
Capital Structure
The following chart shows the history of Southwest’s capital structure:
Author’s compilation using data sourced from Southwest Airlines’ 10-K filings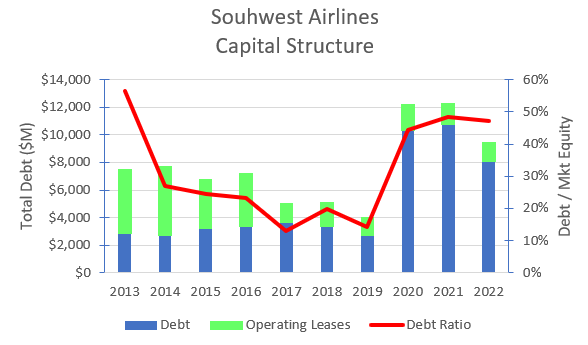
There are several things to note from this chart:
- Prior to COVID, Southwest’s debt ratio swung from a high of 56% to a low of 13% with only modest changes in debt levels. This is a function of the historical volatility in Southwest’s share price (which is typical for all airline companies).
- COVID has caused Southwest (and the entire airline sector) to take on unprecedented levels of new debt.
I estimate that the global median debt ratio for the airline sector is currently 132%. Southwest has always been very conservatively geared compared to its peers. I estimate that Southwest’s current debt ratio is in the sector’s lowest decile. Compared to its peers, Southwest has an extremely strong balance sheet.
Return on Invested Capital
The following chart shows the history of Southwest’s return on invested capital “(ROIC)”:
Author’s compilation using data sourced from Southwest Airlines’ 10-K filings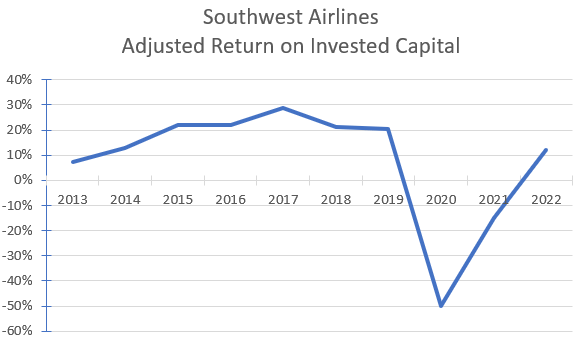
The chart is obviously distorted by the operating losses sustained through the COVID pandemic. For obvious reasons, there is a strong link between the volatility in operating margins and the volatility in the ROIC.
It is for this reason that I believe that airline stocks are not suited to a buy and hold investing strategy.
These stocks, however, are wonderful for trading as shown in the following chart which shows Southwest’s share price over the last 10 years:
TradingView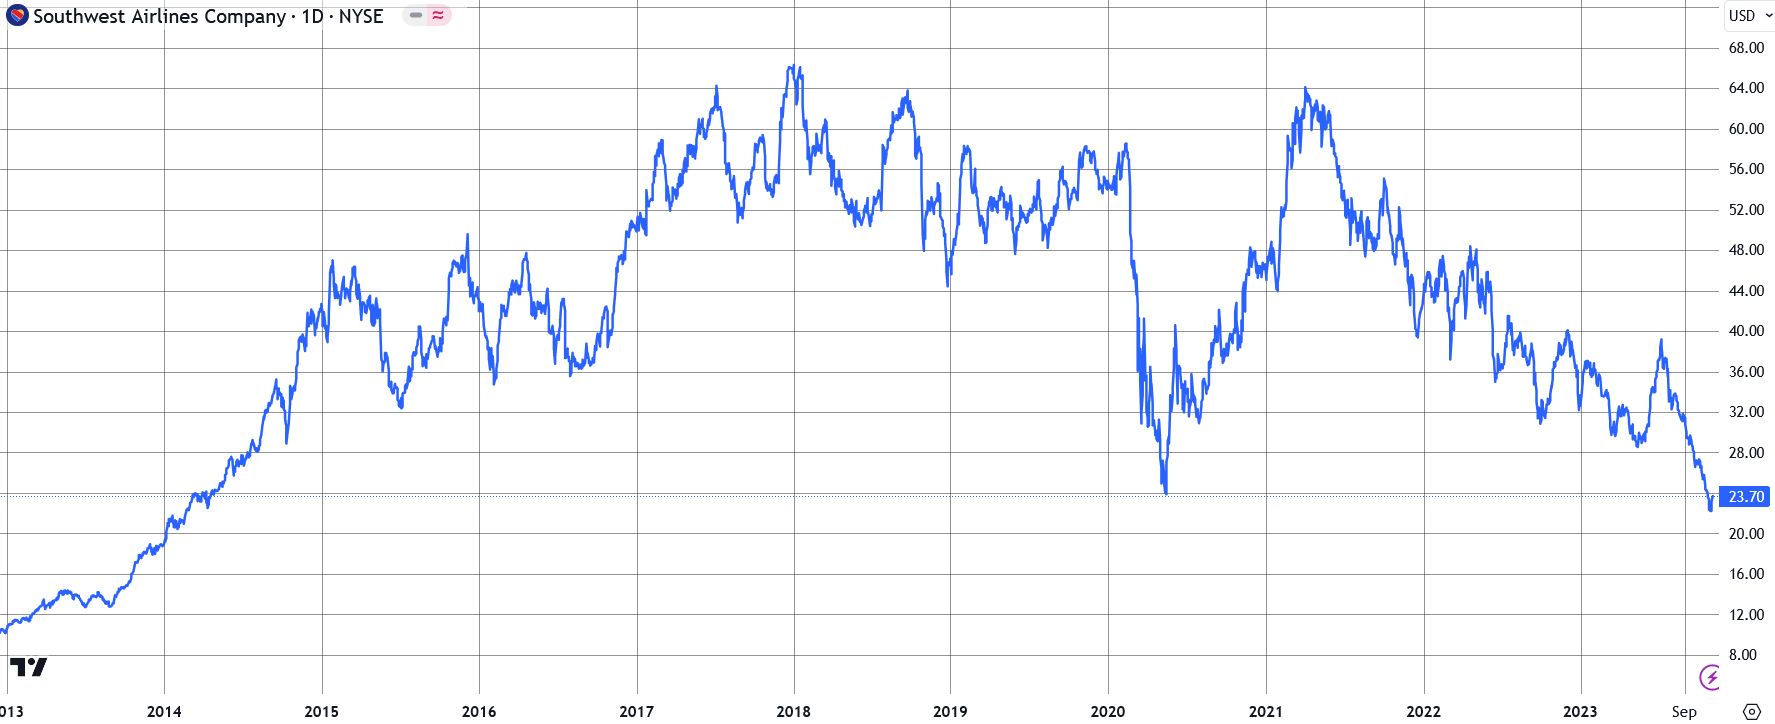
The current share price is at a 10-year low. The chart shows that, over the last 10 years, there have been at least three occasions where the stock has provided investors with the opportunity to make large trading profits (similarly there have been at least two occasions where investors have suffered massive price draw-downs).
Valuing Cyclical Companies is Very Challenging
Cyclical companies have very uncertain and volatile cash flows due to external macro-economic factors. These uncertainties impact both mature and relatively young cyclical companies.
The risks involved in valuing cyclical companies are associated with the perspective of where the company currently sits in relation to the economic cycle and the starting point for the valuation.
At the top of the economic cycle, these companies will generally look very cheap (margins and growth will both be high), and at the bottom of the cycle, these companies will often look very expensive (margins and growth will often be negative).
Professor Damodaran in his book “The Dark Side of Valuation” provides us with some advice and guidance in valuing cyclical companies. He warns about not focusing on the most recent year’s financial metrics (called base year fixation):
“In summary, locking in earnings, reinvestment, and cost of capital numbers from the most recent year for a cyclical firm is a recipe for erroneous valuations.”
Damodaran recommends that analysts use a normalized approach to the valuation where the inputs are the cycle average or cycle mid-point estimates for operating margins, growth rates, reinvestment, and discount rates.
This is the approach that I have adopted.
My Investment Thesis for Southwest Airlines
At the time of writing this report, the company has just reported its Q3 earnings. At the end of FY2023 Q3, trailing 12-month “(TTM)” revenues were growing at 12% (this relatively high number is due to COVID-impacted comparisons) and the adjusted operating margin was 1.5%.
The current consensus revenue forecast for FY2023 is $26,110 M (9.6% above FY2022) and it is projected that FY2024 revenues will increase by 8.2% over FY2023.
I think that the FY2023 forecast looks quite reasonable but the FY2024 forecast may prove to be very optimistic if the US economy were to enter more difficult times.
My scenario for Southwest Airlines:
Growth Story
The US domestic airline market is mature, and the larger airlines are all growing revenues at a similar rate. Although an economic slowdown would probably cause revenues to decline in the near term, I expect that the long-term growth rate for the sector will be between 4% to 6% per year.
Airline companies are reasonably highly geared which makes them susceptible to financial stress during challenging economic times. This may mean that airlines with strong balance sheets (such as Southwest) make opportunistic plays for their financially challenged competitors. I have made no allowance for Southwest to make an acquisition during any recession which may occur.
Southwest chose not to participate in the sector’s consolidation which took place after the global financial crisis, and I think that management would reach a similar decision next time.
Margin Story
Southwest has consistently delivered above sector average operating margins. Based on how operating margins have cycled over time I estimate that the period from FY2006 to FY2019 represents a complete economic cycle for the airline sector.
The following chart shows the changes in operating margin through the cycle:
Author’s compilation using data sourced from the U.S. Bureau of Transportation Statistics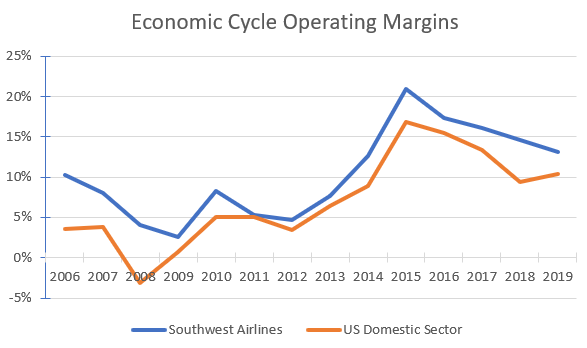
I estimate that Southwest’s average operating margin through the cycle is 10.4% and the sector’s US domestic average operating margin is 7.1%.
Based on my estimate of the sector’s operating cycle, we are currently on the downward leg of the economic cycle where operating margins are falling and the sector’s profitability is heading towards its minimum.
My scenario has a mid-point operating margin for Southwest of between 9% to 12%.
Growth Efficiency
In the most recent earnings conference call (FY2023 Q3), Southwest has indicated that its level of capital spend over the next 5 years will be relatively constant at $4,000 M per year.
I measure capital efficiency as revenue/invested capital. Southwest’s current ratio is 3.28 but this number has been distorted by the cash balances that have been built up during the COVID pandemic (sourced from additional debt, equity, and government support payments).
Prior to COVID, Southwest’s capital efficiency was between 1.7 to 1.9 and I estimate that the sector’s median ratio is currently 1.38. I’m not surprised that Southwest is more capital-efficient than the typical airline because of its single aircraft design policy.
For my scenario, I have used the bottom end of Southwest’s pre-COVID ratio.
Risk Story
As the US economy begins to slow and airline profitability continues to decline towards its lowest cyclical levels this will increase the investing risks associated with airline businesses.
Southwest will be entering this part of the cycle with an FY2023 Q3 debt ratio equal to 69%. I estimate that Southwest’s average debt ratio through the economic cycle is 51%. This means that Southwest will currently have a relatively low cost of capital because of the high debt ratio, but I am estimating that its terminal cost of capital will be higher as the debt ratio normalizes.
Competitive Advantages
Southwest’s operating model is pitched as a relatively low-cost operator compared to other major airlines. Southwest’s historical above sector average operating margins confirm that the model has been relatively successful.
There is reasonable evidence to suggest that as Southwest continues to grow it is becoming increasingly more difficult to sustain a truly low-cost operation. For this reason, I have estimated that Southwest’s terminal ROIC will be around 10%.
Valuation Assumptions
The following table summarizes the key inputs into the valuation:
Author’s valuation model inputs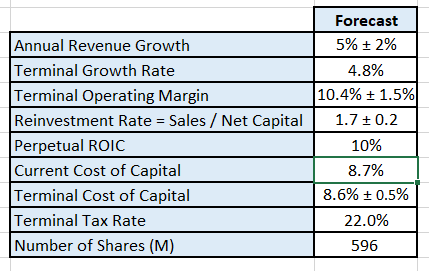
There are other implicit assumptions within my valuation which should be noted:
- Based on the current share price I have accepted the company’s treatment and valuation of the outstanding convertible notes (they will not be converted to equity).
- I have assumed that the outstanding management-restricted stock units will not be converted to common stock.
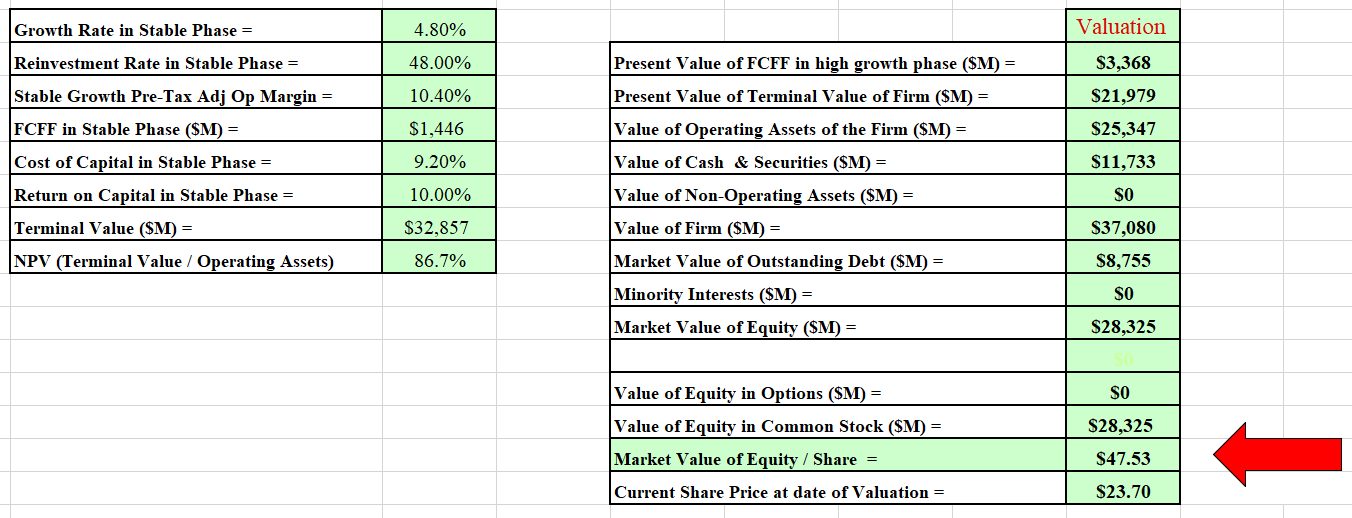
Discounted Cash Flow Valuation
The valuation has been performed in $USD:
Author’s model output Author’s model output
I also developed a Monte Carlo simulation based on the range of inputs for Southwest’s mid-cycle valuation. The output of the simulation was developed after 100,000 iterations.
Author’s model Monte Carlo simulation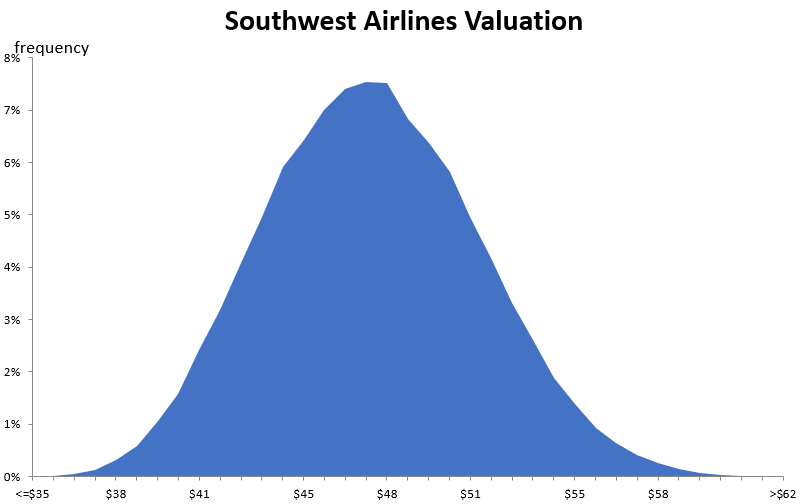
The simulation is very sensitive to any changes in Southwest’s expected operating margin. The operating margin is the fundamental driver of Southwest’s valuation.
The simulation indicates that based on my estimate of Southwest’s mid-cycle metrics, its intrinsic value is between $35 and $62 per share with an expected mid-cycle value of $48.
Recommendation
The report has highlighted the cyclical nature of the airline sector. I estimate that we have entered the downward leg of the current economic cycle.
Airline profitability is particularly sensitive to traffic volume, labor productivity, and the price of oil. Currently, traffic volume is high, labor productivity is deteriorating, and the price of oil has been rising (until very recently). This mix has caused airline margins to fall.
The current economic outlook is very uncertain with many prominent commentators predicting that the US and global economies may very well enter a recession in the coming months.
If this is the case, then I expect that the airline sector’s profitability will decline further.
It is particularly difficult to value cyclical businesses because of the wild swings that their financial metrics take through the economic cycle. The recommended approach is to value the company based on its mid-cycle (or average) metrics.
My valuation indicates that Southwest is potentially very cheap but only if the economy is in the recovery stage of the economic cycle. Given the current economic uncertainty, I do not recommend buying any airline stock at the current time, and in fact, I would be a seller.
What should current holders of Southwest stock do?
The market has rallied over the last few trading days. I would take this opportunity to reduce my holding (fade the rally). I think that if economic conditions deteriorate then there is a high probability that Southwest’s stock price may decline further (along with the rest of the market).
For those investors who do not want to crystallize any losses on their trade then I would highly recommend that they purchase some protection in the form of put options (there are a range of alternatives for this strategy – buy puts in Southwest, buy puts on the sector ETF (JETS) or buy puts on the wider market.
When will Southwest be a buy?
At some point in the future Southwest is going to be a wonderful buy. The problem is that it is unlikely that investors will get an alert to tell them when that time has arrived. The stock is currently close to a 10-year low with the potential to go lower.
I recommend that investors watch their charts very closely and develop a set of indicators to help develop a market entry signal that they could be used to help them to decide when to execute a long trade.
When that time arrives then the aggressive investor could use a variety of strategies (including long stock, long options and ETF’s) to capitalize on the price reversal that will ultimately come with Southwest.
Cyclical Stocks – Golden Rule
In my opinion, cyclical stocks are not long-term bottom draw investments because of their volatility. They are however wonderful trading stocks and substantial trading profits can be made if investors can identify the turning points in the economic cycle and make the appropriate adjustments to their cyclical holdings.
Analyst’s Disclosure: I/we have no stock, option or similar derivative position in any of the companies mentioned, and no plans to initiate any such positions within the next 72 hours. I wrote this article myself, and it expresses my own opinions. I am not receiving compensation for it (other than from Seeking Alpha). I have no business relationship with any company whose stock is mentioned in this article.
Seeking Alpha’s Disclosure: Past performance is no guarantee of future results. No recommendation or advice is being given as to whether any investment is suitable for a particular investor. Any views or opinions expressed above may not reflect those of Seeking Alpha as a whole. Seeking Alpha is not a licensed securities dealer, broker or US investment adviser or investment bank. Our analysts are third party authors that include both professional investors and individual investors who may not be licensed or certified by any institute or regulatory body.