Summary:
- Taiwan Semiconductor Manufacturing Company Limited is well positioned to break out of a multi-year resistance level near $130.
- I see both strong technical and fundamental signals that can support such a breakout.
- Judging by Taiwan Semiconductor’s revenue trends, the contracting phase of the current cycle is ending, while the expansion phase is starting.
motorenmano
The investment thesis
The thesis of this article is quite straightforward. I will argue that Taiwan Semiconductor Manufacturing Company Limited (NYSE:TSM) stock is: A) well poised to break out of a multi-year resistance level near $130: and B) thus TSM has a large potential upside.
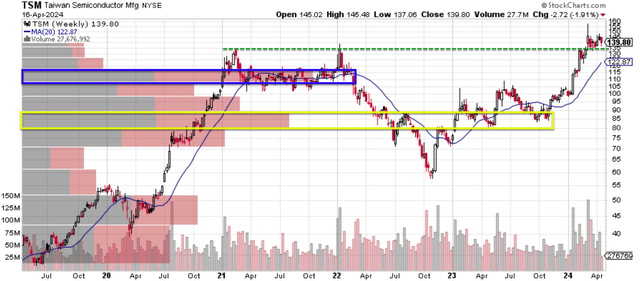
I will argue for this thesis both by analyzing the technical signs and the fundamental business catalysts. And I will start with the technical signs first. The chart below shows the price-volume information for TSM stock in the past 5 years on a weekly basis. As seen, the stock has broken out of a multi-year resistance level near $130 recently. The price has been in a robust uptrend for the past few months, continuously making higher highs and higher lows. The price has been steadily increasing since around October 2023.
This uptrend suggests that there is buying pressure on the stock, which could help it break through the resistance level. At the same time, the trading volume has been picking up lately, which suggests that there is more interest in the stock.
In particular, the yellow box and the blue box highlight the two price ranges that, I think, are of particular interest. These price ranges, around $80 and $110 respectively, had the largest cumulative trading volumes over this period, as seen. In my view, the stock has definitively overtaken these two price ranges by now. To me, this suggests that shareholders in these price ranges have been largely replaced by investors who are more bullish and are willing to pay more for the stock.
Next, I will elaborate on the fundamental catalysts.
Valuation and cyclicality
The current P/E of around 27x ratio can seem off-putting to many potential investors. It is indeed not cheap, either, in absolute terms or relative terms. The next chart shows its P/E ratio compared to its historical average. As seen, the current 27x P/E is not only far above its historical average of around 19.5x, but also among the highest levels in the past decade.
However, I don’t suggest you be overly concerned about the P/E. As a stock in the highly cyclical semiconductor sector, my experience is that P/E is poor guidance for entry or exit points. As argued in an earlier article, for stocks that demonstrated regular cycles (which TSM did as seen in the next chart), I suggest investors focus on growth. More details are in my earlier article, and here I will just quote the result:
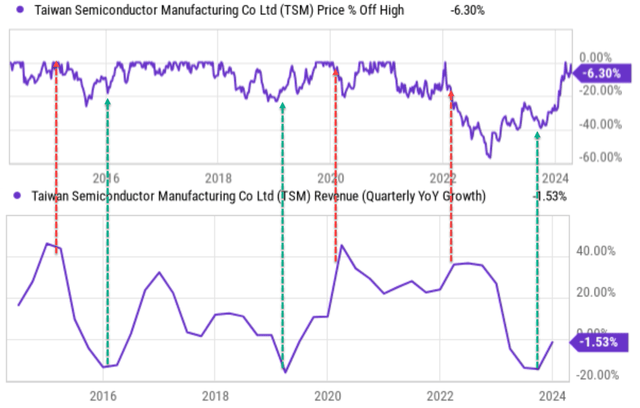
At good times, the business overly expands and plants the seed for the bad times to come. You can see this pattern multiple times even in the past 10 years alone as shown in the next chart. I see the cycle happened at least 3 times since 2014 – i.e., about once in 3 years as marked by the red and green dotted line arrows in the chart below.
Each time, the super growth (we are talking about 40% quarterly revenue growth YOY here) was often quickly followed by a deep stock price correction as indicated by the red arrows. And vice versa, a contraction was often followed by a large rally as indicated by the green arrows.
In the current cycle, TSM is emerging from a contraction cycle, judging by its quarterly revenue growth. If history is of any guidance, I expect price movement to repeat the historical rhythm.
Growth potential
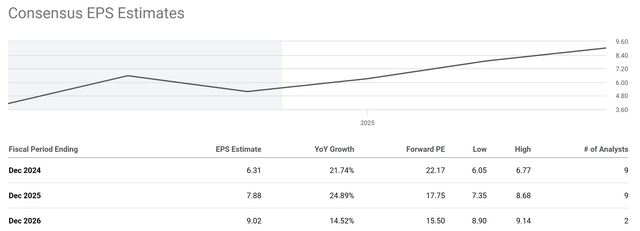
Moreover, the current high P/E would quickly shrink during an expansion cycle. The chart next summarizes consensus estimates of TSM’s Future earnings growth in the next few years. As seen, for FY 2024, the consensus EPS estimate is 6.31, with a year-over-year growth of 22% (in other words, the consensus seems to agree that the contraction phase of the current cycle is over). The forward P/E ratio is estimated to be 22.17x by then. For FY 2025, the consensus EPS estimate is 7.88x, with another rapid annual growth rate of 24.89%. The forward P/E ratio would be only 17.75x by then.
I see good reasons to support the above consensus’ optimism. There were several macroeconomic headwinds for TSM in the past 1~2 years, including China’s COVID-related shutdowns in the early part of 2023, inflationary pressures across many parts of the globe, and geopolitical conflicts in Ukraine and the Middle East.
While some of these headwinds will likely persist this year, I believe that the impact of COVID-related shutdowns is largely over by now. The level of inflation is still elevated, but is much cooler than 1~2 years ago. The disruptions to distribution channels and logistic chains caused by the Russia-Ukraine war and COVID have also largely been renormalized by now, which should augur well for TSM, too. Finally, the rapid rise of generative AI in the past 1~2 years should also provide longer-term support to TSM earnings in this expansion cycle.
Other risks and final thoughts
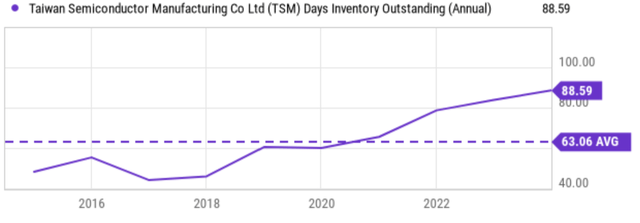
In terms of downside risks, besides the generic risks (cyclicality, geopolitics, etc.), its current inventory is quite high and can cause some concern. The next chart shows TSM’s inventory, in terms of Days Inventory Outstanding, in the past 10 years. As seen, the current inventory of TSM is currently 88.6 days. It is at the peak level and is significantly higher than its historical average of around 63 days (by more than 40%). Such an unusual level of inventory was largely the result of the aftermath of the contraction phase mentioned above, in my view.
It will take time for TSM to digest hoarded inventory. In this process, such an inventory will cause downside risks, including higher holding costs (such as storage fees, insurance, and security costs), obsolescence risk (especially in the rapidly evolving semiconductor industry), and also balance sheet risks (in the case of a write-off).
All told, I think the upside risks far outweigh the downside risks. To reiterate, my thesis is that TSM stock presents a compelling buy opportunity with a combination of technical and fundamental factors. I see strong technical signals that TSM is poised for a potential breakout from a multi-year resistance level. Fundamentally, analysts estimate robust earnings growth for the next few years. I totally share such optimism, given the ongoing demand for semiconductors and TSM’s position as a leader in the industry. The current P/E ratio is on the higher end, but I do not suggest the use of P/E as a good indicator for highly cyclical stocks.
Editor’s Note: This article discusses one or more securities that do not trade on a major U.S. exchange. Please be aware of the risks associated with these stocks.
Analyst’s Disclosure: I/we have no stock, option or similar derivative position in any of the companies mentioned, and no plans to initiate any such positions within the next 72 hours. I wrote this article myself, and it expresses my own opinions. I am not receiving compensation for it (other than from Seeking Alpha). I have no business relationship with any company whose stock is mentioned in this article.
Seeking Alpha’s Disclosure: Past performance is no guarantee of future results. No recommendation or advice is being given as to whether any investment is suitable for a particular investor. Any views or opinions expressed above may not reflect those of Seeking Alpha as a whole. Seeking Alpha is not a licensed securities dealer, broker or US investment adviser or investment bank. Our analysts are third party authors that include both professional investors and individual investors who may not be licensed or certified by any institute or regulatory body.
As you can tell, our core style is to provide actionable and unambiguous ideas from our independent research. If your share this investment style, check out Envision Early Retirement. It provides at least 1x in-depth articles per week on such ideas.
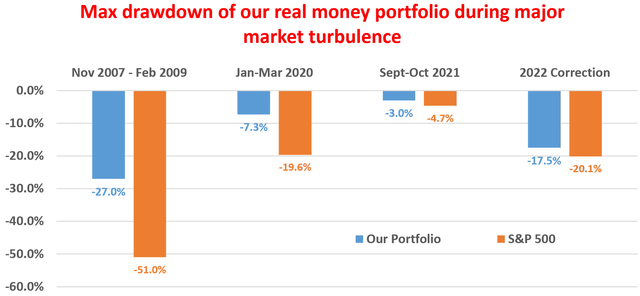
We have helped our members not only to beat S&P 500 but also avoid heavy drawdowns despite the extreme volatilities in BOTH the equity AND bond market.
Join for a 100% Risk-Free trial and see if our proven method can help you too.
