Summary:
- There has never been a shortage of news surrounding Tesla, Inc., many of them causing large stock price movements on a day-to-day basis.
- This article goes back to its production and manufacturing roots.
- In the end, a manufacturing business has to be able to cut its cumulative unit cost as described by the so-called Wright’s Law.
- And in Tesla’s case, its data have been keeping pace with the law thus far, and I see reasons why it would keep doing so.
porcorex/iStock via Getty Images
Thesis
Tesla, Inc. (NASDAQ:TSLA) can be considered a story stock, meaning its value is driven more by investors’ belief in the company’s narrative and potential future growth. Its charismatic CEO, Elon Musk, has been a key part of the company’s story and keeps adding color to the story.
And my thesis is simple here: it does not have to be and should not be. This article goes back to its production roots. And I will argue that no matter what the narratives are, in the end, an electric vehicle (“EV”) manufacturing business is still governed by the same basic laws that have governed manufacturing in the past. The remainder of this article will focus on one such particular law: the so-called Wright’s Law.
And I will explain why my analysis shows that TSLA has been keeping pace with the law thus far and successfully cutting its cost as its production scales up – amid all the recent challenges. And furthermore, I see reasons why it would keep doing so to further widen its competitive advantage as these challenges abate.
Wright’s Law and the Ford Model T
Wright’s law refers to an EMPIRICAL OBSERVATION that states that for every cumulative doubling of units produced, the cost of production decreases by a constant percentage. Specifically, the law states that for every doubling of cumulative units produced, the cost of production decreases by a constant percentage that has been observed to the in the range of 10-30%.
Theodore Wright made this observation in the aircraft industry first. But the law has since been found to have broad applicability to other industries that did not even exist in his days yet, such as semiconductors, mass automobile production, and battery cell production.
To wit, the chart depicts the production data of the Ford Motor Company (F) Model T between 1909-1923. The data (those dots) were fitted to Wright’s law. As seen, the fitting (the thick line amid all the dots) shows a linear relationship on a double logarithm scale – precisely consistent with the law’s prediction. In particular, the slope of this line is ~15%, indicating that Ford’s Model T has been able to achieve a 15% reduction in costs per doubling of cumulative production. Bear this number in mind as we move on to examine TSLA’s data next so you can better contextualize TSLA’s results.
Source: ARK invest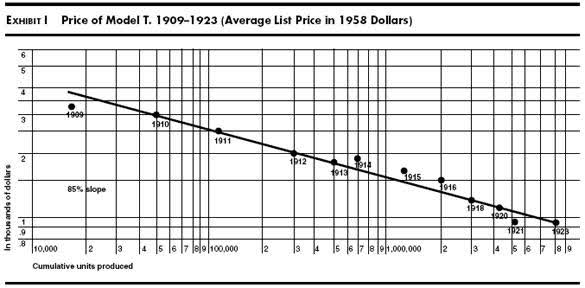
Wright’s Law and TSLA
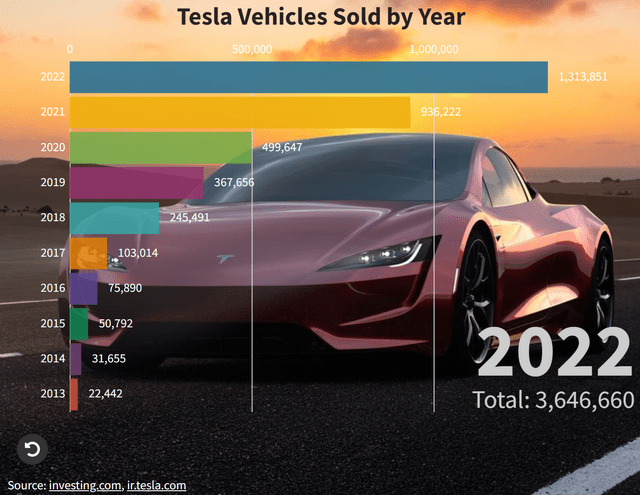
It’s common knowledge that TSLA has been ramping up its EV deliveries rapidly, as seen in the chart below: just like Ford did with its model T in its hay days. In 2022 Q4 alone, Tesla delivered 405,278 vehicles. And for the full year of 2022, Tesla delivered approximately 1.31 million vehicles. However, more products sold do not automatically translate into more profits earned. And the key link in-between is the unit cost that Wright’s law describes, as we will examine next.
The following graph is a busy chart, and I will guide you through it step by step. But in essence, it illustrates a fitting of TSLA’s delivery data according to Wright’s Law, just like the chart fitting Ford Model T’s data you’ve seen earlier. The vertical axis displays TSLA’s cumulative average unit cost, which was calculated by dividing its total cost of revenue by the total number of vehicles sold since 2013, when the company sold its first batch of vehicles. The horizontal axis represents the cumulative number of vehicles sold since 2013.
Both the vertical and horizontal axes are in log scale. And as a result, just like in the Ford Model T case, the fitting should be a descending line if the data adhere to the law.
Source: author based on Seeking Alpha data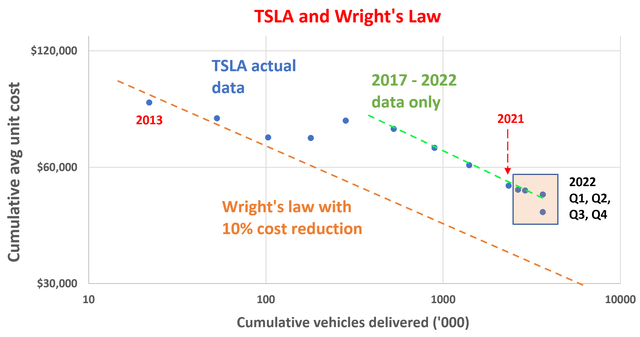
Well, you can clearly see the fitting is a bit messier than in Ford’s case. Nonetheless, the general trend is declining. I believe this non-perfect fit is primarily due to the early stage that TSLA has been in around 2013. It has made significant changes to its models and production methods, causing deviations from the expected trend. For instance, with its relatively small scale in 2013, the addition of each giga-factory could substantially alter the slope of the fitting.
All told, if we put the data points into two groups and perform segmented fitting on each group, each data group fits well with Wright’s Law. More specifically, the orange line represents the fitting for TSLA’s earlier years (2013-2015), while the green line represents the fitting for the larger scale production and delivery since 2017. The green line has a slope that corresponds to a 10% unit cost reduction per production doubling.
Now let me draw your attention to the 2022 data. The 2022 quarterly data points are highlighted in the orange box. As seen, these data points show that TSLA’s more recent cost reduction has also been keeping pace with Wright’s Law. Actually, one of its quarterly results showed an accelerated reduction as seen. Between 2013 and Q4 2022, TSLA delivered a cumulative total of 3.64 million vehicles and incurred $186.2 billion in cumulative cost of revenue. Thus, its cumulative average unit cost is $50.99k per vehicle delivered so far. To put this into perspective, the average unit cost up to 2021 was $53.7k. As a result, it’s 2022’s cumulative unit cost is ~5% lower than the 2021 figure.
In my opinion, this is a fundamental signal that verifies TSLA’s technological and logistical leadership. Despite facing a range of challenges over the past one or two years (more on this next), TSLA was able to keep reducing costs and remain competitive. As these challenges (such as raw material costs, COVID interruptions, and inflation gradually ease), I am optimistic that TSLA can further reduce its unit costs and increase its profitability.
The road ahead
If you recall, Ford’s Model T has been able to achieve a 15% reduction in costs per doubling of cumulative production. And TSLA’s data since 2017 has been showing a reduction of 10%. I would treat this as a strong testament to TSLA’s success considering that the Ford Model T probably is among the most successful products, not only within the auto industry, ever made by one single company. And looking ahead, I see a few catalysts that could further help TSLA to reduce cost even more rapidly. And here I will focus on two of them: its FSD (Full Self-Driving) technology and also its expanding infrastructure.
I started the article with the premise that the same Wright law that governed Ford’s model T will keep governing TSLA and other EVs. However, the advancements of autonomous driving technology might create a new cost reduction curve. Model T started and ended as a hardware. However, TSLA’s models might eventually become a platform or network and no long be a hardware due to its FSD.
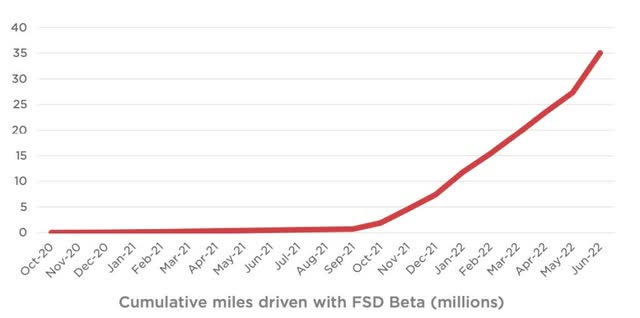
In its recent Q4 earnings report, Elon Musk highlighted that Tesla’s FSD Beta have attractive a large diver base (about ~100k test drivers), and they have accumulated an astounding 35 million miles of autonomous driving on public roads. As such, TSLA’s FSD has accumulated more autonomous miles than any other rival platforms. And the value of platform precisely resides in the user base and amount of data available in the platform. The purchase of another Model T by my neighbor does not increase the value of the model T that I own. However, in a network, the platform becomes more valuable to each of its members as additional members join. It is a potential that Ford’s model T did not provide. As FSD matures and its user base further expands, it could reduce the cost and improve the convenience for each of its drivers. It could also create significant impacts on a range of related sectors, such ride-sharing services and public transportation.
Along the line of the network effects, another factor that accelerates TSLA cost reduction is the maturity of its infrastructure. TSLA have been building its EV infrastructure from the ground up, including charging stations and service shops. Unlike gas stations, these infrastructures were essentially nonexistent till recent years. And TSLA had to invest substantial capital to expand them. And in my opinion, it has been still playing catching up on this front.
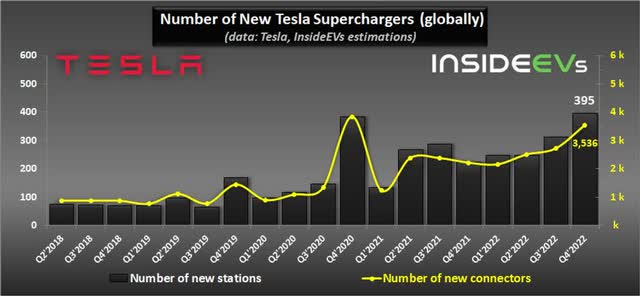
For example, Tesla’s new supercharging stations have grown to 395 as of Q4 2022, translating into an annual growth rate of 78% and far outpacing its YoY vehicle delivery growth of 44%. But even at this pace, it will take more time and CAPEX to fully meet the need. For example, in a recent announcement from the Biden administration, TSLA is said to expand its charges to 7,500 in the U.S. alone by 2024. Quote:
“… open a portion of its U.S. Supercharger and Destination Charger network to non-Tesla EVs, making at least 7,500 chargers available for all EVs by the end of 2024.”
These infrastructure investments require a large upfront cost. And once they are built, they could pay dividends for years or decades to come. Hence, in a way, they are paving the way for future profitability today. Especially, by opening up its Supercharger network to other EVs, its network could be potentially more valuable in the EV ecosystem.
Risks and final thoughts
There are some headwinds on the near horizon. The computer chip shortage has plagued the auto industry in the wake of the pandemic. And the aftermath is still persisting and could create difficulty for the company to meet its goal of producing 1.8 million vehicles this year. Also, raw material prices remain at an elevated level and so does the rate of inflation. These challenges could create wide fluctuations in TSLA’s production and delivery schedule, as you can clearly see from its inventory data in recent quarters. As highlighted in the yellow box below, its global vehicle inventory, in days of supply, widely fluctuated in the past year from as low as 3 days to the current level of 13 days.
Source: TSLA 2022 Q4 earnings report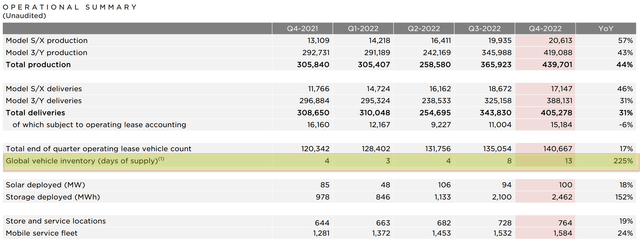
All told, I suggest TSLA investors ignore the “story” aspect of the stock and focus more on its basics.
In the end, a manufacturing business, whether in Ford’s or Musk’s age, is still governed by the same basic laws. A successful manufacturing business has to keep cutting its production cost to remain competitive as Wright’s Law described. TSLA’s production and delivery results so far are keeping pace with Wright’s Law from my analysis. And looking ahead, I see a few catalysts that have the potential to help TSLA such as the advancements in its FSD technology and also the maturity of its infrastructure.
Disclosure: I/we have no stock, option or similar derivative position in any of the companies mentioned, and no plans to initiate any such positions within the next 72 hours. I wrote this article myself, and it expresses my own opinions. I am not receiving compensation for it (other than from Seeking Alpha). I have no business relationship with any company whose stock is mentioned in this article.
As you can tell, our core style is to provide actionable and unambiguous ideas from our independent research. If your share this investment style, check out Envision Early Retirement. It provides at least 1x in-depth articles per week on such ideas.
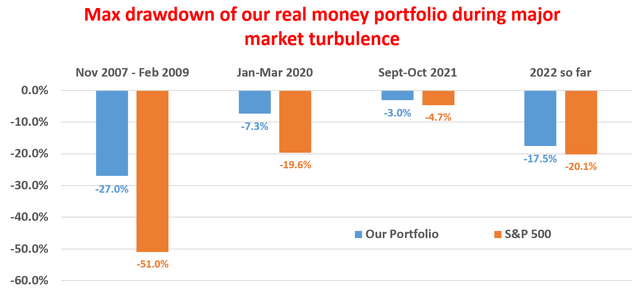
We have helped our members not only to beat S&P 500 but also avoid heavy drawdowns despite the extreme volatilities in BOTH the equity AND bond market.
Join for a 100% Risk-Free trial and see if our proven method can help you too.
