Summary:
- Texas Instruments’ leverage ratios in 2022 indicate the company’s recovery after the COVID-19 outbreak.
- Also, the company’s high free cash flow and low net debt provide the opportunity for higher distributions.
- In the long term, the semiconductor market outlook is strong, and due to its increasing 300-mm wafer capacity, TXN can benefit from the market condition.
- However, we should keep in mind that in 2023, we may not see the strong market that is expected in long term.
- TXN stock is a buy.

Aaron Hawkins/iStock via Getty Images
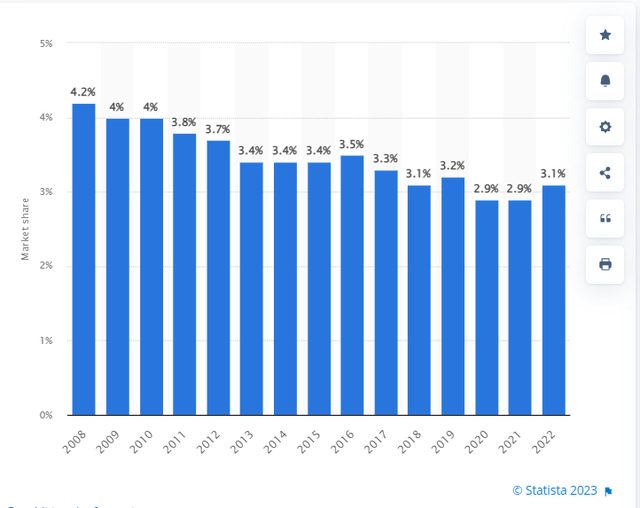
The trade restrictions, the geopolitical issues, and more importantly, the increasing supply of semiconductors in China and the rest of Asia, has the potential to threaten Texas Instruments’ (NASDAQ:TXN) market share. From 2008 to 2022, Texas Instruments’ market revenue share decreased from 4.2% to 3.1%. However, TXN’s increasing 300-mm wafer capacity can fuel its growth and support its market share. In 2022, TXN extended its low-cost manufacturing advantage, including 300-mm, and expects its 300-mm capacity to expand further in 2023. I don’t expect the company’s financial results in 1Q 2023 to be strong as in 1Q 2022 or 4Q 2022. However, the bigger picture here is that TXN’s financial results in the following years can be considerably stronger than now, and due to TXN’s current prices which are almost the same as in March 2021 and March 2022, it is a good time to buy the stock.
Financial results
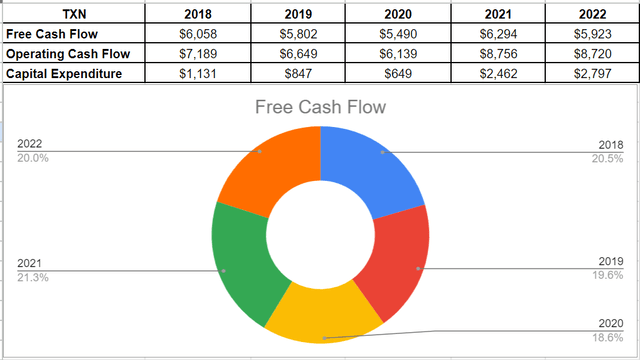
In its 4Q 2022 financial results, TXN reported revenue of $4670 million, compared with 4Q 2021 revenue of $4832 million, down 3% YoY. In the fourth quarter of 2022, the company’s operating profit and net income decreased by 13% YoY and 8% YoY to $2176 million and $1962 million, respectively. TXN’s cash flow from operations was flat in 2022. However, its capital expenditures increased by 14% YoY in 2022 to $2797 million. Thus, its free cash flow decreased by 6% YoY to $5923 million in the twelve months ending 31 December 2022. In 2022, TXN returned $7912 million to its shareholders, including full-year dividends of $4297 million (up 11% YoY) and stock repurchases of $3615 million (up 586% YoY).
“Revenue decreased 11% sequentially and 3% from the same quarter a year ago. As we expected, our results reflect weaker demand in all end markets with the exception of automotive,” the CEO commented. “TI’s first quarter outlook is for revenue in the range of $4.17 billion to $4.53 billion and earnings per share between $1.64 and $1.90,” he continues. TXN’s diluted earnings per common share in 4Q 2022 and 1Q 2022 were $2.13 and $2.35, respectively.
The market outlook
In the fourth quarter of 2022, analog segment revenue accounted for 76% of TXN’s total revenue. Also, embedded processing segment revenue accounted for 18% of the company’s total revenue in 4Q 2022. TXN’s analog products (that include power and signal chain products) are widely used in the industrial, automotive, and electronics markets. TXN’s embedded processing products (that include microcontrollers, digital signal processors, and application processors) are also used in automotive and industrial markets.
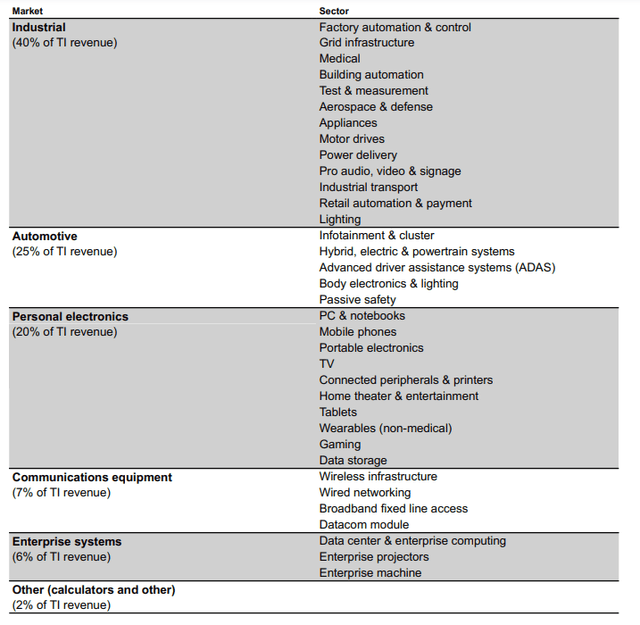
Figure 1 shows TXN’s markets and products in 2022. It shows that in 2022 TXN’s product sales in the industrial, automotive, personal electronics, and communication equipment markets accounted for 40%, 25%, 20%, and 7% of its revenue. According to Markets and Markets, due to rising requirements for power generation through renewable resources, increasing demand for Intelligent Power Modules (IPM) in automotive and industrial, and consumer electronics segments, the global Intelligent Power Module market is forecasted to grow from $1.8 million in 2022 to $3.0 billion in 2027, at a CAGR of 10.7%. Another research shows that due to the increasing number of hybrid electric vehicles and the development of highly autonomous driving cars to increase safety, the global automotive semiconductor market size is forecasted to expand at a CAGR of 8.4% from 2022 to 2029. However, it is worth noting that in 2023, we may not see the strong and increasing demand for semiconductors that are expected in the long term.
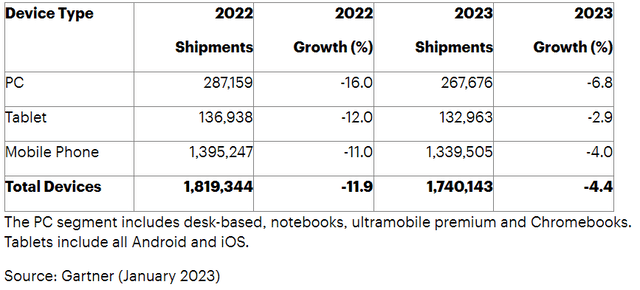
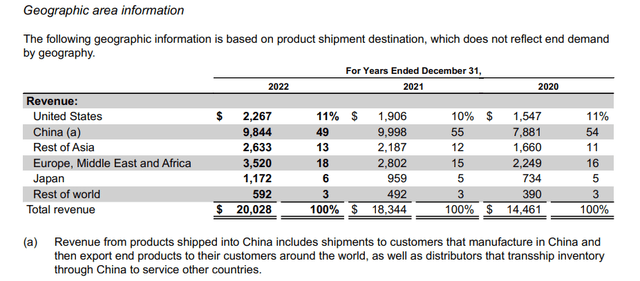
For example, according to Gartner, PC shipment is expected to decrease by 6.8% in 2023 to reach 268 million units from 287 million units in 2022 (see Figure 2). Because of the global recession and hiked interest rates in major economies to combat inflation, from the beginning to the end of 2022, the demand for semiconductors decreased continuously and can decrease further in 2023. Also, we cannot ignore the extensive new restrictions on China’s access to advanced semiconductors that have been implanted by the U.S. government in October 2022. Figure 3 shows that in 2022, 49% of TXN’s revenue was linked to its product shipments to China.
Figure 1 – Markets of TXN’s products
4Q 2022 financial results
Figure 2 – Worldwide shipment forecast by device type
Gartner
Figure 3 – TXN’s product shipment destination
4Q 2022 financial results
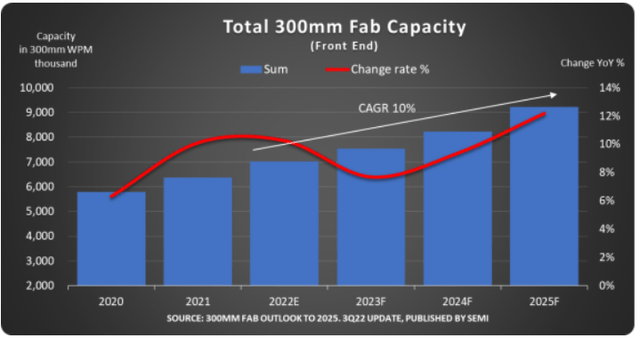
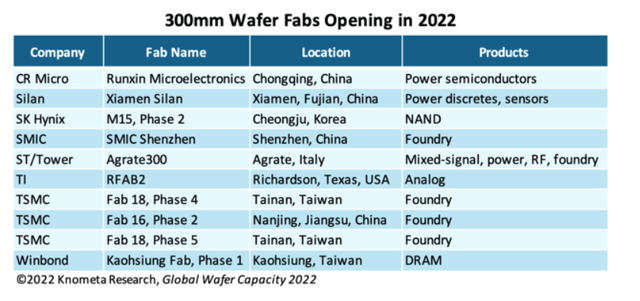
The market outlook for 300-mm wafers is strong. Figure 4 shows that semiconductor manufacturers worldwide forecast to expand their 300-mm fab capacity at a CAGR of 10% from 2022 to 2025, and the increasing demand for 300-mm wafers in the automotive and industrial markets, combining with the increasing competition in the semiconductor manufacturing business, especially from Asia, is acting as a great incentive for Texas Instruments to develop its 300-mm capacity, which reduces its cost significantly. For TXN, with 300-mm wafers, making chips cost 40% lower than with 200-mm wafers. In 2022, TXN began production in two additional 300-mm fabs and began construction on its next two 300-mm fabs. It is worth noting that in 2022, TXN’s fab, RFAB2 in Richardson, Texas, was the only fab opened in the United States (see Figure 5).
In February 2023, TXN selected Lehi, Utah, for its next 300-mm semiconductor wafer fab, which will be located next to the company’s existing 300-mm wafer fab in Lehi, LFAB. The number of semiconductor fabs using 300-mm wafers is expected to increase from 163 in 2022 to 176 and 186 in 2023 and 2024, respectively. In Figure 6 we can see that the company’s market share increased from 2.9% in 2021 to 3.1% in 2022. Despite TXN’s new 300-mm wafer fab plans in the following years, due to the increasing competition in the market, TXN’s market revenue share may not increase, and even, it may decrease. However, due to the increasing demand for semiconductors, TXN’s revenue growth is supported.
Figure 4 – Total 300-mm fab capacity
www.techinsights.com
Figure 5 – 300-mm wafer fabs opening in 2022
knometa.com
Figure 6 – Texas Instruments semiconductor market revenue share worldwide from 2008 to 2022
www.statista.com
TNX performance
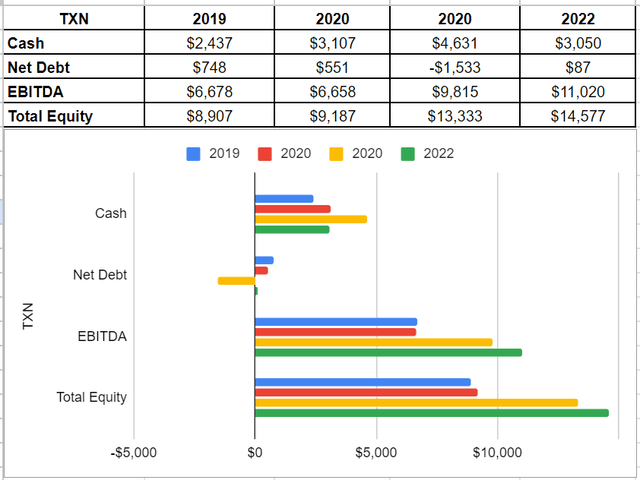
In this section, I investigated Texas Instruments’ balance sheet to analyze its performance during previous years. As is observable, in 2022, TXN’s overall condition was better than at the end of 2021. Albeit the company’s cash generation decreased to $3 billion in 2022, 34% lower than in 2021, its EBITDA level surged by 17% and reached $11 billion compared with its level of $9.8 billion in 2021. Moreover, the company’s net debt was at a very low level of $87 million at the end of 2022. Finally, thankfully Texas Instruments’ total equity improved by 9% and sat at $14.5 billion in 2022 versus its previous amount of $13.3 billion at the end of 2021. Thus, TXN’s net debt is well beneath its cash and equity levels and thereby providing opportunities for more distributions (see Figure 7).
Figure 7 – TXN’s financial data (in millions)
Author
In addition, I conducted an analysis of the company’s free cash flow trend over the past year. Although TXN’s cash operation was almost unchanged during 2022 compared with 2021, its free cash flow declined slightly due to an increase in the capital structure. In minutiae, Texas Instruments’ cash operation stayed at $8.72 billion in 2022 versus its previous amount of $8.75 billion in 2021. Also, its capital expenditure increased by 13% to 2.8 billion in 2022 and thus, led to a $5.9 billion of free cash flow in 2022, a low 5%. All in all, Texas Instruments’ amount of free cash flow is well enough to indicate the company’s ability to pay off debt, repurchase stock, and foster business growth (see Figure 8).
Figure 8 – TXN’s free cash flow (in millions)
Author
Moreover, I investigated the leverage condition of Texas Instrument. Leverage ratios are insightful to show how the company is financing its assets and business operations. In other words, does it use debt or equity financing for most of its operations? I used some common leverage ratios that have significant comparability to its debt. The ratios are calculated in comparison with previous years to be more helpful.
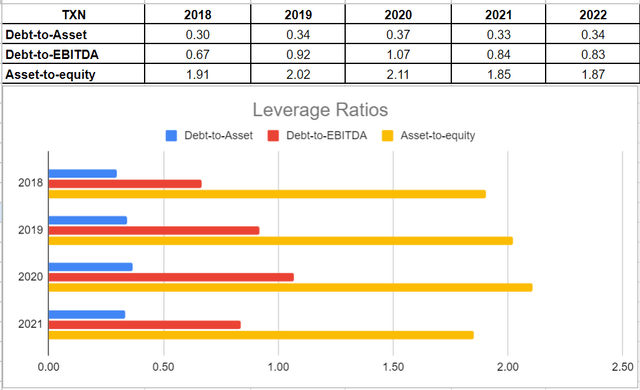
The debt-to-assets ratio is a crucial metric used to assess a company’s debt capacity. It measures the proportion of assets that are financed with debt, and a higher ratio indicates greater leverage and financial risk. Texas Instruments’ net debt-to-asset ratio in 2022 was 0.34, which was almost the same as in 2021 at 0.33. Additionally, the company’s debt-to-EBITDA ratio, which determines the likelihood of defaulting on debt, was at 0.83 in 2022. Also, the asset-to-equity increased slightly from 0.84 in 2021 to 0.83 by the end of 2022. Overall, Texas Instruments’ leverage condition shows its recovery after the COVID-19 pandemic and indicates that the company is using less debt for financing. These leverage ratios are critical indicators of Texas Instruments’ solvency and ability to meet its current and future obligations (see Figure 9).
Figure 9 – TNX’s leverage ratios
Author
Summary
The financial results of TXN show that the company is financially healthy, can cover its current and future obligations, and reward its shareholders. Also, the market outlook for TXN’s products is strong, and the company’s increasing 300-mm wafer capacity should not be ignored at all. TXN stock is a buy.
Disclosure: I/we have no stock, option or similar derivative position in any of the companies mentioned, and no plans to initiate any such positions within the next 72 hours. I wrote this article myself, and it expresses my own opinions. I am not receiving compensation for it (other than from Seeking Alpha). I have no business relationship with any company whose stock is mentioned in this article.
