
Summary:
- Thermo Fisher’s strong product coverage, especially in life science and pharma research, has propelled its strong growth since the pandemic.
- The company’s potent top-line growth has enabled it to continually invest in capex and products without impacting its cash flow.
- Through its expansion, its debt and liabilities stand at a new high, and the management has started making payments toward lowering the burden.
- Its earnings could have a near-term slowdown but remain robust for the long term.
jetcityimage
Investment Thesis
Thermo Fisher Scientific’s (NYSE:TMO) revenue and margin growth was significantly boosted when the pandemic hit. With boom time, it came with large spending as well. This boost effect will turn into a new robust growth pattern for the company, but it also means it will need to reckon with its high debt and liabilities in the medium term. It’s not an immediate risk, but its earnings could gradually drift lower. The current price is rich for its valuation but not by a significant amount. We recommend a hold.
Company Overview
Thermo Fisher Scientific is a technology, instruments, software, and services provider for global bio-science research and application processes. The company, founded in 1956, is based in Waltham, Massachusetts. It was formed through the merger of Thermo electron and Fisher Scientific in 2006. Its reportable segments are Life Science Solutions, Analytical Instruments, Specialty diagnostics, Laboratory Products, and Biopharma Services.
Strength
Just like many sectors and industries were impacted by the pandemic, Thermo Fisher also experienced a “boon” as a result. Its Laboratory Products and Biopharma Services segment provides, among other functions, everything needed for the life science research lab in sample preparation, storage and protection, and analysis. Moreover, its pharma services provide the entire spectrum of development, manufacturing, and clinical trial services, on top of drug substance and product services. One can see immediately this is critically related to the entire endeavor of overcoming the threat of COVID to society as a whole. While other segments stayed at similar levels, the company’s revenue saw the biggest boost from both life science and biopharma-related services, and that growth continued to be strong last year.
Thermo Fisher Revenue by Segment (Charted by Waterside Insight with data from company)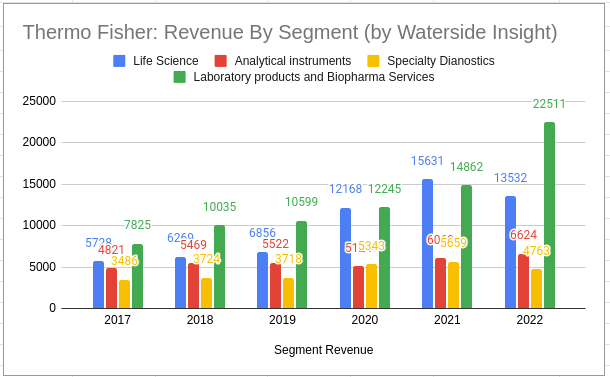
Its Life Science segment, which includes Biosciences and Genetic Sciences, is responsible for providing help to customers’ biological and medical research and discovering new drugs and vaccines, diagnosing infections and diseases, and genomic research and clinical application. This is the segment with the highest margin in previous years, and it saw over a 40% increase in its margin compared to pre-pandemic, while other segments stayed within range without considerable variation. Although this large increased margin for Life Science started to trace back down, it is still higher than the pre-pandemic level.
Thermo Fisher Segment Margin (Charted by Waterside Insight with data from company)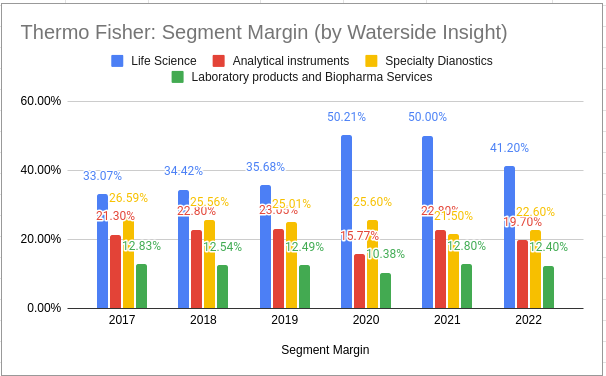
This dynamics of segment contribution can be seen from its aggregate numbers of revenue and net income. Thermo Fisher has continued its strong growth in revenue while net income slipped.
Thermo Fisher Revenue vs Net Income (Calculated and Charted by Waterside Insight with data from company)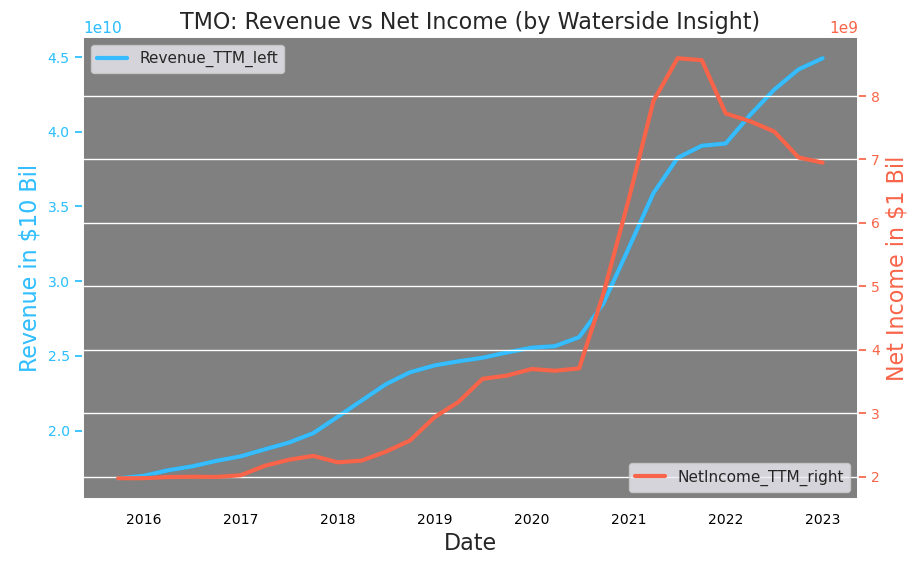
Thermo Fisher has plowed more capex into its operation to respond to customer demands and changing needs. Its capex has risen to triple its pre-pandemic level. However, because its operating cash flow climbed at an even higher pace, its free cash flow has yet more than doubled than pre-pandemic.
Thermo Fisher Capex vs Op CF (Calculated and Charted by Waterside Insight with data from company)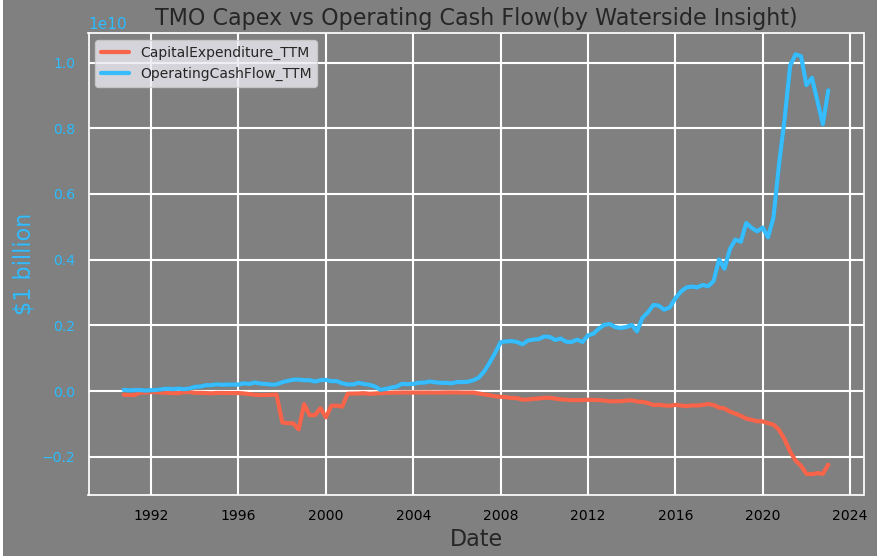
Overall, both its operation and net cash flow are robust, staying at historic highs, although its net cash flow has been volatile as of late. It was due to the company’s $17.4 billion acquisition of PPD in 2021, a provider of clinical research services in biopharma and biotech, and most recently, a $2.6 billion acquisition of Binding Site Group, a specialty diagnostics company.
Thermo Fisher Cash Flow Analysis (Calculated and Charted by Waterside Insight with data from company)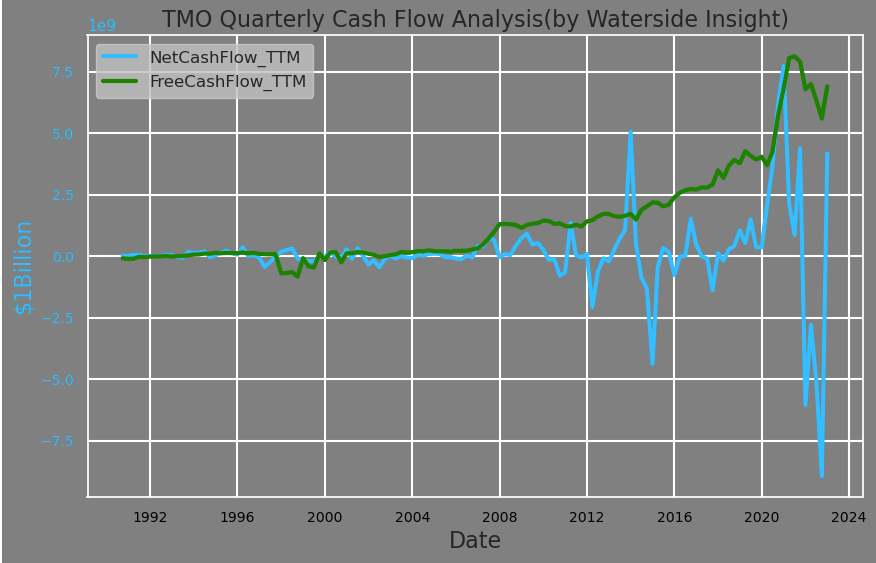
Its cost of revenue has turned up while operating expenses reached their lowest level when comparing them as a percentage of revenue. It highlights its solid top-line growth has enabled the company to maintain the level of spending its needs to support faster growth. To put that in perspective, we consider the company currently has lower expenses, the average cost of revenue, and higher capex compared to its history.
Thermo Fisher Cost and Expenses Analysis (Calculated and Charted by Waterside Insight with data from company)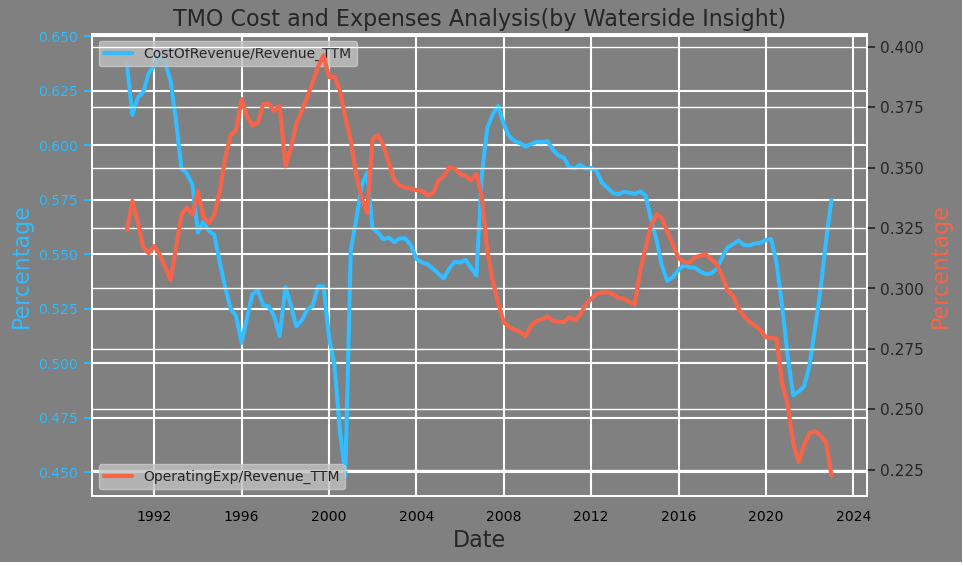
Although according to the company, it anticipates continuing to make significant expenditures for the research and development of innovative products and maintaining its competitiveness. Science is a work of exactness. And the company strives to innovate and evolve with the growth of the customers, as its customers pursue innovation themselves. The company emphasizes significant investment in this area is a must, as without innovation, its products could become obsolete due to the changing specific requirements and industry standards. We expect this level of cost and expense spending to be maintained in the near term, while its revenue and net income develop into a new growth pattern reflecting the scientific research needs ignited since the pandemic. Overall, both its gross profit margins and EBITDA margin have slightly dropped from their highs. Its gross profit margin is still at its average level, and its EBITDA margin is still higher than the pre-pandemic level.
Thermo Fisher Margin Analysis (Calculated and Charted by Waterside Insight with data from company)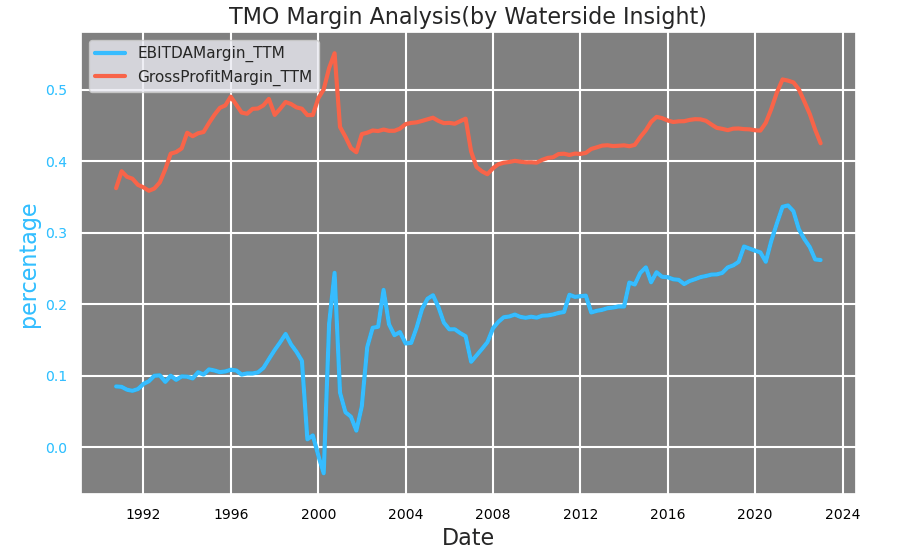
Weakness/Risks
Through its acquisitions and issuance of long-term debt, Thermo Fisher has accumulated the highest level of debt in its history so far. Data shows this high debt level is an outlier, almost doubling its average liabilities level.
Thermo Fisher Debt Analysis (Calculated and Charted by Waterside Insight with data from company)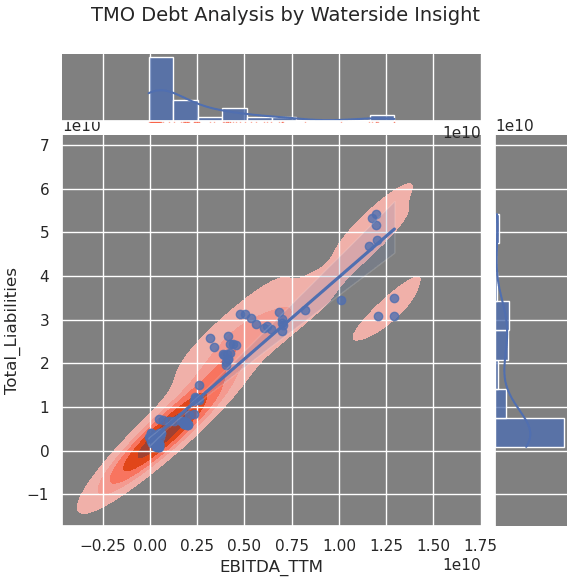
As the pandemic’s boon effect is normalized into a new growth pattern for the company, we expect it also to start normalizing its debt and liabilities profile. It seems the management is keenly aware of this, and the company has started making large payments toward its debt and liabilities. However, reducing its liabilities will also cost its EBITDA, since the two have a high positive linear relationship with each other. We expect over time, its EBITDA will come down by about 20-40%, to its average level, as the company continues making way to reduce debt and liabilities.
TMO Debt Servicing vs Total LT Debt (Calculated and Charted by Waterside Insight with data from company)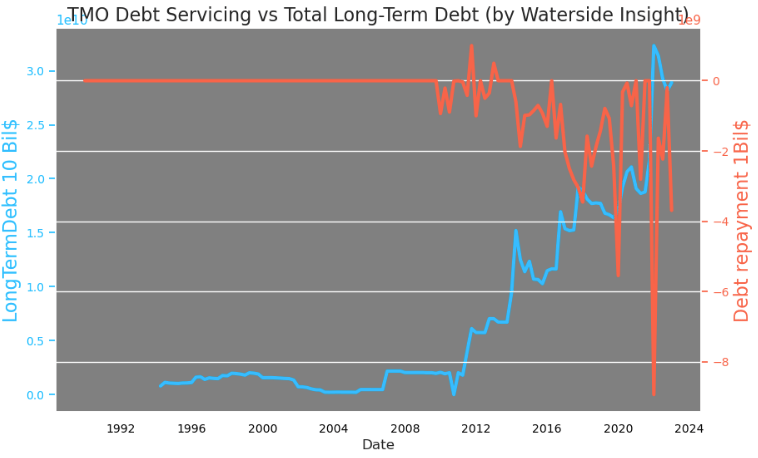
This constraint is further illustrated in its cash-to-debt ratio. Although it went back up a bit, this ratio is still at a low level compared to the past ten years.
TMO Cash-to-Debt Ratio (Calculated and Charted by Waterside Insight with data from company)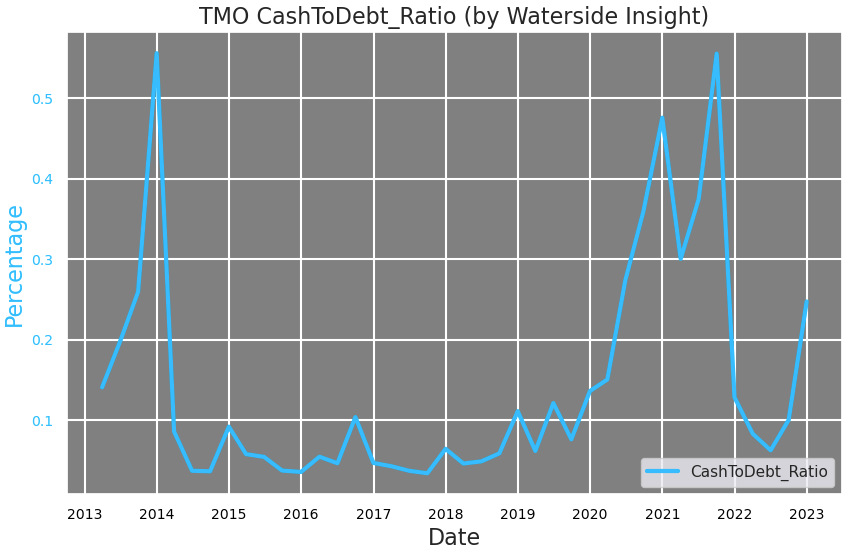
And Thermo Fisher’s cash-to-debt ratio at about 25% currently ranks at one of the lowest amongst the companies in the Medical Diagnostics & Research industry. By now, we could see its strong cash flow, perhaps is not as ample as it seems. With that said, we don’t see this as a sudden or immediate risk. It will play out gradually and mix with other factors, such as its strong top-line growth. So its impact on the stock price won’t be linear.
Thermo Fisher Cash-to-Debt Ratio Ranking within Industry (gurufocus.com)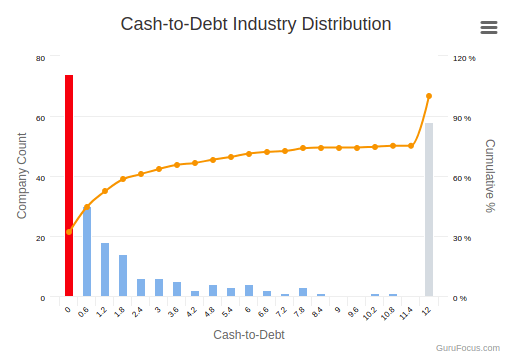
Financial Overview
TMO Financial Overview (Calculated and Charted by Waterside Insight with data from company)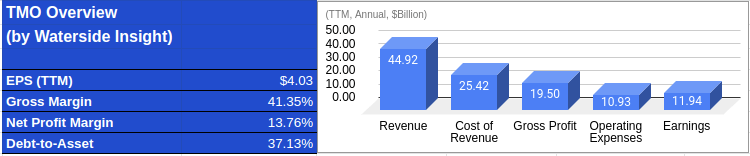
Valuation
Thermo Fisher’s stock price has almost doubled compared to 2018, but its free cash flow per share ratio also nearly doubled during the same period. So it seems the rise in the stock price is only fair by this ratio.
TMO Free Cash Flow per Share (Calculated and Charted by Waterside Insight with data from company)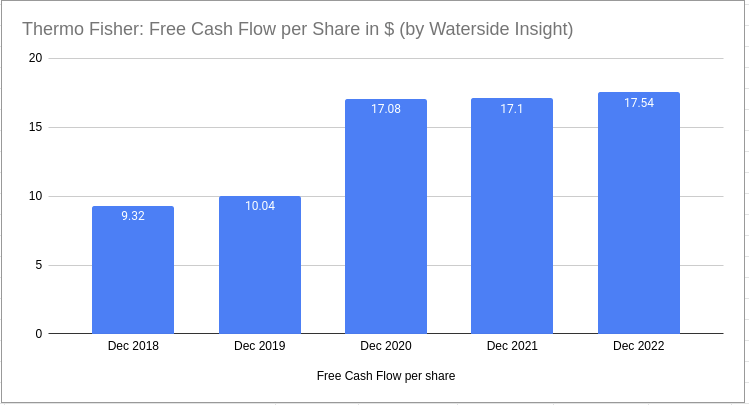
At the same time, its PEG ratio has actually declined. Its price doesn’t seem to be rich from these metrics either. But these metrics may not be forward-looking, as the company’s need to reduce debt and liabilities will bring down its EBITDA in the future. If we factor in our expectation of EBITDA to be lowered by 20% over the medium to long term, then its average growth rate will be much lower than in the past five years of 20.3%. Therefore, its PEG ratio could rise higher than its pre-pandemic level, assuming the current market price. From this perspective, TMO stock price is too rich.
TMO PEG Ratio (Calculated and Charted by Waterside Insight with data from company)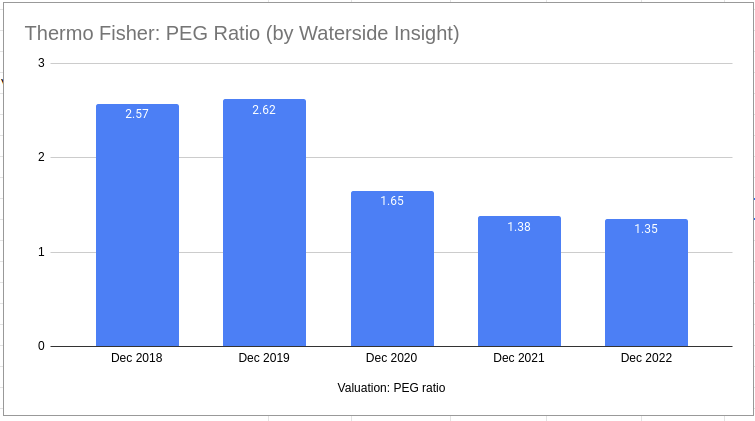
We take into account all the analysis above and use our proprietary models to assess its fair valuation with a forward projection of ten years. In our bullish case, we priced in a few years of dial-back in its growth but sustained strong momentum; it was valued at $531.79. In our bearish case, there are added economic headwinds in the near term, with a strong growth pace maintained; it was valued at $475.46. In our base case, the company simply grows stronger in the longer term than in the bearish case; it was valued at $524.34. Our valuations don’t have large divergence as we see the company’s newly found growth pattern to have a sustainable path ahead. The current market price is a tad higher than our top estimate.
TMO Fair Value (Calculated and Charted by Waterside Insight with data from company)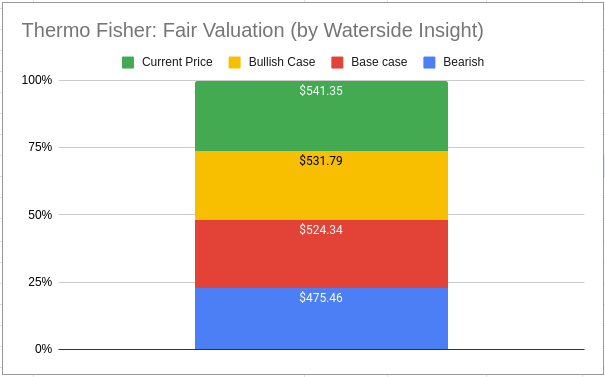
Conclusion
BioScience research and application have been the driving force of our society as a whole fighting against the threat of COVID recently, but their fundamental contribution to our life and the future is much broader than this incident. As we face more threats from climate change and navigate other unforeseeable scenarios, the scientific community and the industry will continue growing demands for services in research and application. With its vast network and large scope of product coverage, Thermo Fisher Scientific will not only settle into a new robust growth pattern but continue its development through innovation to keep pace with its customers. Its current stock price reflects certain premiums rooted in this sentiment. After its heavy acquisition activities in the past two years and facing more macro headwinds, the company will likely continue to adjust and reckon with its high debt and liabilities to reduce the burden. Although the price is slightly higher than our fair valuation, we recommend a hold.
Disclosure: I/we have no stock, option or similar derivative position in any of the companies mentioned, and no plans to initiate any such positions within the next 72 hours. I wrote this article myself, and it expresses my own opinions. I am not receiving compensation for it (other than from Seeking Alpha). I have no business relationship with any company whose stock is mentioned in this article.