
Summary:
- Apple bottomed near the start of the year at $124.
- Strong buying from that region has led to a breakout on the weekly chart with a clear target outlined.
- The Three Wave Theory has proven very successful with predicting future prices as markets switch direction north, and Apple is next in its documented record.
elijah_sad
I began writing with Seeking Alpha almost a year ago I believe and because of the nature of the direction the overall market was heading Southwards I started to think I would get a nickname like Mr. Bearish.
Of course, I didn’t like being bearish with the Wave Theory’s predictions, but it was technically forced upon me. My Seeking Alpha library is stocked with all the calls, and I would like to think they will go dusty on their digital shelf as the market stutters into bullish mode.
As an age-old factor of human evolution, people generally make money when things go up and for the average person in any way invested in the stock market along with the more concentrated investor, this normally still rings true.
The Wave Theory has already made several very successful bullish calls for exact future prices with some of the major U.S. equities, and with some going very quickly to outlined targets. I hope to be correct about Apple (NASDAQ:AAPL) as it breaks out into a bullish three wave pattern and fires into life northwards.
Still waiting for a wave pattern to develop on the monthly chart it is the weekly will be examining in this article, so far Apple has bottomed in its current structure at $124 and has seen buying from that region that has still yet to pause on the monthly chart, I have some technical insight as to where the pause may be and for those that are unaware, it is fair to say it is widely recognized that Elliott was correct in his summation that financial markets move higher or lower in what he called “Waves of buying and selling”. Understanding those waves to gauge a high probability that a financial market will go between two price points is essentially what I have derived from Elliott’s theory and as I see it, or should I say it is my interpretation, that the Three Wave Theory is the only way a human being can gauge with any evidence of future “certainty” that when a market breaks into what is termed a “third wave” that it will look to numerically replicate its wave one two’s parameters thus in trading terms technically giving you a bearing of both entry and exit. Trading is a business of making money, so I believe you take the money that you can technically prove evidential that may be on offer and don’t risk waiting for additional waves that there is no previous footprint of possibly leading to a future price.
But not only is this interpretation derived from Elliott’s theory, it also examines how to read candle sticks which are essentially the “Waves” of buying and selling in the first place and wonder if Elliott hadn’t published his theory would I have worked out the TWT on studying candle stick analysis alone. Something I will probably never know and as we move to look at a fairly simple and bull hungry wave pattern that Apple has just printed I will technically demonstrate all of the former as we look at the charts.
We can see in the weekly chart below the bounce off the $124 region, with the pause in buying coming at $157. This technically qualifies as the wave one, with the rejection candles following from that area and price essentially lingering sideways for a number of weeks before carrying this major equity higher past previously rejected prices to give us a clear road map to the next target.
Apple Weekly Chart (C Trader)
The wave two only dropping over $10 from the rejection region normally would signal high demand from buyers of this stock, with the third wave breakout coming from the mid $140 region past $157 and looking to make its way to $190 to copy its wave one to two.
The next question in focus is where will the rejection come from on the monthly chart if it does come at all, of course. A sneak preview would be $190 or $211 and even $265.
We can see on the monthly chart below that Apple is in its third month of printing bullish candles albeit the rejection from $157 did print in what could be taken as a bullish rejection, it is still a bearish rejection that this structure needs, and it will be interesting to see if it comes at any of the outlined targets.
Apple Monthly Chart (C Trader)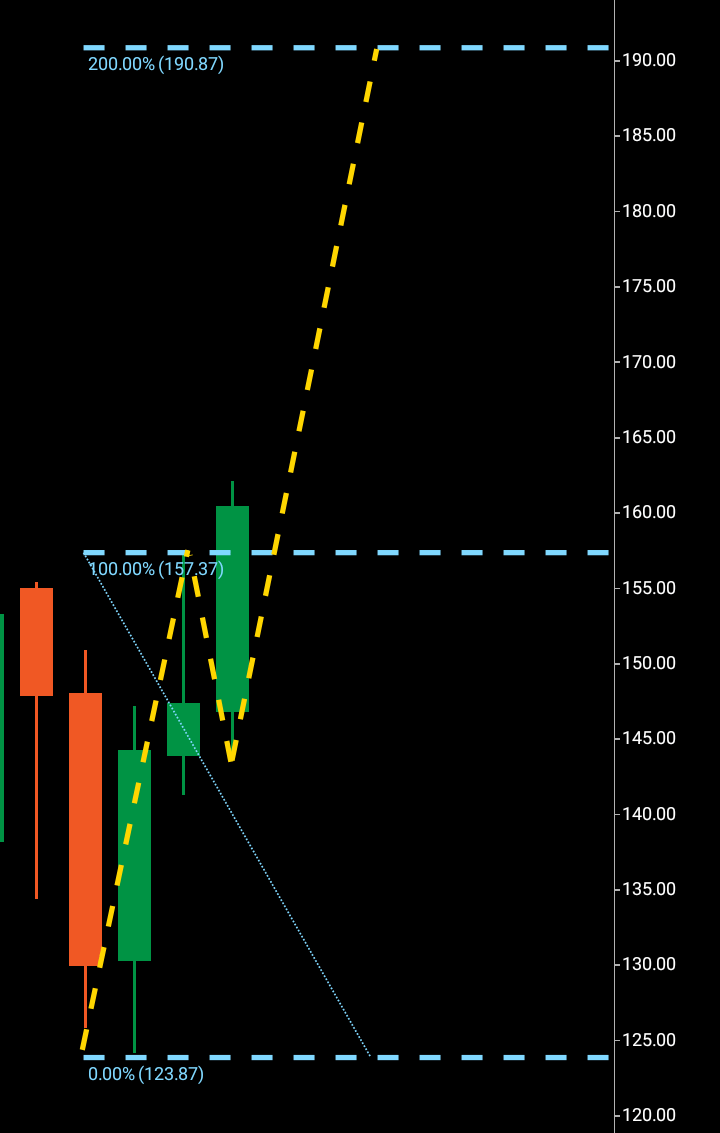
To summarize, I would expect Apple to arrive at $190 within the next 30-90 days and I am selecting a buy signal with evidence of a clear third wave on the weekly chart as I wait to see what the ultimate timeframe will look to provide us with by way of future price.
Disclosure: I/we have no stock, option or similar derivative position in any of the companies mentioned, and no plans to initiate any such positions within the next 72 hours. I wrote this article myself, and it expresses my own opinions. I am not receiving compensation for it (other than from Seeking Alpha). I have no business relationship with any company whose stock is mentioned in this article.