Summary:
- TSMC’s lackluster performance in H1 2023 was due to sluggish shipment growth and reduced orders from major clients.
- TSMC’s market share declined in Q2 2023 but recovered in Q4 2023, remaining the dominant market leader.
- The company remains the most competitive foundry with advanced process technology, strong customer partnerships, and a focus on AI chips.
BING-JHEN HONG/iStock Editorial via Getty Images
We previously analyzed Taiwan Semiconductor Manufacturing Company Limited’s (NYSE:TSM) lackluster performance in H1 2023 (-8.6% growth) stemming from sluggish shipment growth and reduced orders from major clients. The global semiconductor industry downturn further impacted TSMC with end market weakness across PC, smartphone and server markets but with a second-half recovery anticipated, leading to our flattish revenue growth forecasts of -0.13% revenue growth in 2023 but a more positive long-term growth outlook.
In this analysis, we examined TSMC’s foundry market positioning in terms of market share in 2023 and determined whether it could continue to rise again going forward. We also assessed and analyzed TSMC’s competitiveness by comparing its product features, partnerships, and AI-related customers. Finally, we projected the foundry market share by estimating its revenue growth based on the foundry market growth adjusted for our calculated competitive factor score for TSMC and its competitors.
Strong Market Share Foothold
In the first point, we looked at the updated foundry market share to examine TSMC’s position in the market. We also examined its flattening market share in 2023, contradicting our previous frame that TSMC’s market share would continue to increase steadily.
TrendForce, Khaveen Investments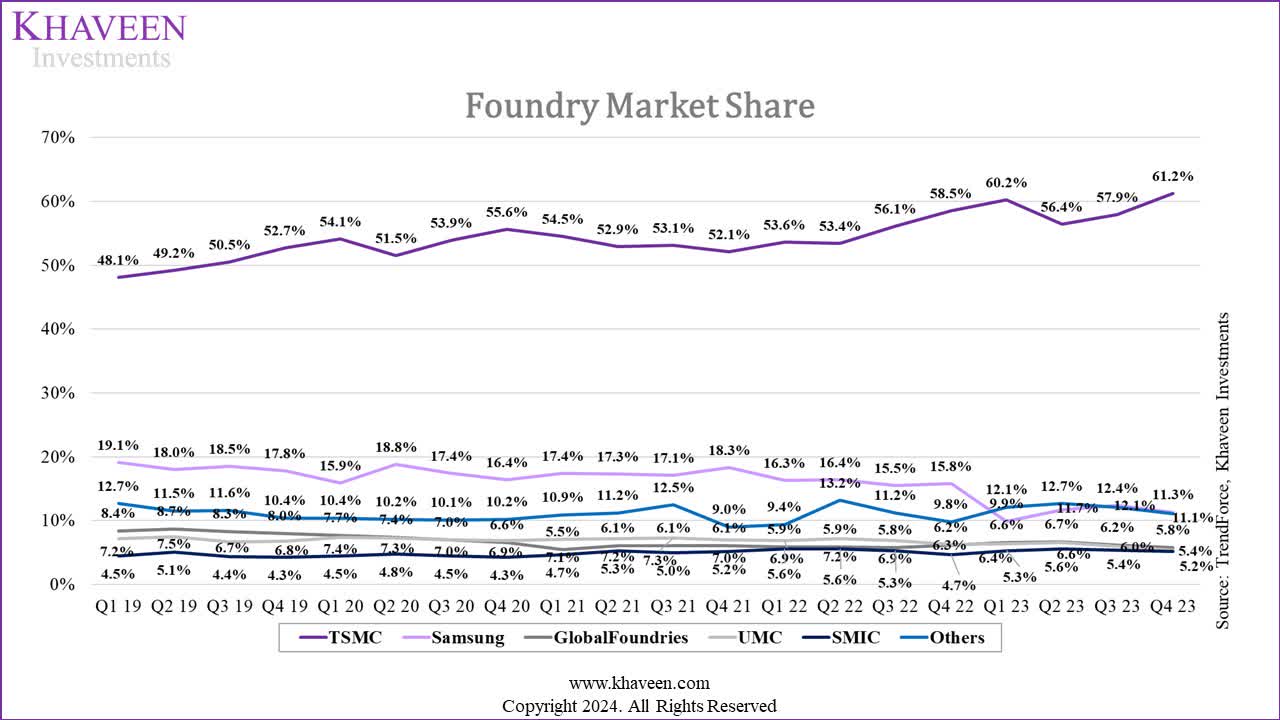
Based on the foundry market share chart above, TMSC remains the dominant market leader with the highest market share as of Q4 2023. However, its market share declined from 60.2% in Q1 2023 to 56.4% in Q2 2023 and before recovering to 61.2% in Q4 2023. According to TrendForce, during Q1 2023, TSMC was affected by the declining demand for PCs and smartphones leading to a decline in the utilization rates and revenue of the 7/6nm and 5/4 nm processes. In Q2 2023, the decline is attributed to end-market weakness as analyzed previously. Specifically, TSMC’s smartphone segment declined the most (-25% YoY) as we highlighted the smartphone market shipments contracted until Q2 2023 and started recovering only in H2 2023. Furthermore, we believe the decline could also be attributed to Apple, its largest customer, shifting towards 3nm chipsets for its next iPhone 15 models as its revenue from 5nm, which accounted for the majority of its revenue (30%) decreased compared to Q1 2023.
On the other hand, Samsung (OTCPK:SSNLF) remained in second place and saw its market share decrease to 9.9% in Q1 2023 from 15.8% in the previous quarter as its utilization rate decreased following the shift from Qualcomm (QCOM) (one of its top 5 customers), smartphone AP market leader, to using TSMC for its Snapdragon Gen 2 chips in 2023. However, Samsung’s market share gradually improved in Q2 (11.7%) and Q3 (12.4%), attributed to the orders of Qualcomm’s 5G application processors for mid-to-low range AP SoC, 5G modems, and 28nm OLET display driver ICs, according to TrendForce. Moreover, the company ramped up its new 3nm process but still below its Q4 2022 market share of 15.8%.
Furthermore, the remaining top competitors’ market shares, such as GlobalFoundries (GFS), UMC (UMC) and SMIC were relatively stable. Additionally, the market share of all other companies increased in Q1 2023 to 12.1% from 9.8% in Q4 2022 and again in Q2 2023 to 12.7% but moderated to 11.1% in Q4 2023, indicating an overall rise in market share of foundry companies outside the top 5.
Overall, we believe that the competition in the foundry market is getting more intense, reflected by the ramping up of 3nm process nodes by TSMC and Samsung and the rise in market share of other smaller foundry companies.
Highly Competitive in Foundry Sub-industry
In this point, we examine TSMC’s competitive position in the foundry market by updating its latest process technology and comparing it with its competitors. In our previous analysis, we highlighted that TSMC is a leader in process technology with its leading-edge process nodes based on EUV lithography and partnerships with large semiconductor chipmakers.
Process Technology Comparison
|
Process Technology Comparison |
TSMC |
SMIC |
Samsung |
GlobalFoundries |
UMC |
|
Process Node (Latest) |
3nm (N3E) |
7nm (N+2) |
3nm (3GAE) |
12nm (12LP+) |
14nm |
|
Year Launched |
2023 |
2021 |
2022 |
2018 |
2017 |
|
Transistor Density (MTr/mm2) |
215.6 |
113.6 |
150.0 |
36.7 |
32.8 |
|
EUV/DUV |
EUV |
DUV |
EUV |
DUV |
DUV |
Source: Company Data, WikiChip, Khaveen Investments
As seen in the table, TSMC and Samsung are the two companies with the most advanced technology (3nm) and EUV process. We also highlight the correlation between the process node technology and transistor density, as the lower process node has a higher density. Despite producing the same process node, TSMC’s Transistor Density (215.6 MTr/mm2) is significantly higher than that of Samsung (150MTr/mm2). UMC’s latest process node is the 14nm with a transistor density of 34.8MTr/mm2, the lowest among the 5 companies. According to CSET, greater transistor density improves speed and optimizes power consumption. Given the highest transistor density, we believe TSMC still maintains its competitiveness in the foundry market.
Customer Partnership Comparison
We also look at the number of partnerships between foundry companies and major customers as another factor of competitiveness.
|
Company |
TSMC |
SMIC |
Samsung |
GlobalFoundries |
UMC |
|
Apple (AAPL) |
2023 |
– |
– |
– |
– |
|
Microsoft (MSFT) |
2023 |
– |
– |
– |
– |
|
Samsung |
– |
– |
2005 |
– |
– |
|
Nvidia (NVDA) |
2023 |
– |
2020 |
– |
– |
|
Intel (INTC) |
2024 |
– |
– |
– |
2024 |
|
MediaTek (OTCPK:MDTTF) |
2023 |
– |
– |
– |
– |
|
AMD (AMD) |
2023 |
– |
2023 |
2021 |
– |
|
Qualcomm |
2023 |
2021 |
2024 |
– |
– |
|
Broadcom (AVGO) |
2023 |
– |
– |
– |
|
|
Sony (SONY) |
2021 |
– |
– |
– |
– |
|
Marvell (MRVL) |
2022 |
– |
– |
– |
– |
|
STMicroelectronics (STM) |
– |
– |
2014 |
– |
– |
|
Analog Devices (ADI) |
2024 |
– |
– |
– |
– |
|
NXP (NXPI) |
2023 |
– |
– |
– |
– |
|
Total |
12 |
1 |
5 |
1 |
1 |
Source: Company Data, Khaveen Investments
From the table, TSMC has the greatest number of top global firms as well as top semiconductor firms as customers at a total of 12. The partnerships were mostly for TSMC’s 3nm process node to develop their AI chips. The second-leading foundry is Samsung with 5 partnerships with companies including Nvidia, AMD, Qualcomm, STMicroelectronics and Samsung itself. This is as Samsung uniquely has a separate foundry business unit and separate chipmaking business unit allowing it to partner with itself to produce its own chips such as its Exynos application processors in its Galaxy series smartphones. Regarding the other three companies (SMIC, GlobalFoundries and UMC, although each company has only one partnership, we determined the partnership’s significance based on their revenue. With Intel’s revenue being larger than Qualcomm and AMD, we believe that the partnership between UMC and Intel is stronger than SMIC and Qualcomm, followed by the partnership between GlobalFoundries and AMD.
AI Factor Comparison
|
AI Factor Comparison |
TSMC |
SMIC |
Samsung |
GlobalFoundries |
UMC |
|
Apple |
M3 Ultra chip (CPU) and A18 Pro (AP) |
– |
– |
– |
– |
|
Microsoft |
Athena chip (GPU) |
– |
– |
– |
– |
|
MediaTek |
Dimensity 9400 (AP) |
– |
– |
– |
– |
|
AMD |
Zen 5 (CPU) and RDNA 4 (GPU) |
– |
Zen 5 Core (CPU) |
Ryzen products (CPU) |
– |
|
Qualcomm |
Snapdragon 8 Gen 4 (AP) |
– |
– |
– |
– |
|
Nvidia |
Blackwell architecture GPUs (GPU) |
– |
– |
– |
– |
|
Marvell |
AISCs |
– |
– |
– |
– |
|
Analog Devices |
“Wireless BMS (wBMS) and Gigabit Multimedia Serial Link (GMSL™)” |
– |
– |
– |
– |
|
Intel |
Arrow Lake and Lunar Lake GPU tiles (Integrated GPU) |
– |
– |
– |
– |
|
AI-Related Partnership |
9 |
0 |
1 |
1 |
0 |
Source: Company Data, Khaveen Investments
We continued to examine the partnerships to identify those that enable AI applications. We found that TSMC has partnerships with nine companies to produce AI chips, while Samsung and GlobalFoundries each have one order from AMD. Most of these orders are for 3nm process nodes, which are expected to enhance AI capabilities in both GPUs and CPUs, due to their high performance, as mentioned above. Specifically, TSMC’s 3nm nodes have secured orders from top chipmakers such as Qualcomm, AMD, and top companies by market cap including Apple and Microsoft. Though, Nvidia announced that it will use TSMC’s 4nm nodes for its Blackwell Architecture GPUs. According to Nvidia, GPUs can be regarded as AI chips due to their “parallel processing” capability, which enables them to simultaneously perform thousands of tasks and accelerate deep learning model training and inference. Microsoft has also revealed its use of TSMC’s 5nm process for its custom AI chip called Athena. Furthermore, the 3nm process nodes can also improve smartphone AP’s performance and advance AI capabilities, as mentioned by Apple (iPhone 15 lineup) and Qualcomm (Snapdragon 8 Gen 4).
Outlook
Overall, we believe TSMC remains the most competitive foundry among the top 5 foundries with the most advanced process technology. Furthermore, its 2nm process node is expected to be in H2 2025 with nanosheet transistors (GAAFET). In addition, it is expected to launch its extension line of a 2nm process node (N2P) in H2 2026 and a 1.4nm process node in H2 2027. Additionally, we believe TSMC’s wide customer reach with the highest number of partnerships with chipmakers and tech hardware companies such as Apple and Microsoft supports its growth outlook as well as its partnerships with customers for the production of AI chips.
Strong Revenue Growth
|
Ranking |
TSMC |
SMIC |
Samsung |
GlobalFoundries |
UMC |
|
Process Technology |
1 |
3 |
2 |
4 |
5 |
|
Customer Partnerships |
1 |
4 |
2 |
5 |
3 |
|
AI Factor |
1 |
5 |
2 |
3 |
5 |
|
Average |
1.00 |
4.00 |
2.00 |
4.00 |
4.33 |
|
Factor Score |
1.50 |
0.75 |
1.25 |
0.75 |
0.67 |
Source: Khaveen Investments
Overall, based on our comparison, we ranked the companies in terms of process technology, customer partnerships and AI factor. We ranked TSMC at the top and Samsung as the second place for all factors. Overall, we derived an average ranking of 1.00 for TSMC and derived a competitive factor score of 1.50x based on an equal weightage for each factor, indicating we expect the company to continue outperforming the foundry market growth. From its latest earnings briefing, management also believes it could outperform the foundry market growth this year. On the other hand, SMIC and GlobalFoundries were tied with a factor score of 0.75x, while UMC stood in the last place due to the lowest rank in both Process Technology and AI Factor.
According to TrendForce, the global foundry market is anticipated to increase by 12.1% in 2024. We believe this is attributed to the high demand for AI chips and the adoption of semiconductors in 5G and EV applications. We compiled the total foundry market revenue growth in the past 8 years below and compared it with TrendForce’s forecast for each year.
|
Foundry Market Revenues |
2015 |
2016 |
2017 |
2018 |
2019 |
2020 |
2021 |
2022 |
2023E |
Average |
|
Total Foundry Market ($ bln) |
49.3 |
53.5 |
54.0 |
61.1 |
68.4 |
85.1 |
103.9 |
136.8 |
117.4 |
|
|
Actual Growth |
8.6% |
0.9% |
13.2% |
12.0% |
24.5% |
22.0% |
31.6% |
-14.1% |
12.3% |
|
|
Average Historical Growth |
8.6% |
4.7% |
7.5% |
8.7% |
11.8% |
13.5% |
||||
|
TrendForce Forecast |
2.1% |
7.1% |
7.7% |
-3.0% |
6.8% |
11.0% |
13.3% |
-4.0% |
5.1% |
Source: TrendForce, Khaveen Investments
Based on the table above, the average revenue growth rate of the foundry market over the past 8 years stood is 12.3%. Furthermore, comparing the actual growth with the 8-year historical average (12.3%), in 5 out of the past 8 years, the actual growth was closer to the 8-year historical average compared to TrendForce’s forecast, thus highlighting the historical average growth as more accurate of the actual growth compared to TrendForce’s forecast. Therefore, we based our foundry market growth forecast for 2024 and beyond on the historical average of 12.3%. We compiled our revenue projection for TSMC from 2024 to 2026 in the table below.
|
TSMC Revenue Projections ($ mln) |
2023 |
2024F |
2025F |
2026F |
|
Wafer Revenue |
62,854 |
74,262 |
88,099 |
104,515 |
|
Growth % |
18.2% |
18.6% |
18.6% |
|
|
OSAT Revenue |
5,364 |
5,825 |
6,326 |
6,870 |
|
Growth % |
8.6% |
8.6% |
8.6% |
|
|
Others |
2,202 |
2,174 |
2,147 |
2,119 |
|
Growth % |
-1.3% |
-1.3% |
-1.3% |
|
|
Total Revenues |
70,419 |
82,261 |
96,571 |
113,504 |
|
Total Growth % |
-4.4% |
16.8% |
17.4% |
17.5% |
Source: Company Data, TrendForce, Yole Group, Khaveen Investments
As the company did not disclose its segments’ revenue in the 2023 annual report, we estimated the 2023 revenue for each segment based on its average revenue contribution in the past 8 years. We then forecasted Wafer revenue in FY2024 based on our calculated competitive factor score of 1.5x and multiplied by our forecasted foundry market growth of 12.1% based on the foundry market’s historical 8-year average as explained above. Additionally, we used the advanced packaging OSAT market CAGR of 8.6% from Yole Group to forecast the revenue for the OSAT segment. Lastly, we calculated the average growth rate of Others segment and estimated its revenue from 2024 onwards. Overall, despite a negative revenue growth rate in 2023, we expect TSMC’s revenue to grow strongly this year at 16.8% in 2024 and a forward average of 17.2%.
Risk: Intel Foundry Expansion
Tom’s Hardware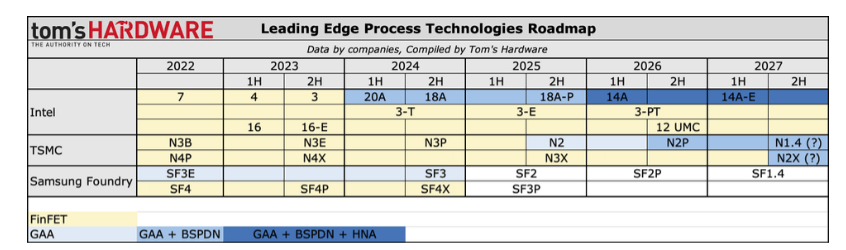
The diagram above summarizes the process technologies roadmap for the leading foundry companies including TSMC, Samsung Foundry, and Intel by Tom’s Hardware. In 2023, TSMC led the market with its 3nm process node that secured several orders from top chipmakers, whereas Intel launched their 5nm process node (Intel 3) and Samsung started working on their 2nd-gen 3nm process node (SF3). Despite having doubts about the roadmap timeline, Intel’s chips appear to be on track, as the Intel 7 and 4 nodes are already on the market and Intel 3 is being manufactured. Moreover, we expect 2024 to be another good year for Intel, as it starts to launch 2nm and 1.8nm process nodes (20A and 18A), and it will also be the first to launch advanced High-NA EUV lithography machines through its 1.4nm (14A). Furthermore, in February 2024, Intel announced a long-term partnership with Microsoft to manufacture its new custom-designed chip (the Azure Maia AI Accelerator and the Arm-based Azure Cobalt CPU) using Intel’s 18A process technology worth $15 bln in total. However, Intel’s foundry presence is still low compared to TSMC and Samsung with its minor market share and we see TSMC’s dominance unlikely to be caught up by Intel in the near future.
Verdict
Khaveen Investments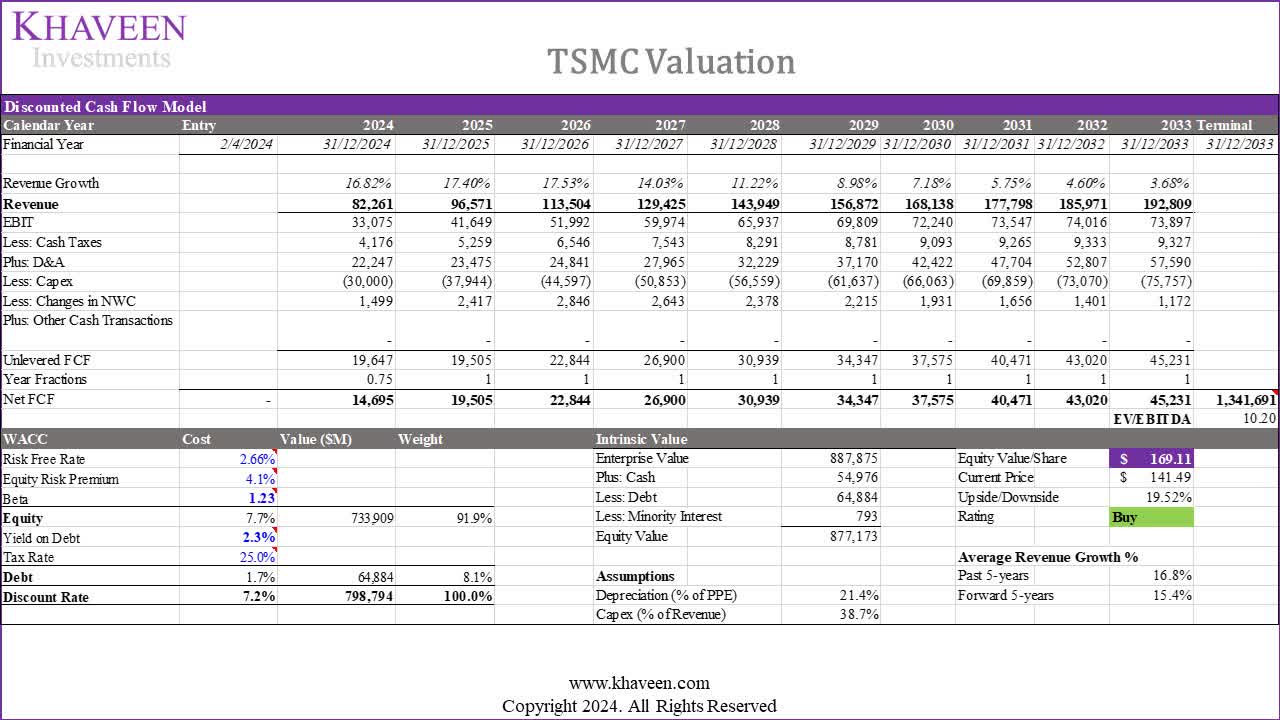
We updated our valuation of TSMC based on a DCF using a discount rate of 7.2% (company’s WACC) with a risk-free rate of 2.66% (China’s 10-year yield) and equity risk premium of 4.1% (expected return of Chinese equity). We used metrics from China in calculating the cost of equity for TSMC as we believe the company’s capital budgeting decisions and systematic risk are greatly integrated with the Greater China market. For example, Taiwan’s risk-free rate is much more aligned with China than the US and Taiwan’s share of exports to Greater China is 42.3%, triple than that of the US. Furthermore, our terminal value is based on the top foundries’ average 5-year EV/EBITDA ratio of 10.2x, which shows its shares have an upside of 19.52%.
In summary, TSMC’s foundry market share has had a turbulent 2023 with its market share declining in the first half of the year attributed to low utilization rates amid the PC and smartphone end market weakness before recovering in the second half of the year following the strong orders of its 3nm process technology. Furthermore, we are positive for the company to return to strong positive growth in 2024 with a forecasted growth rate of 16.8%. This is supported by the company’s competitive advantages where we determined its first-place ranking in terms of process technology, partnerships, and AI factor. Overall, we maintained the company as a Buy with a price target of $169.11, higher than our previous analysis of $130.21 due to our higher revised 5-year average revenue growth of 15.4% compared to 12.1% previously and higher EV/EBITDA multiple based on the top foundries’ average 5-year EV/EBITDA ratio of 10.2x compared to 6.42x previously.
Editor’s Note: This article discusses one or more securities that do not trade on a major U.S. exchange. Please be aware of the risks associated with these stocks.
Analyst’s Disclosure: I/we have a beneficial long position in the shares of TSM either through stock ownership, options, or other derivatives. I wrote this article myself, and it expresses my own opinions. I am not receiving compensation for it (other than from Seeking Alpha). I have no business relationship with any company whose stock is mentioned in this article.
No information in this publication is intended as investment, tax, accounting, or legal advice, or as an offer/solicitation to sell or buy. Material provided in this publication is for educational purposes only, and was prepared from sources and data believed to be reliable, but we do not guarantee its accuracy or completeness.
Seeking Alpha’s Disclosure: Past performance is no guarantee of future results. No recommendation or advice is being given as to whether any investment is suitable for a particular investor. Any views or opinions expressed above may not reflect those of Seeking Alpha as a whole. Seeking Alpha is not a licensed securities dealer, broker or US investment adviser or investment bank. Our analysts are third party authors that include both professional investors and individual investors who may not be licensed or certified by any institute or regulatory body.