Summary:
- This is a technical analysis article. Here is our daily report on stocks reporting earnings and showing all our Buy/Hold/Sell signals for each stock before earnings.
- At the top of the list is UnitedHealth, which has already reported earnings. You can see what our fundamental and technical signals were saying before earnings.
- Now that earnings are out, we can see that our signals underestimated earnings, so now we are ready to buy UnitedHealth Group on weakness and put it into our Model Portfolio.
- It was up 0.6% after earnings while the market was down over 2%. We expect it to continue outperforming the market and reaching for its old high.
- Using UnitedHealth as an example, you can see how we plan to make money after earnings, looking for positive surprises like UnitedHealth.
Olivier Le Moal
Here is our report that we publish daily on stocks reporting earnings and showing all our Buy/Hold/Sell signals for each stock before earnings. These are both fundamental and technical signals. Our most important signal is on the right side of the report, in the SID column, and we have circled all the scores in that column.
At the top of this list are stocks that already reported earnings on Friday. This enables you to see what our signals were saying before earnings and how our signals were surprised, so we can make money going forward. You have to love stocks that do better than our signals when they report earnings.
At the top of the list is UnitedHealth Group Incorporated (NYSE:UNH), and it came in with good earnings on Friday. You can see in the SID column that it had a strong Hold signal, but not a Buy signal, which is 80 to 100.
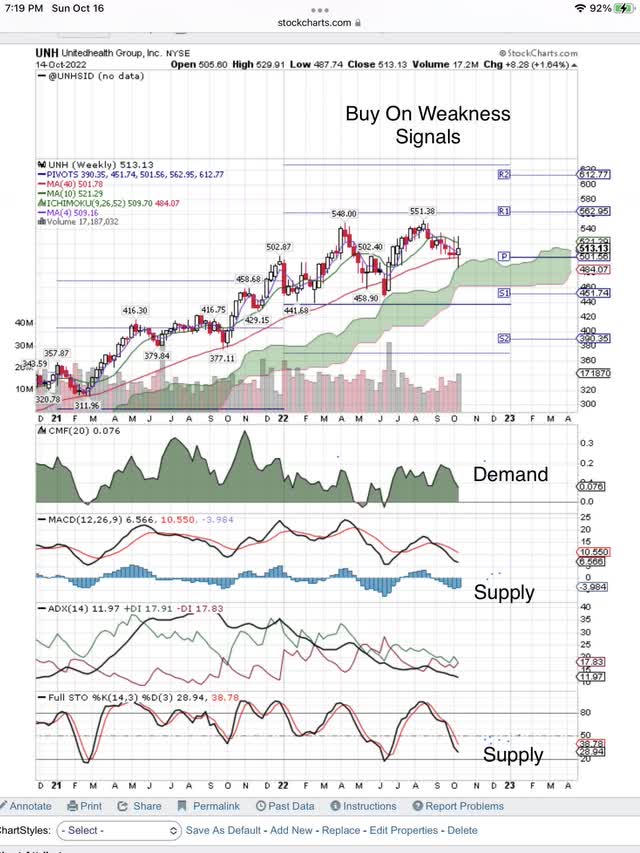
Here is the weekly chart for UNH, and you can see the pullback in price before earnings. We are going to use this weakness to add UNH to our Model Portfolio because we expect it to reach for its old high.
UNH Buy On Weakness Signals (StockCharts.com)
Unfortunately, the market is going down short term, so that will slow UNH’s move up. On Friday, it was up 0.6% when the market was down over 2%. We expect UNH to continue outperforming the SPY going forward. That is why we are adding it to our Daily Index Beaters Model Portfolio. This is the first stock to be added to our 2023 Model Portfolio, which will open now and close in 12 months.
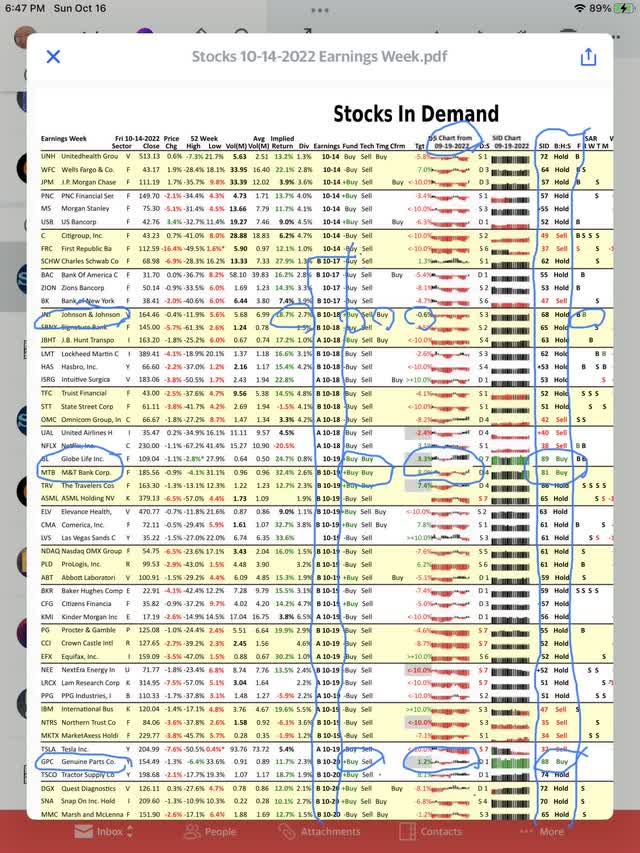
Here is our list of earnings stock that we publish daily showing all our fundamental and technical signals. Our most important signal, shown in the SID column, looks at all our signals and decides to give the stock our proprietary Buy/Hold/Sell Signal before earnings. We are looking for surprises like UNH to make money and beat the Index. This list and its signals make us proactive before earnings and ready to jump on the winners after earnings, just as we selected UNH, on price weakness, for our 2023 Model Portfolio.
Our Buy/Hold/Sell Signals For Stocks Reporting Earnings (StocksInDemand.com)
At the top of the above list, you will find UNH after it reported earnings on Friday. On the right-hand side of the report, in the SID column, you will find our most important Buy/Hold/Sell signal. The computer looks at our fundamental and technical signals and comes up with this proprietary signal. You don’t have to figure out our signals because the SID program does it for you. SID comes up with a 72 out of 100, strong Hold Signal for UNH. You could stop right here, but let’s look at some of the other signals. To the right of the SID score is a “B” under the “F” column. This stands for a Buy signal on Friday for the Stop-And-Reverse or SAR signal. This is a short term, technical signal that has reversed from a Sell Signal to a Buy signal and that is why it is so named.
Also, you can see our “buy on weakness” signal in the Timing, Tmg, column which tips us off to use the weakness we see in the chart shown above. On the fundamental side, you can see Buy signals in the Implied Return and Fund columns.
Now let’s go down the SID column and find some stocks that have our 80 to 100 Buy Signal. We have circled Globe Life (GL) and M&T Bank Corporation (MTB). You can see they also have buy signals in the Fund and Tech columns. We also circled the 20-day bar chart for Demand, black bars, and Supply, red bars. You can see both have Demand going into earnings. The amount of Demand on Friday is shown in the D:S column.
Further down the list is Genuine Parts Company (GPC), with an 88 grade, Buy Signal in the SID column. It also has a buy signal in the Fund and Implied return columns, color-coded green. In the Target, Tgt column, you can see our signal indicating an analyst raising a target. Likewise, on the 20-day bar chart, you can see black bars of Demand going into earnings with a Demand score of D1 out of a possible 9 shown in the D:S column.
Conclusion
We have both fundamental and technical signals before earnings, so we can be proactive before earnings. This helps us to make a well-founded and quick decision after earnings. That is precisely what we are doing with UNH, and our quick decision to add it to the 2023 portfolio that we are just starting for the next 12 months. As the earnings come out for other stocks, we will be adding up to 20 stocks to our 2023 Model Portfolio. We will keep you posted. Free cash in the Model Portfolio is placed in leveraged long and short ETFs depending on swings in this bear market.
Disclosure: I/we have no stock, option or similar derivative position in any of the companies mentioned, but may initiate a beneficial Long position through a purchase of the stock, or the purchase of call options or similar derivatives in ANY STOCK over the next 72 hours. I wrote this article myself, and it expresses my own opinions. I am not receiving compensation for it (other than from Seeking Alpha). I have no business relationship with any company whose stock is mentioned in this article.
Additional disclosure: Disclaimer: We are not investment advisers and we never recommend stocks or securities. Nothing on this website, in our reports and emails or in our meetings is a recommendation to buy or sell any security. Options are especially risky and most options expire worthless. You need to do your own due diligence and consult with a professional financial advisor before acting on any information provided on this website or at our meetings. Our meetings and website are for educational purposes only. Any content sent to you is sent out as any newspaper or newsletter, is for educational purposes and never should be taken as a recommendation to buy or sell any security. The use of terms buy, sell or hold are not recommendations to buy sell or hold any security. They are used here strictly for educational purposes. Analysts price targets are educated guesses and can be wrong. Computer systems like ours, using analyst targets therefore can be wrong. Chart buy and sell signals can be wrong and are used by our system which can then be wrong. Therefore you must always do your own due diligence before buying or selling any stock discussed here. Past results may never be repeated again and are no indication of how well our SID score Buy signal will do in the future. We assume no liability for erroneous data or opinions you hear at our meetings and see on this website or its emails and reports. You use this website and our meetings at your own risk.

Use our free, 30-day training program to become a successful trader or investor. Join us on Zoom to discuss your questions.
