Summary:
- Wells Fargo has a proven record of stable quarterly dividend payouts, though its yield is around 2.8% now and growth history mixed.
- Although loan growth appears to have declined, its fees-driven business segments have shown growth potential recently, which, I think, can grow future fees income.
- With such a huge loan book, it is exposed to loan charge-off trends like many banking peers, as well as Fed rate decisions.
- Its capitalization and liquidity coverage is above regulatory minimums.
- Its valuation appears relatively in line with key peers, while it is trading near its 200-day moving average.
wdstock
A Diversified Bank with 100+ Years of History
In today’s article, I saddle up and take on a banking giant by the horns, Wells Fargo (NYSE:WFC), which the SA quant system rated a hold today and who beat its most recent earnings estimates in July, while we await the next ones in early October.
Its SA company profile describes it briefly:
The company operates through four segments: Consumer Banking and Lending; Commercial Banking; Corporate and Investment Banking; and Wealth and Investment Management.
Since this company has a storied history dating back to 1852, as described in its official website, my article aims to answer the question: is this a sustainable long-term investment opportunity right now?
Research Methodology
As this is my first-ever coverage of this stock, my research approach is to start with the Seeking Alpha quant system rating for this stock, which today indicates a “hold”, and from that baseline conduct additional research from third-party sources, company presentations, and my own worksheets, to determine if my own rating will differ greatly and why, with greater weight on what this stock may do a year from now and beyond.
Dividend Yield Near 3% and Close to Peers
First I want to start with mentioning dividends, yield, and growth.
Right now, they’re paying $0.40/share quarterly, with a yield of 2.86%, but lack of steady and proven 10 year dividend growth. In fact, although quarterly payouts have been steady, its 5-year dividend growth is showing as -4.65%, according to SA data.
To compare its dividend yield vs peers, I picked the following 3 peers, as they are large-cap US-based banks with diversified global businesses. They are Bank of America (BAC), JPMorgan Chase (JPM), and Citigroup (C). Incidentally, Wikipedia lists these 4 banks as the largest in the US.
Here is a comparison of their dividend yield:
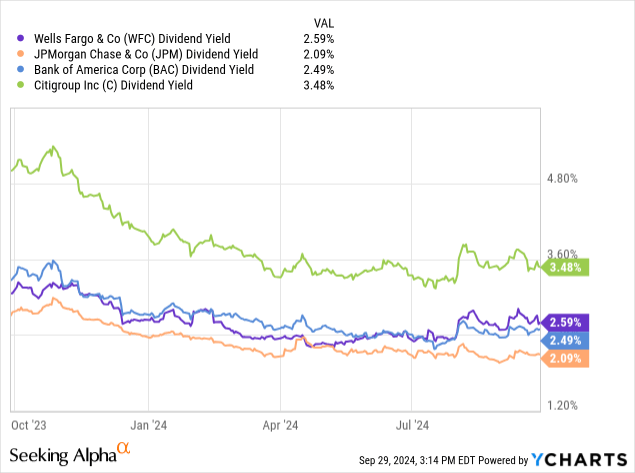
What the chart I created above tells me is that the dividend yield for Wells is relatively in the middle of this peer group, with no major outliers, and so I can expect a yield range of 2% – 3.5% from these stocks.
As these are all well-established banks, here is also a chart comparing their 10-year dividend growth, using YCharts data.
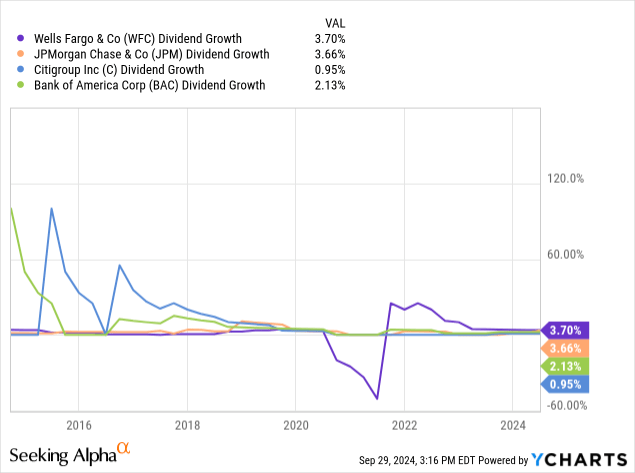
This data tells me that Wells is actually on the higher end of this peer group when it comes to 10 year dividend growth, however one cannot ignore that the 2020/2021 period was impacted by a global pandemic.
Some factors I think could help grow and sustain the dividend for Wells going forward will be continued positive cash flow, something it has proven to have for several quarters already, as well as continually growing earnings but also if it doesn’t realize major loan losses on its books, it may not need to reduce dividends.
Remember that a much smaller regional bank, New York Community Bancorp (NYCB) last year, for example, cut its dividend to $0.01/share after it saw a rise in its provision for credit losses.
With that said, next let’s talk about earnings, past and future potential ones.
Future Earnings Growth Impact from Rate Movements and Fees-Driven Segments
From the Q2 results and income statement, I see that the earnings YoY growth was relatively flat and unremarkable.
A key point to mention about this type of business is that a large chunk of revenue comes from interest income, to the tune of $22.8B in gross interest income. However, on a YoY basis the growth in interest expenses also impacted this metric which resulted in a decline in “net” interest income.
One look at its balance sheet indicates this firm owns $917B in gross loans.
Where the firm grew its top-line on a YoY basis seems to be items like service fees, trust income, and trading.
On a positive note, its provision for loan losses came down on a YoY basis.
In his Q2 comments, CEO Charlie Scharf remarked on some of these trends:
We continued to see growth in our fee-based revenue offsetting an expected decline in net interest income. The investments we have been making allowed us to take advantage of the market activity in the quarter with strong performance in investment advisory, trading, and investment banking fees.
So, my perspective is that what could help this stock a year from now is future fees driven by current growth in advisory clients and their monies flowing to Wells rather than other firms, as well as current loan growth to drive future interest revenue.
In addition, if recent Fed rate cuts continue into 2025, it could help decrease interest expenses but also could impact interest revenue too, so perhaps a double-edged sword. The trusted indicator I use to get an idea of rates is CME FedWatch, which for now shows a 53% probability of further rate declines after the Fed’s November meeting.
The analyst consensus data shows an EPS estimate of 5.09 for fiscal ending December 2024, for a nearly 3% YoY decline, while there have been 11 downward revisions and only 8 upward. The EPS estimate for Dec. 2025 looks better, with a nearly 7% YoY growth expected.
When taking a look at recent loan growth, the data tells me that Wells has been on a downtrend in this regard, particularly with mortgages and auto loans:
WFC – loan growth (WFC q2 presentation)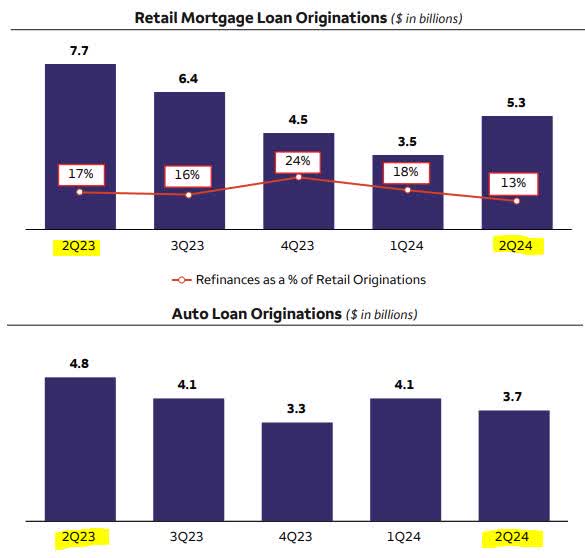
I think this could potentially cause declining future interest income, however another sector that I want to call out for its potential is wealth/investment management. According to the Q2 presentation, “non-interest income up 12% YoY and up 3% from 1Q24, driven by higher asset-based fees reflecting an increase in market valuations.”
Also, I want to point out that there has been YoY growth in advisory, brokerage, and total client assets managed, as the table below from their Q2 data shows, which, I believe, could help drive future fees-driven revenue.
WFC – wealth/investment (WFC q2 presentation)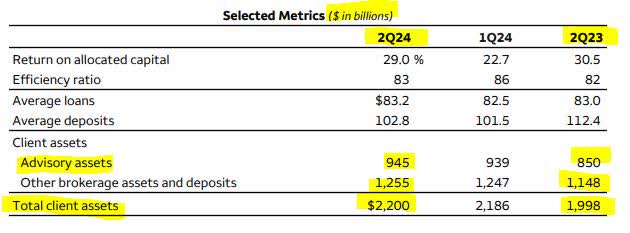
So, I think we can expect a mixed bag for this bank in the next year, as there could be an impact from declining loan growth but a boost from its non-interest, fees-driven segments.
Returning to my earlier comment about the income statement, though, a firm like this with over 61% of total revenue coming from net interest income will likely be more impacted by rate movements than other types of businesses. That is something to consider as a potential investor.
Knowing that potential earnings picture, next I want to discuss the current share price and valuation, and whether it could be justified.
Trading Close to Moving Average, and Valued Close to Peer Average Multiple
Here is what today’s share price looks like, which I compared against its 200-day SMA for the last year:
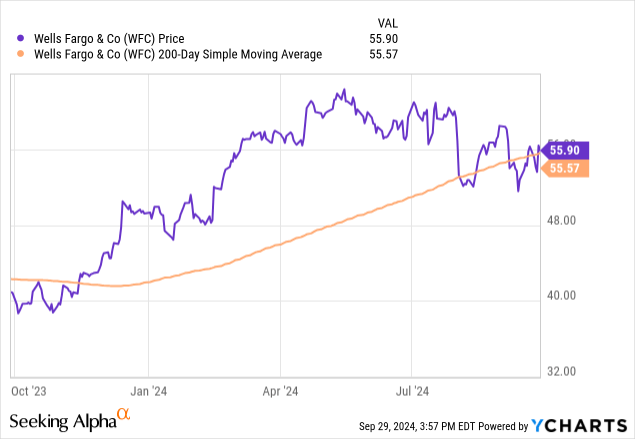
The chart tells me the stock is trading pretty much in line with its moving average.
Here is how it looks on a 10-year comparison, which shows the stock is well past its pandemic-era lows but still remaining below its 10-year high which seems to have been in 2018 when it was trading well above $60.
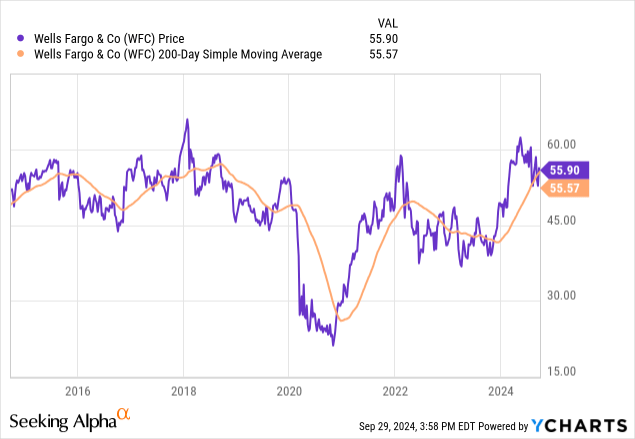
Obviously, the pandemic era would have been an amazing mega-dip buying opportunity on this stock, when I think about the price spread vs today and potential capital gain that could have been achieved. What this chart also shows is the resiliency of this stock and its ability to rebound nicely from such a major global impact. Earlier, I mentioned the importance of long-term sustainability.
However, let’s see where the market is valuing this stock today. For this, I will compare the forward P/E ratios of this stock vs peers.
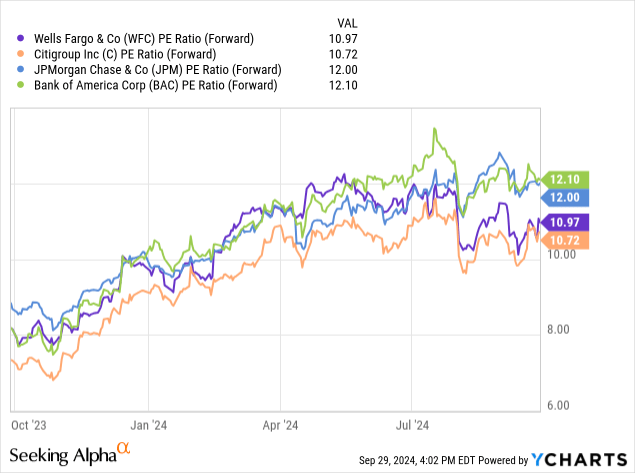
The P/E comparison I created above puts Wells somewhere in the middle of this peer group, which also does not have any extreme outliers in terms of forward earnings multiples. Using this data, I created the following comps analysis:
WFC – comps analysis (author worksheet)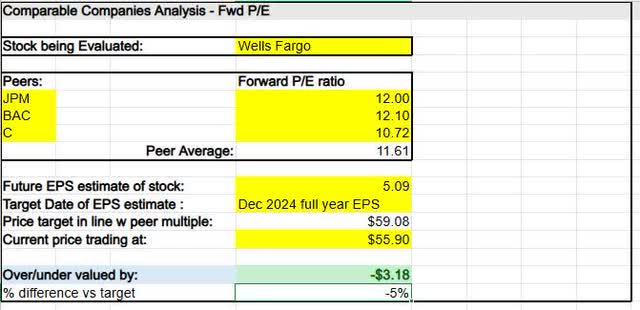
From this worksheet, which uses the peer average fwd P/E multiple and the expected future EPS for Wells, I am getting that its current share price of $55.90 is undervalued by 5%, as it ought to be closer to $59.
I typically allow for a +/- margin of 10%, so in this case an undervaluation of 5% vs the peer average multiple is practically in line with peers. This tells me the market believes this stock will likely behave similar to other large-cap banks.
I think this is a realistic assumption since all 4 peers will be impacted by Fed rate decisions, for example, but they all have some similar business lines like loans and fees-driven segments too.
They would not be comparable, however, a financial stock like Raymond James (RJF), for example, who does not engage in consumer banking/lending but is more focused on being an asset manager and banker to private clients.
To add another valuation metric to this mix, we can also see from SA data that the forward P/B ratio for Wells is only 3% below the overall sector average, so I think it is practically in line with the sector on price-to-book multiples.
Now that I have determined that this stock is valued relatively close to key peers, and trading close to its moving average, I want to move on to a quick discussion of risk factors to consider which could pose both a downside and upside risk, since my baseline rating for this stock is a “hold”.
A Low/Medium Risk Profile Driven Largely by Loan Charge-off Trends
Interestingly, I think a discussion of risks is one of the most important when it comes to investing in a bank like Wells Fargo since the Financial Stability Board in 2023 included it in its list of global systemically important banks.
We already mentioned the risk impact of Fed rate decisions and their likelihood going forward, so I want to have a look at their capital and liquidity picture as another risk factor:
WFC – capital and liquidity (company q2 presentation)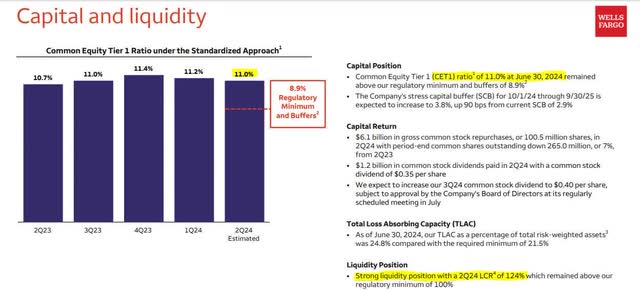
Some key points to call out from this data are that the firm has a liquidity coverage ratio (LCR) of 124%, exceeding its regulatory minimum of 100%, as well as a CET1 of 11% which also exceeds minimums. Further, we can see from the chart that the firm has a continuous trend of exceeding CET1 ratio minimums.
I think this is an important metric, since a bank like Wells could be greatly scrutinized by regulators for its capitalization, while any news headlines of its capitalization dropping drastically could lead to frightened investors selling shares, causing the stock to dip.
Another risk factor is rising trends in bad debts, and for this, I prefer to look at data on net loan charge-offs, as shown below:
WFC – net loan charge-offs (WFC q2 presentation)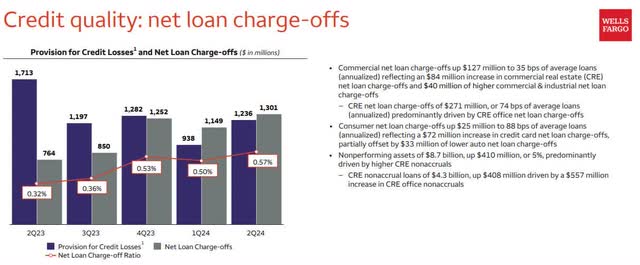
What the data tells me is that net loan charge-offs have gone up on a YoY basis, and the net loan charge-off ratio has trickled upward from 0.32% in 2Q23 to 0.57% in 2Q24. The company comments next to the data indicate a driver of this is “CRE net loan charge-offs of $271 million, or 74 bps of average loans (annualized) predominantly driven by CRE office net loan charge-offs.”
However, it should be pointed out that all of this was before the recent Fed rate cut of 50bps, and so I think things could change going forward.
Just 10 days ago, a Reuters article said the following:
The Fed cut reduces uncertainty over the borrowing costs and the economy,” said J.P. Morgan analyst Steven Alexopoulos.
We expect a lower funds rate to ignite commercial borrower demand for loans.
Further, I want to point out the following data from the Federal Reserve, which indicates that among the 100 largest banks the charge-off rate on total loans is around 0.75, which puts Wells Fargo below this, and we can see also that a significant jump in the charge-off ratio for commercial real estate happened when comparing 2022 and 2024, so it is not a risk unique to Wells Fargo but to all the largest banks.
Federal Reserve – top banks charge off rates (Federal Reserve)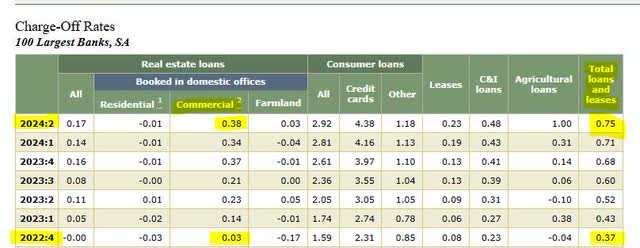
From some of the risks discussed, I created the following risk chart:
WFC – risk chart (author worksheet)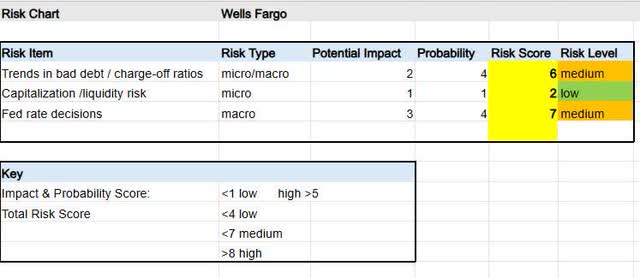
In my risk table, I determined that the trends in bad debt/charge-offs posed a medium risk, particularly since they are largely driven by commercial real estate risk. Capitalization/liquidity risk was determined to be low level, while the risk level of Fed rate decisions is medium at this point.
Impression: Hold for Steady Dividend Income
This is a synopsis of the case I made in today’s article, with supporting evidence already provided above:
Wells is valued close to key peers and trading close to its moving average, its dividend yield of 2.8% is close to key peers and the future dividend growth prospects could be impacted by earnings and cashflow but otherwise appear sustainable, its Q2 earnings growth was unremarkable and future growth could be impacted by declining loan growth but boosted by growth in fees-driven segments.
The risks considered include trends in loan charge-offs, impact from Fed rate decisions, and capitalization/liquidity, and all of these could pose both downside and upside risks to current investors. The risk profile overall was determined as low-to-medium.
My impression of this stock is that it is a “hold”, which is in line with the SA quant system rating of hold.
In the big banking space, when considering firms like Wells who have large exposure to loan books and consumer banking, I prefer to buy when undervalued to peer multiples by at least 10%, and trading at least 5% below its moving average, to maximize upside and capital gains potential.
There are far too many other banks in this space that have much bigger fees-driven business segments like custodian banking, asset management, and wealth advisory, which are less prone to interest-rate risk and bad debts, although I think Wells has some growth potential in a few of those segments and has shown this already in recent results.
At the current share price, I think it could be a good one to keep holding on to for the stable dividend income.
Analyst’s Disclosure: I/we have no stock, option or similar derivative position in any of the companies mentioned, and no plans to initiate any such positions within the next 72 hours. I wrote this article myself, and it expresses my own opinions. I am not receiving compensation for it (other than from Seeking Alpha). I have no business relationship with any company whose stock is mentioned in this article.
Seeking Alpha’s Disclosure: Past performance is no guarantee of future results. No recommendation or advice is being given as to whether any investment is suitable for a particular investor. Any views or opinions expressed above may not reflect those of Seeking Alpha as a whole. Seeking Alpha is not a licensed securities dealer, broker or US investment adviser or investment bank. Our analysts are third party authors that include both professional investors and individual investors who may not be licensed or certified by any institute or regulatory body.
