Summary:
- Back in July 2022, a Reuters report called, correctly, the chip industry is facing a toilet paper hoarding moment.
- The chip shortage experienced earlier in the year has turned into a glut at leading companies like Nvidia and Micron.
- This article shows the signs that the toilet paper hoarding issue may have peaked at Nvidia and Micron.
- Inventory is near a record in a decade and so is revenue contraction.
- Historically, chip cycles have demonstrated a duration of ~3.5 years. And I foresee the current contraction to end in mid to late 2023.
mindscanner/iStock via Getty Images
Thesis: chip glut and toilet paper hoarding
Back in July 2022, this following Reuters report correctly called out the beginning of a contracting phase for the chip industry.
The report calls the current stage the toilet paper hoarding moment for the chip business, for good ideas. Due to the chip shortage earlier in the year, companies started to hoard chips “just in case” they need them and cannot get them (just like people hoarding toilet paper when COVID first broke out). And quickly the shortage turns into a glut.
The report also pointed out that such a glut has caught industry leaders such as NVIDIA (NASDAQ:NVDA) and Micron (NASDAQ:MU) by surprise – in a very way the toilet paper hoarding surprised Procter & Gamble and Kimberly-Clark.
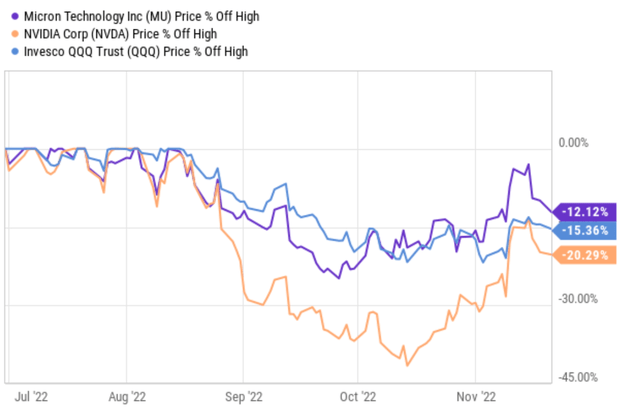
The timing of the report is a bit too earlier (but trying to time the market is a fool’s errand anyway). As you can see from the chart above, at that time, the chip sales growth is still positive (around 18% YoY) even though the growth has clearly passed a peak in 2021 Q4 and the growth is slowing down. However, the essence of the analogy is accurate as we will see in the remainder of this article. And both NVDA and MU (and also the overall tech sector approximated by QQQ) indeed have suffered substantial price declines since then. As seen, NVDA suffered a maximum drawdown of about 40% off its July level and MU about 22%. Even after the recent rallies, NVDA is still 20% below its July level and MU about 12%.
The remainder of this article will argue that signs are showing that their toilet paper hoarding issue may have peaked now. Their inventories are near a record level in a decade, and so are their revenue contractions. Historically, chip cycles have demonstrated a bottom-to-bottom duration of 3.5 years on average. And I foresee the current contraction to end in mid to late 2023. Furthermore, in the case of MU, the valuation seems to have already bottomed ahead of business fundamentals.
A historical perspective
The Reuters report showed data in the past 5 years only between 2018 and 2022, which only included about one cycle. The following plot included 10 years of data for both MU and NVDA to provide a broader historical perspective. As you can see, during the past 10 years, each of them went through about 2 full cycles. You can further see that their boom-and-bust behaviors not only share the same duration (3.5 and 3.8 years) but also very similar phases and even magnitudes (using the terminologies for a sine wave cycle). To wit, you can see that the first chip boom cycle of the past decade peaked in Q4 2013 and then peaked again in Q3 2017, translating into a cycle duration of about 3.5 years. The cycle then peaked again in Q3 2021, lasting for about 4 years this time. And the contracting cycle between Q1 2016 and Q4 2019 showed a similar duration of 3.8 years.
With this historical perspective, I will analyze the current status of their fundamentals to anticipate the next steps.
Source: Author and Seeking Alpha data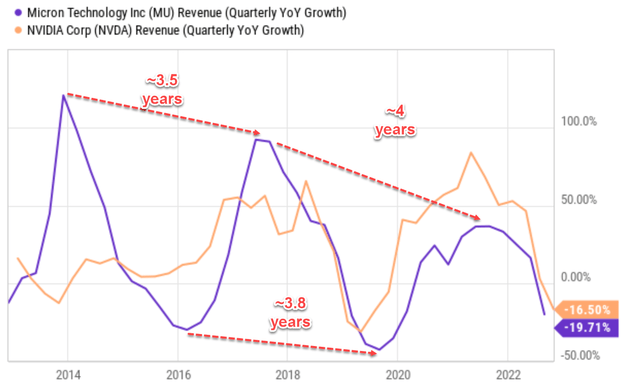
Inventories are at a peak level
Let’s first look at inventories, the clearest sign of the status of the cycle in my mind for a few reasons. First, the market will first have to absorb whatever inventories they currently hold. On the manufacturing side, NVDA and MU will have to sell their current accumulated inventory build-up first. And possibly at a discounted price if the market demand is low and the buildup is high – which seems to be the unfortunate combination now.
To wit, the chart below displays their inventory level, in terms of days of inventory standing. As seen from the top panel, MU’s inventory has historically fluctuated between 76.2 days to 143.3 days in the past decade. And the average inventory level is 101 days. NVDA’s inventory has fluctuated in a very similar range – between 63 days to 148 days with an average of 83.16 days. Now a few key observations:
- First, you can see the toilet-hoarding dynamics clearly from these charts too. Note how quickly the inventories went down from a record level in 2019 to be below average shortly after COVID break out. In a twisted way, the pandemic and the subsequent global supply chain congesting helped them to clear the peak inventory then, and at the same time also misled them to be overly confident about the growth prospects. As a result, as the Reuters report pointed out, they turned from a “just in time” mode to a “just in case” mode by hoarding inventory.
- Then the shortage turned into a glut. You can clearly see that their current inventory levels are near the peak level in a decade. In MU’s case, its current inventory stands at 139.5 days, only about four days below the record level and about 38 days above its historical average. And in the case of NVDA, its current inventory stands at 138 days, only about 10 days below its historical peak and more than 55 days above its historical average.
Source: Author and Seeking Alpha data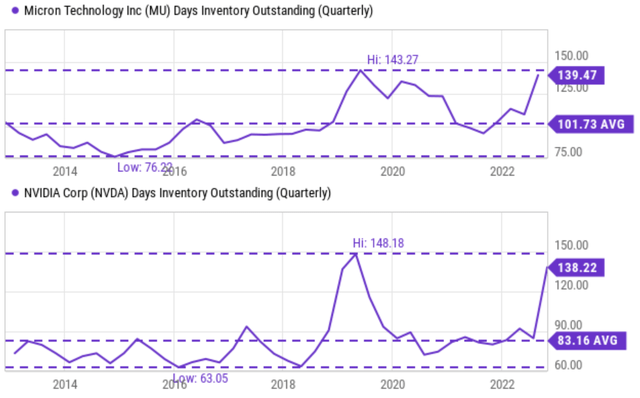
The forward-looking nature of PE
As mentioned in our earlier writing:
Experienced investors obviously know this simple fact: PE multiples are always forward-looking because investors are always forward-looking (like what I am doing here). And the current valuation always tries to price in future developments. Again, just like what I’m doing here – since I am predicting the contraction cycle to end in early 2023, the price I am willing to pay today is based on the condition that I predict for mid or later 2023, not the current conditions.
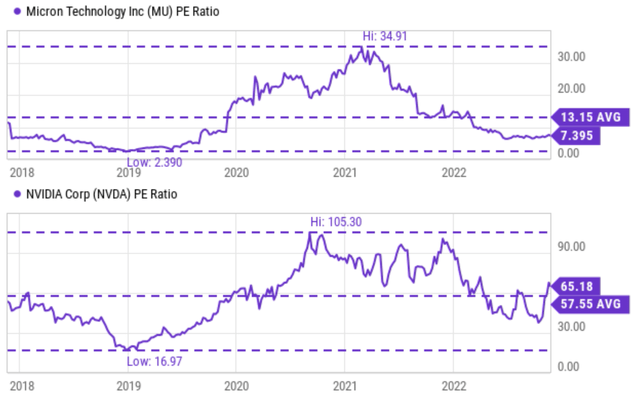
For this reason, valuation always changes ahead of business fundamentals, both in the boom-and-bust phases of the cycle as shown in the following charts. The fundamentals may have not reached a bottom yet, but their PE multiples have already corrected dramatically.
First, let’s recap the fundamentals. If you recall from an earlier chart, both companies have reported negative YoY quarterly sales growth already, a clear sign of the contraction phase. To wit, NVDA reported a negative 16.5% YoY quarterly sales growth last quarter and MU a negative 19.7% growth. And these levels of contraction were among the largest in their history in the past 10 years. However, as mentioned above, inventory is at a peak level. And the unfortunate combination of softened market demand and high inventory buildup could translate to slow shipment volume AND discounted price, causing further contraction in total revenues.
However, valuation always responds more hastily, and the chart below illustrates it quite clearly. The top panel shows the same YoY quarterly revenue as shown before, and the bottom panel shows the PE multiple. As seen, in the case of MU’s previous contraction cycle, its PE multiple reached a bottom at the end of 2018 while its contraction came to end in Q3 2019.
Thus, the PE led the fundamentals by about 3 quarters in this case. Take its previous expansion cycle as another example. As seen, its PE reached a peak level (34.9x) in Q1 of 2021 while its expansion did not peak until Q3 of 2021. And therefore, its PE led its fundamentals by about 2 quarters in this case.
Source: Author and Seeking Alpha data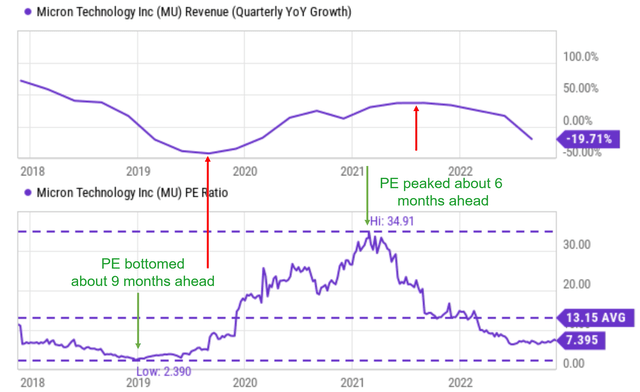
With the above background, let’s look at their current cycle and current PE multiples. As seen in the chart below, the PE ratio for MU has fluctuated between about 2.4x and 35x with an average of 13.2x in the past 10 years (an average over two full cycles). And as you can see, its current PE of 7.4x is only about half of its average PE and quite near the bottom level in a decade. The picture for NVDA is qualitatively similar but different quantitatively. NVDA’s PE has fluctuated between about 17x and 105x with an average of 57.55x. Its current PE of 65x is a far cry from its peak PE of over 100+. However, it is quite high in absolute terms and also a bit higher than its multi-year average.
Growth projections and expected returns
As you can see from the following consensus estimates, the EPS of MU is projected to contract to 1 cent and NVDA to $3.27 (vs. $3.85 for 2021). And as you can tell from my argument so far, I won’t be surprised at all if their contraction in 2022 and also the first half of 2023 turns out to be worse than these consensus estimates. Then starting mid-to-late 2023, I anticipate the contraction to end, and they would enter the next expansion phase. And consensus estimates indeed project about a 22% annual growth rate for MU in the next 4 years and about a 19% growth rate for NVDA.
In terms of expected turns, we like the return/risk profile for MU better. NVDA definitely offers superior profitability. MU’s ROCE, return on capital employed, is about 30%, about ½ compared to NVDA’s ~60%. And their growth rates are about similar as projected by the consensus estimates (in the range of 19% to 22%).
However, given their current PE multiples, all return from NVDA is expected to come from growth (assuming PE stays constant at 65x). But in the case of MU, its long-term returns can come from both growths (which is similar to NVDA) and also from its owner’s earnings yield because of its 7.4x PE (details for the analysis of owner’s earnings yield can be found in our blog article here).
Source: Author and Seeking Alpha data Source: Author and Seeking Alpha data

Risks and final thoughts
To recap, both MU and NVDA are going through a contracting phase of their cycle. They experienced a chip shortage in 2019~2020 after the pandemic and the global supply chain disruptions, which misled them to build a large inventory. Now the shortage has turned into a glut. Currently, their inventory levels are near the peak level in a decade (139.5 days for MU and 138 days for NVDA). Looking forward, there are considerable risks that they may need to clear their existing inventory at discounted prices because of the combination of softened market demand and high inventory buildup. Such risks could mean lower shipment volume AND lower price at the same time, causing further contraction in total revenues.
The historical chip cycles lasted for about 3.5 years, and I do not see the current downturn stage to be an exception. Clearing their existing inventory would take about 5~6 months, and I expect the current contracting to last into mid-to-late 2023. Finally, a cautionary word about predicting cycles:
To paraphrase Ben Graham, perfectly timing the cycle is a practical and emotional impossibility. Although having an overall sense of which stage we are in the cycle is not only possible but also sufficient to guide sound investment decisions already. I am not pretending that I can predict the details and specific timing precisely. But I’ve seen the movie and read the script multiple times before both in the chip sector and other cyclical sectors. And in the long term, NOT making fatal mistakes (like buying into MU at 30+ PE or NVDA at 100+ PE) is way more important than making brilliant calls.
Disclosure: I/we have a beneficial long position in the shares of MU either through stock ownership, options, or other derivatives. I wrote this article myself, and it expresses my own opinions. I am not receiving compensation for it (other than from Seeking Alpha). I have no business relationship with any company whose stock is mentioned in this article.
As you can tell, our core style is to provide actionable and unambiguous ideas from our independent research. If your share this investment style, check out Envision Early Retirement. It provides at least 1x in-depth articles per week on such ideas.
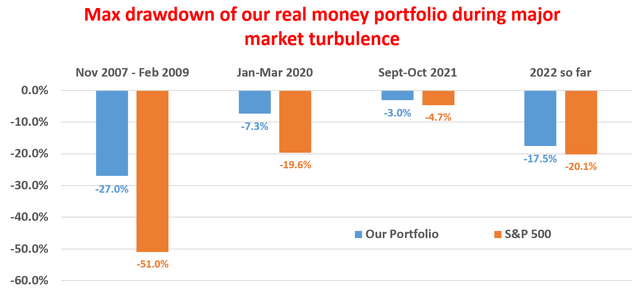
We have helped our members not only to beat S&P 500 but also avoid heavy drawdowns despite the extreme volatilities in BOTH the equity AND bond market.
Join for a 100% Risk-Free trial and see if our proven method can help you too.
