Summary:
- Dell’s inventory levels indicate the end of the contraction phase and the beginning of the expansion phase.
- Analysts have a positive outlook for Dell’s future earnings growth.
- I do see strong growth catalysts (such AI demand) that can support the positive projections.
- Its current valuation is also very reasonable in my view and offers a sizable discount compared to the sector.
hapabapa/iStock Editorial via Getty Images
Thesis
One key lesson I learned from Peter Lync’s writing is his insights on the use of inventory in stock analysis. To start, unlike many other financial data that are more open to interpretation, inventory is one of the less ambiguous financial data. Lynch then explained why inventory levels can be a telltale sign of business cycles. Especially for cyclical businesses, inventory buildup is a warning sign, which indicates the company (or sector) might be overproducing while the demand is already softening. Conversely, depleting inventory could be an early sign of a recovery.
And this is exactly what I am seeing at Dell Technologies (NYSE:DELL). Dell reported mixed results in recent quarters. For example, for 2023 (BTW, its FY ends in February 2024), its revenues decreased 11% compared to the previous year’s results. The decline was due to lower sales at both the Infrastructure Solutions and Client Solutions divisions. The former group was hurt by weaker demand for storage services, while the latter segment reported lower volumes from commercial and consumer customers.
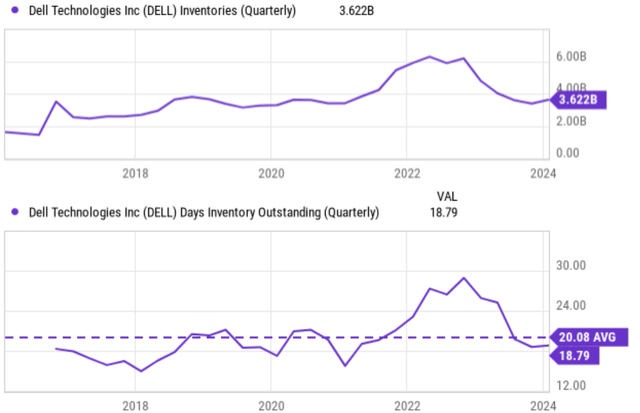
From the two charts below, you can see how the inventory built up in tandem. The chart below describes DELL’s inventory in absolute dollar amount (top panel) and in days of inventory outstanding (bottom panel). As seen, its inventory has been on an overall upward trend since 2018. It rose from about $2 billion to a peak level of more than $6B in later 2022. Its days of inventory outstanding (see the bottom panel) showed a similar upward trend. It also peaked in late 2022 at almost 30 days, far above its historical average of 20.1 days.
However, in recent quarters, its inventory began to deplete – rapidly. As seen from the top panel, the dollar amount almost halved from over $6B to the current level of $3.6B. And its days of inventory outstanding showed a similar extent of decrease. Its current level of 18.8x is below the historical average.
Judging by such inventory changes, I think DELL’s contraction phase of this current cycle is ending and it is entering the expansion phase. Next, I will argue that there are indeed plenty of areas that DELL can expand in the years ahead.
Growth catalysts
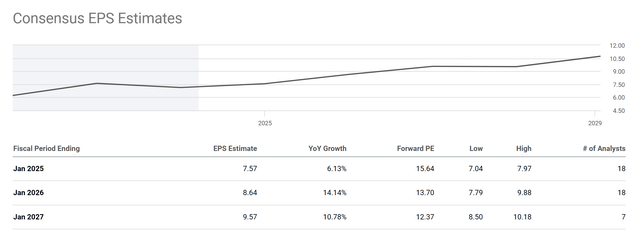
The next chart shows the consensus estimates of Dell’s future earnings growth along with the implied forward P/E ratios. As seen, overall, the chart suggests that analysts have a positive outlook for Dell’s future earnings growth and profitability. To wit, analysts estimate Dell’s earnings to grow 14% in FY 2026 and another 11% in 2027. Such growth would bring its EPS to about $9.6 in FY2027 from the 2025 level of $7.57. Thus, the implied P/E ratio in 2027 would only be 12.37x.
I see good reasons that can support the consensus’ positive outlook. I anticipate AI demand to be strong and be a key driver for DELL’s growth in the next few years. Even during the recent 1 year or so, while the overall business was suffering a sales decline, DELL has seen a strong demand for its AI products. For example, during Q4 2023, its AI-optimized server orders went up by about 40% sequentially. I think the company has just started to touch the AI opportunities ahead of it. Going forward, the company should have plenty of ways to capitalize on these opportunities. For example, DELL can help customers build Generative AI solutions that meet performance, cost, and security requirements. As another possibility, DELL could grow the Infrastructure Solutions segment by adding AI features there. Other more mundane – but equally important – growth catalysts in my view include disciplined expense management, its pricing power, and its favorable product mix.
As another sign to support the positive outlook, the board of directors just announced a 20% increase in the quarterly dividend, to $0.445 per share.
Valuation
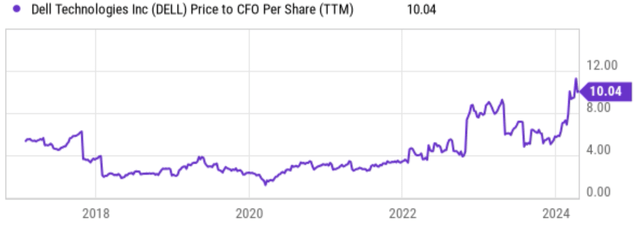
A key factor in some of the bearish arguments I’ve read involves DELL’s current valuation. The chart below shows DELL’s price to CFO (cash from operations) ratio in the past 10 years. And I can see why the current ratio can be off-putting. To wit, DELL’s Price to CFO currently sits at 10.04x, far above its historical level. Actually, it was among the most expensive levels in a decade. Other metrics can paint the same picture. For example, the second chart below summarizes DELL’s valuation grade, and you can see its valuation grade is D.
However, my view is different. My view is that its current multiples seem high only because its past multiples were too compressed. For example, the D grade above was purely because its current P/E is far above its 5-year averages, which were only 8~9x.
A P/CFO around 10x and P/E around 16x is nothing abnormal in absolute terms, especially for a solid business like DELL in my experience. And when compared horizontally (i.e., against the sector median), the stock is for sale at a large discount. To wit, the median P/E (Non-GAAP and TTM) for the sector is around 21x, and DELL is trading at a 20%+ discount in comparison. In terms of FWD P/E, the discount is even larger (more than 31%) due to DELL’s growth potential.
Other risks and final thoughts
In terms of downside risks, DELL faces the risks common to its Peers in the tech sector such as competition, rapid technological change, macroeconomic downturn, etc. There are a few risks that are more specific to DELL though in my mind. The top one is its dependence on the PC market. While Dell is diversifying its business, it still generates a significant portion of its revenue from personal computers. A decline in the PC market could hurt Dell’s overall performance and I do not have strong catalysts to propel PC demands in the near term. The second one involves the integration uncertainties associated with its recent acquisitions. Dell has made a number of sizable acquisitions in recent years, such as EMC and VMware. The integration of these businesses is still ongoing and the full (i.e., the expected synergic benefits) are yet to be seen in my view. There is a risk that the synergies may not be as great as expected.
All told, my conclusion is that Dell presents a compelling BUY thesis. The gist of my bullish thesis is that the contracting phases of the current cycle are ending, the expansion phase is beginning judging by the inventory levels. Analyst estimates suggest robust future earnings growth and I indeed see plenty of catalysts to support such projections. Finally, Dell’s current P/E ratio is still very reasonable in my view both in absolute terms and by comparison to the sector median.
Analyst’s Disclosure: I/we have no stock, option or similar derivative position in any of the companies mentioned, and no plans to initiate any such positions within the next 72 hours. I wrote this article myself, and it expresses my own opinions. I am not receiving compensation for it (other than from Seeking Alpha). I have no business relationship with any company whose stock is mentioned in this article.
Seeking Alpha’s Disclosure: Past performance is no guarantee of future results. No recommendation or advice is being given as to whether any investment is suitable for a particular investor. Any views or opinions expressed above may not reflect those of Seeking Alpha as a whole. Seeking Alpha is not a licensed securities dealer, broker or US investment adviser or investment bank. Our analysts are third party authors that include both professional investors and individual investors who may not be licensed or certified by any institute or regulatory body.
Join Envision Early Retirement to navigate such a turbulent market.
- Receive our best ideas, actionable and unambiguous, across multiple assets.
- Access our real-money portfolios, trade alerts, and transparent performance reporting.
- Use our proprietary allocation strategies to isolate and control risks.
We have helped our members beat S&P 500 with LOWER drawdowns despite the extreme volatilities in both the equity AND bond market.
Join for a 100% Risk-Free trial and see if our proven method can help you too. You do not need to pay for the costly lessons from the market itself.

