Summary:
- AAPL is on the verge of completing a golden cross formation, which technical analysts consider a bullish pattern.
- Golden cross occurs when a stock’s shorter-term moving average (in this case the 50-DMA) crosses up through a longer-term moving average (in this case the 200-DMA) as both are rising.
- In the post-iPod era, AAPL has experienced five iron crosses, with the most recent being in March 2024.
ozgurdonmaz
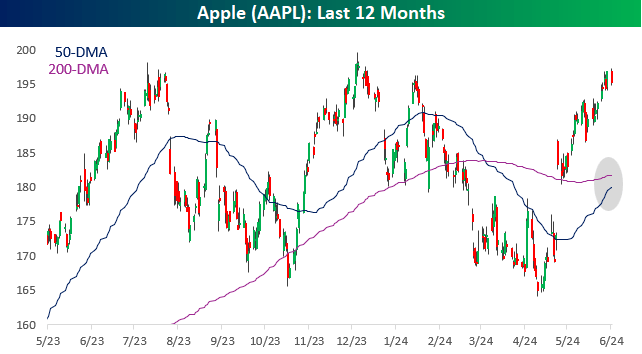
For over a year now, shares of Apple (NASDAQ:AAPL, NEOE:AAPL:CA) have been stuck between the low $160s and the high $190s as the market impatiently waits for the company to outline its AI strategy. In just the last seven weeks, though, the stock has tested both ends of the range, and ahead of today’s Worldwide Developers Conference, shares of AAPL are modestly pulling back from the top end of the range. In case you missed it, in last week’s Bespoke Report, we discussed the stock’s performance leading up to, during, and after prior conferences, including its performance when it rallied in the weeks leading up to the conference.
As the stock has rallied from its lows in the last several weeks, AAPL is on the verge of completing a golden cross formation, which technical analysts consider a bullish pattern. A golden cross occurs when a stock’s shorter-term moving average (in this the 50-DMA) crosses up through a longer-term moving average (in this case the 200-DMA) as both are rising. Conversely, the opposite of a golden cross is an iron cross, which occurs when the short-term moving average crosses down through a longer-term moving average as both are falling.
As recently as May 1st, AAPL’s 50-DMA was more than 5% below its 200-DMA, but that spread has narrowed quickly in the last six weeks to less than 1% today. The gap is also continuing to narrow fast, and barring an absolute plunge in the stock, it’s likely that the 50-DMA will cross up through the 200-DMA within a week or so.

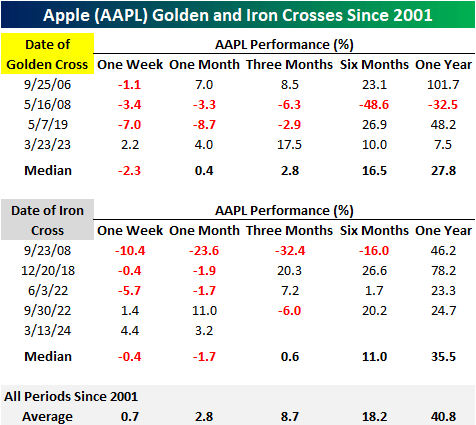
While golden crosses are a positive technical formation in theory, they don’t necessarily play out that way in practice. The table below summarizes the performance of AAPL after each prior golden cross and iron cross in the post-iPod era (since 2001).
After the four golden crosses, AAPL traded down over the next week three out of four times, and one and three months later, it was only up half the time. Six and twelve months later, AAPL’s stock was higher three out of four times, with the lone exception being its performance after the golden cross in May 2008 just ahead of the financial crisis.
In the post-iPod era, AAPL has experienced five iron crosses, with the most recent being in March 2024. Performance following these prior occurrences was similarly weak over the short term, but six and twelve months later, median returns were stronger than after golden crosses.
What stands out concerning performance following both golden and iron crosses, though, is the fact that the median returns for both golden and iron crosses are weaker than the average for all periods.

Editor’s Note: The summary bullets for this article were chosen by Seeking Alpha editors.
