
Summary:
- GE is the ultimate example of how even the “world’s greatest company” and a dividend aristocrat can fail spectacularly.
- If the fundamentals decline, investors need to pay attention. MMM’s fundamentals are weakening, though its investment thesis remains intact.
- MMM’s 4.7% yield combined with modest 4.8% growth offers a decent but uninspiring 9.5% long-term return potential.
- 3M could potentially deliver 16% returns over the next five years due to a 34% discount to fair value.
- These two 7+%-yielding and faster-growing dividend aristocrats offer 2X to 3X MMM’s long-term return potential and represent strong to very strong buys today.
Baris-Ozer
This article was originally published on Dividend Kings on Tuesday, December 6th.
A comfortable or even rich retirement is the dream of all investors. If you want to build life-changing wealth and retire in safety and splendor, there is no better strategy than blue-chip stocks.
Ben Carlson 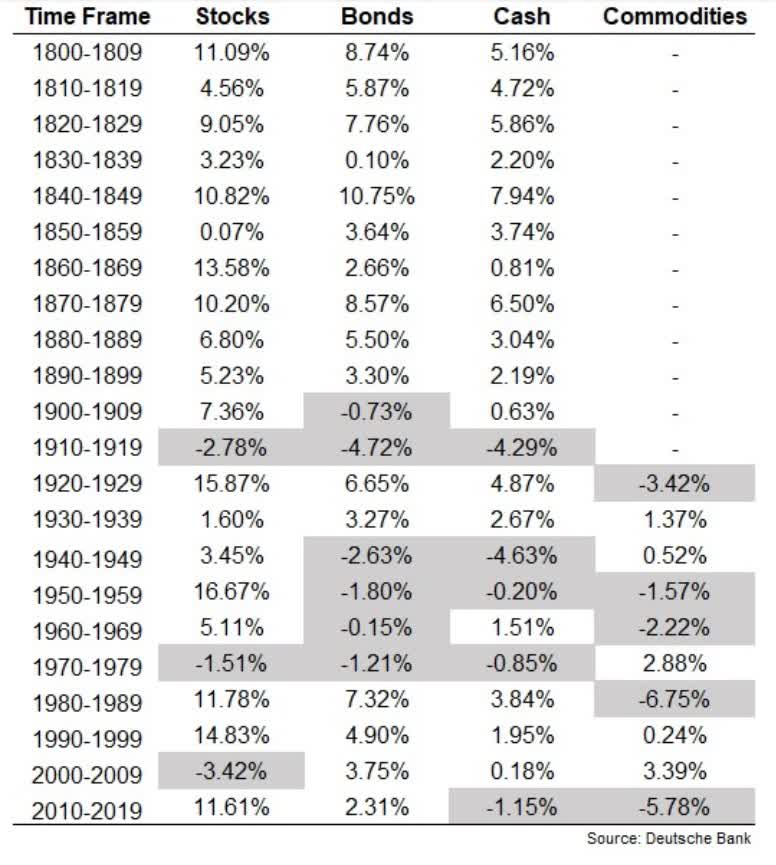
Despite many ups and down, the US stock market has delivered 7% annual inflation-adjusted returns for 220 years.
- An incredible 2.9 million X return
That same 7% real return is what investors have enjoyed in the past:
- 100 years
- 70 years
- 20 years
How can stocks deliver 7% real returns when the economy constantly changes? Because stocks are ownership in real companies, run by skilled managers and executives who adapt as challenges arise.
However, that doesn’t mean you can buy just any blue-chip, walk away for decades, and hope to get rich.
JPMorgan Asset Management 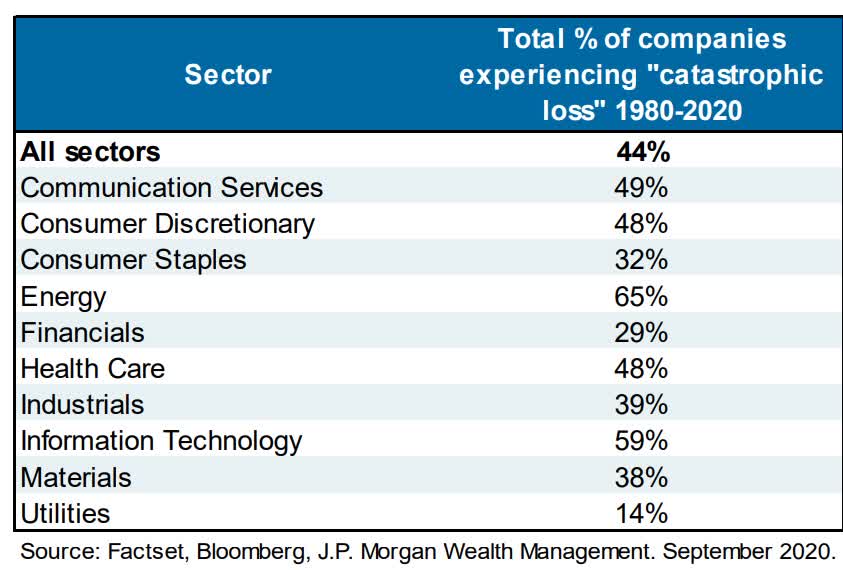
44% of all stocks fail catastrophically, meaning they fall 70+% and never recover. This can happen even to the bluest of blue-chips.
Back in 2000, General Electric (GE) was considered by many to be the greatest stock in the world.
- A-credit rating
- dividend aristocrat
- the world’s most valuable company
- Jack Welch, its CEO, was named Fortune “CEO of the Century.”
Ycharts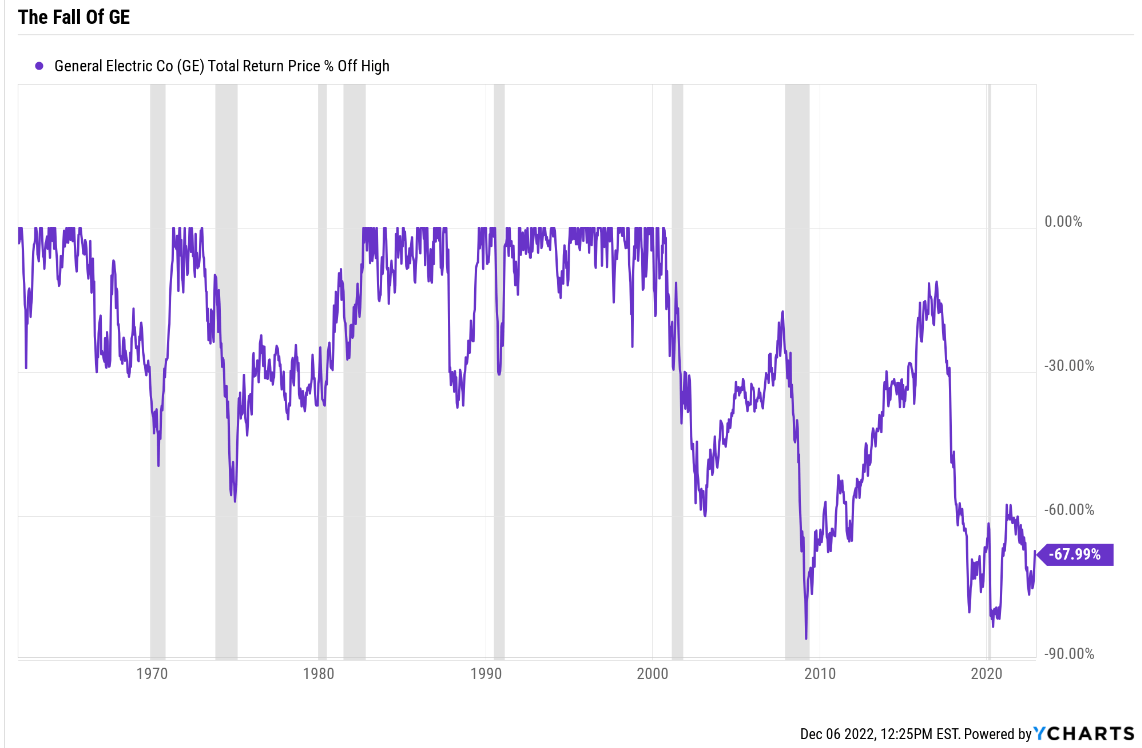
GE is still down 68% off its 2000 highs, including dividends. Dividends which, on an annual basis, it’s cut five times in the last 20 years.
And GE is just the most extreme example of a failed aristocrat.
- General Electric (68% below its 2000 high)
- AT&T (T) (zero inflation-adjusted returns for 20 years)
- CenturyLink (now Lumen Tech) down 77% off its highs in 2015 after two dividend cuts and then suspending its dividend entirely
- Winn-Dixie (bankrupt)
- K-Mart (bankrupt) was acquired by Sears (which also went bankrupt)
The point is that just because a company is a dividend aristocrat doesn’t necessarily mean it’s a “buy and hold forever” stock.
“Our favorite holding period is forever.” – Warren Buffett
This famous quote from the greatest investor of all time doesn’t mean buy and blindly hold forever. It means to buy and hold forever or until the fundamentals break, whichever comes first.
“When the facts change, I change my mind. What do you do, sir?” – John Maynard Keynes
There are no sacred cows at iREIT or Dividend Kings. Wherever the fundamentals lead, we always follow. That’s the essence of disciplined financial science, the math behind retiring rich and staying rich in retirement.
This brings me to the topic of 3M (NYSE:MMM), which has been struggling with a turnaround for several years. Recently 3M’s fundamentals have taken a turn for the worse, so I wanted to update Dividend Kings members about the good and bad about this 4.7% yielding dividend king.
I also want to offer Altria (MO) and Enbridge (ENB), and two higher-yielding and faster-growing aristocrat alternatives. Aristocrats who are currently firing on all cylinders and offer a more attractive reward/risk ratio than 3M.
The Good News About 3M
Ycharts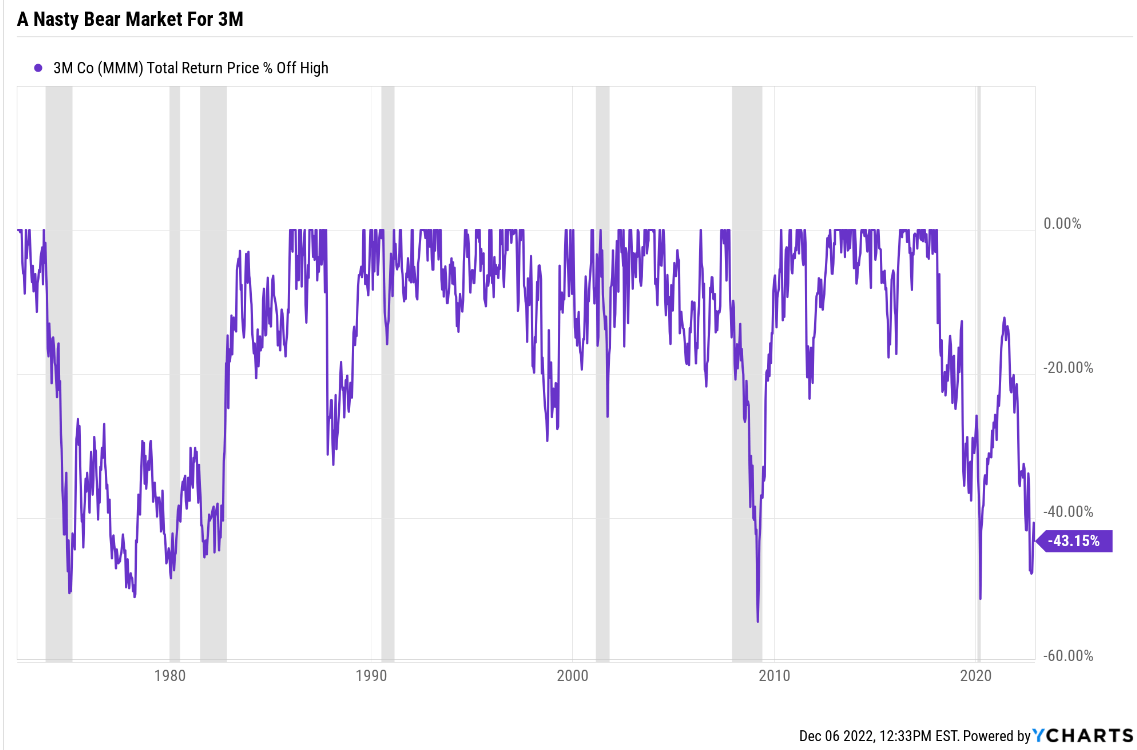
3M’s bear market began in 2018 and has now lasted four years. The stock has fallen by as much as 50% off its highs.
That alone doesn’t indicate the thesis is broken. After all, valuation explains much of 3M’s bear market.
FAST Graphs, FactSet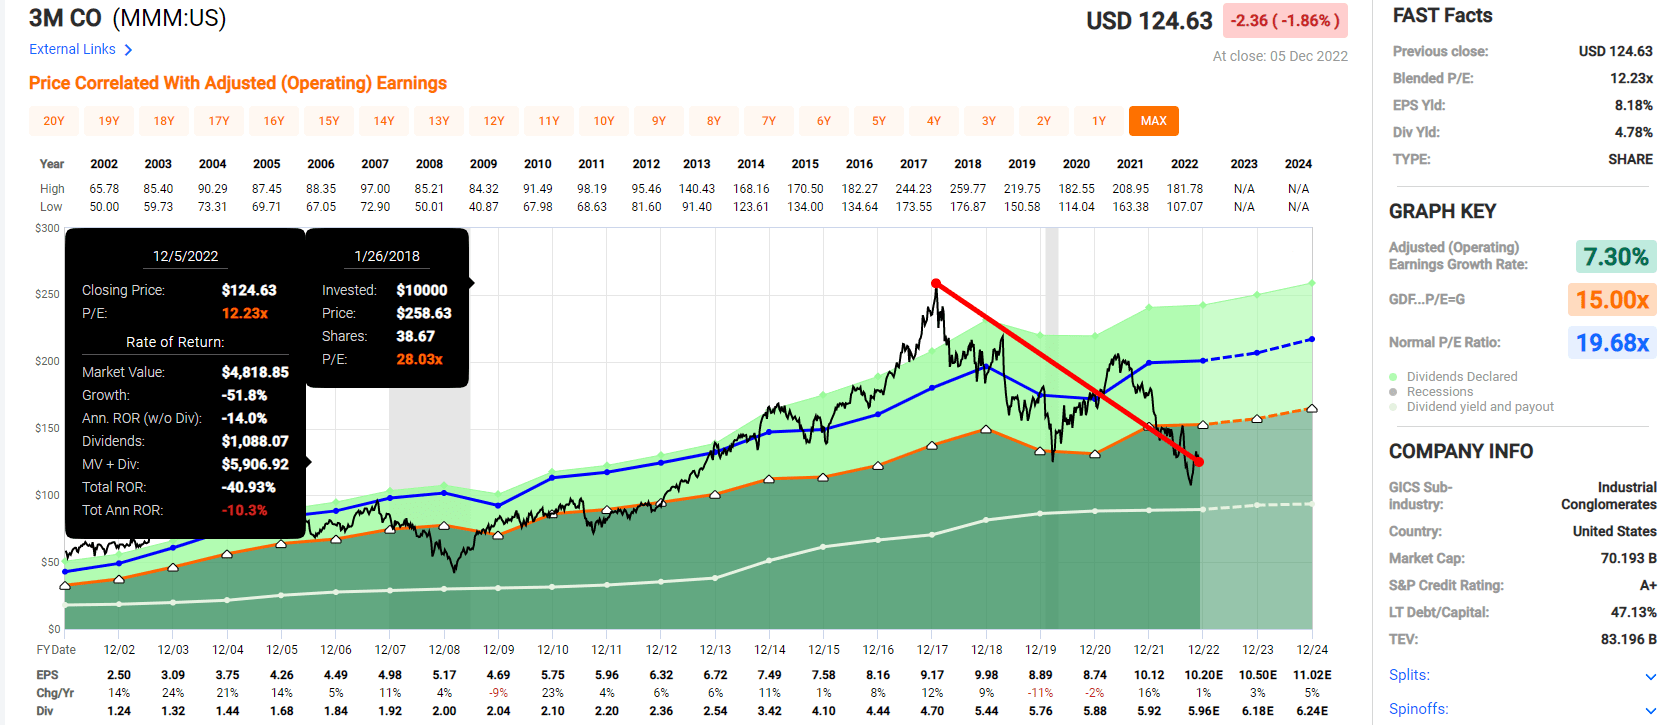
In early 2018, 3M was trading at nearly 30X earnings, a 50% historical premium. For context, the S&P 500’s peak valuation during the tech bubble was 25X, also a 50% historical premium.
Whenever a blue-chip becomes 50% historically overvalued, it’s a warning to either trim some or at least avoid it.
- BTI’s current bear market began when it was 50% overvalued
- MO’s current bear market began when it was 50% overvalued
- Midstream began its multi-year bear market when it became 50% overvalued
Blue-chip bear markets can last as long as seven years, and bubbles can last almost as long. Why? Because it takes 7 years for fundamentals to overtake sentiment and momentum to drive the majority of returns.
| Time Frame (Years) |
Total Returns Explained By Fundamentals/Valuations |
| 1 Day | 0.02% |
| 1 month | 0.33% |
| 3 month | 1.0% |
| 6 months | 2.0% |
| 1 | 4% |
| 2 | 12% |
| 3 | 20% |
| 4 | 28% |
| 5 | 36% |
| 6 | 47% |
| 7 | 58% |
| 8 | 68% |
| 9 | 79% |
| 10+ | 90% |
| 20+ | 91% |
| 30+ | 97% |
(Source: DK S&P 500 Valuation Tool, JPMorgan, RIA, Princeton, Fidelity, BAC)
3M’s earnings never fell 50%. In fact, they haven’t fallen at all.
- 2018 EPS: $9.98
- 2022 EPS: $10.20
- 2018 dividend: $5.44
- 2022 dividend: $5.96
3M’s bear market began due to high valuations when its growth stalled, partially due to the trade war. Since then, it’s faced the Pandemic, the 2023 recession, and of course, a troubled turnaround.
Its PFAS and ear plug liabilities are the single biggest source of fear, uncertainty, and doubt.
So is 3M the next GE or AT&T, or CenturyLink?
Nothing in wide-moat 3M’s latest results materially alters our long-term view of the firm…We were, however, caught off guard by the reduced sales guidance. Foreign exchange is a headwind, but even the organic guidance fell 75 basis points at the midpoint…
Litigation fears hover over 3M stock, which we think are responsible for the shares’ persistent price/value gap. While we think this discount implies far too high a liability related to its PFAS and Combat Arms litigation, 3M’s bankruptcy court loss removes a vital catalyst in the stock.”- Morningstar
Most likely not, as 3M’s recent weakness is mostly due to the global economic slowdown.
However, 3M’s fundamentals have weakened considerably, making me a lot less excited about the company.
3M’s Thesis Isn’t Broken
Ycharts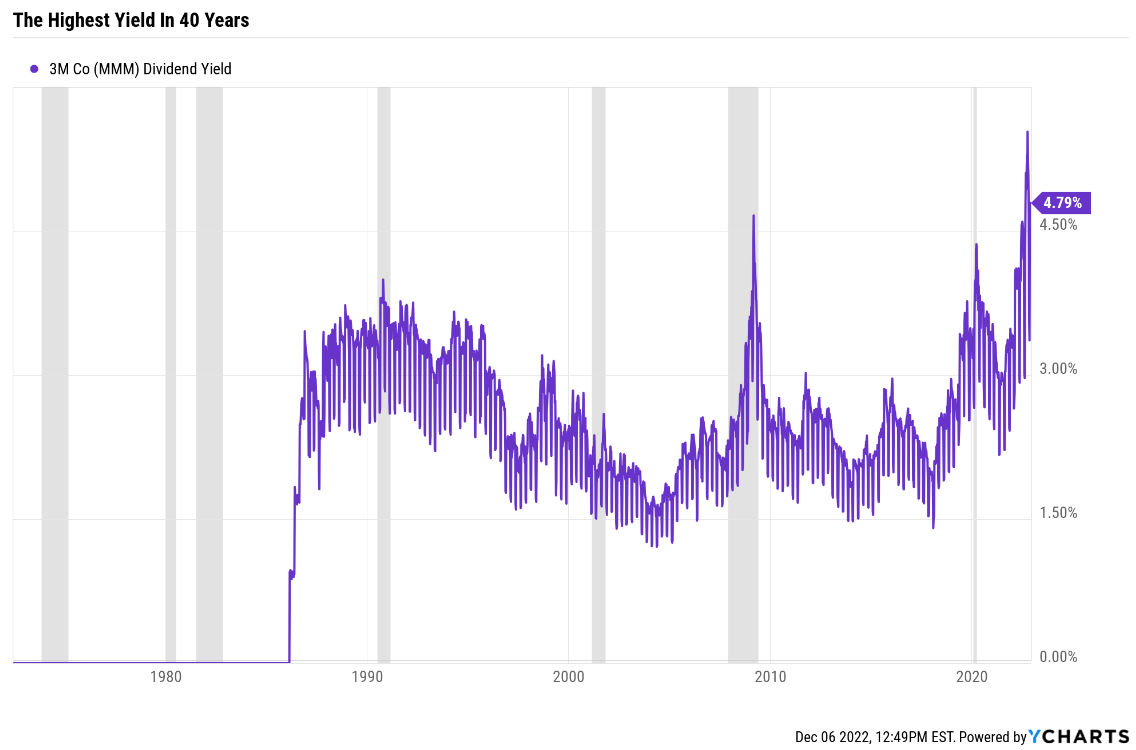
3M’s yield is at its highest in 40 years, other than the October 13th market low.
The investment thesis on 3M is the same as it is for all dividend blue-chips.
Ploutos 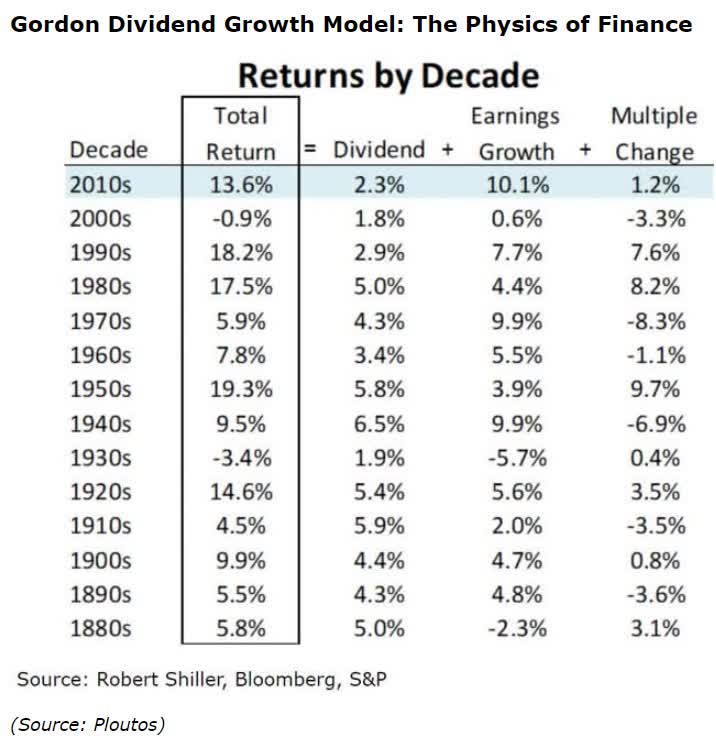
Yield + long-term growth = total returns, with valuations canceling out over 30+ years.
If the yield is attractive enough AND SAFE, then it doesn’t take much growth for a blue-chip to be a potentially attractive buy.
3M’s nearly 5% yield is enough to get a lot of investors’ attention, and the good news is that it’s still very safe. Why? Let’s start with the payout ratio.
- 2022 consensus: 63%
- 2023 consensus: 59%
- 2024 consensus: 56%
For context, rating agencies consider 60% or lower payout ratios safe for industrials.
How about 3M’s free cash flow stability?
FactSet Research Terminal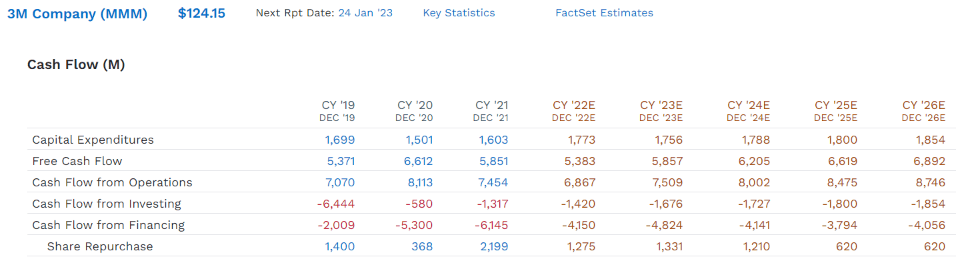
3M’s free cash flow has remained stable, if rather stagnant, and isn’t expected to reach new highs until 2025.
But the dividend, while slow growing, is expected to remain well covered by cash flow.
FactSet Research Terminal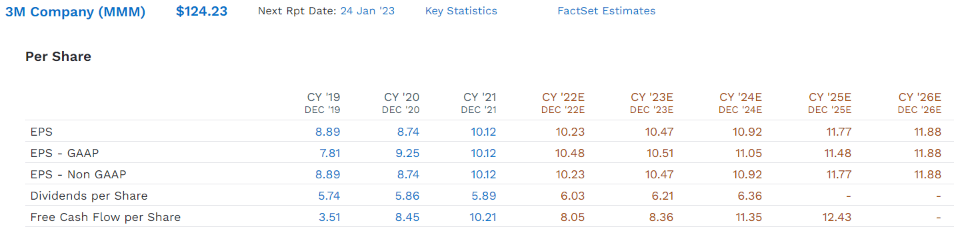
Ok, so free cash flow isn’t too much of a concern regarding dividend safety, but what about the balance sheet? If a company is drowning in debt, then even a well-covered dividend might not be safe.
FactSet Research Terminal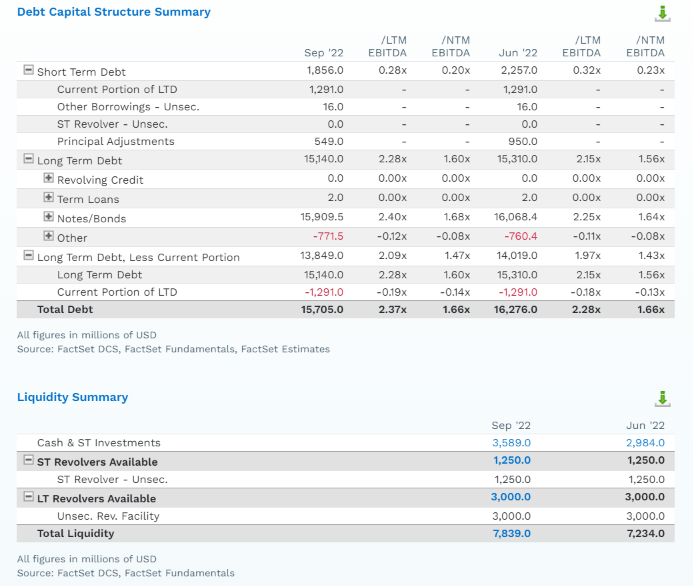
3M’s debt/EBITDA ratio is 2.4X and is expected to fall to 1.7X in 2023.
Rating agencies consider 3X or less safe for industrials, so 3M’s debt isn’t a concern, and it currently has $7.8 billion in liquidity.
FactSet Research Terminal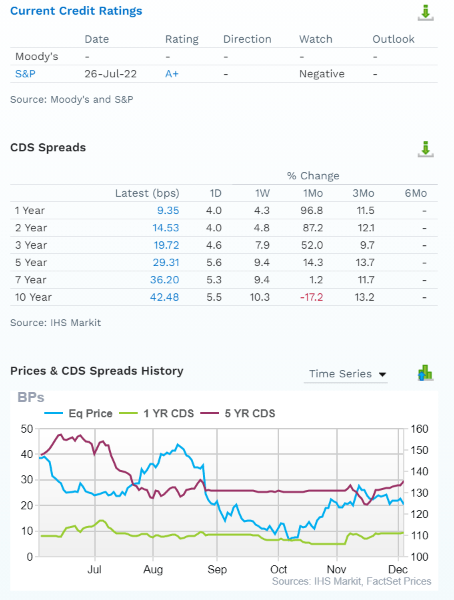
It’s still an A+ rated company, though with a 33% chance of being downgraded to A, according to S&P.
- due to legal liability concerns
- 0.6% 30-year bankruptcy risk that could increase to 0.66%
The bond market, via credit default swaps, provides real-time fundamental risk assessment and isn’t overly concerned about 3M either.
- the stock price is a lot more volatile than its fundamental default risk
- which remains very low on an absolute basis
Obviously, the biggest risk to 3M’s dividend king status is the ear plug liabilities.
For 3M’s Combat Arms earplugs litigation, we earmark a liability of just over $3 billion based on inflation-adjusted comparable cases and the number of cases pending.” – Morningstar
The good news there is that the final cost of 3M is likely to be a lot lower than the worst-case scenarios you might see in news articles.
Bloomberg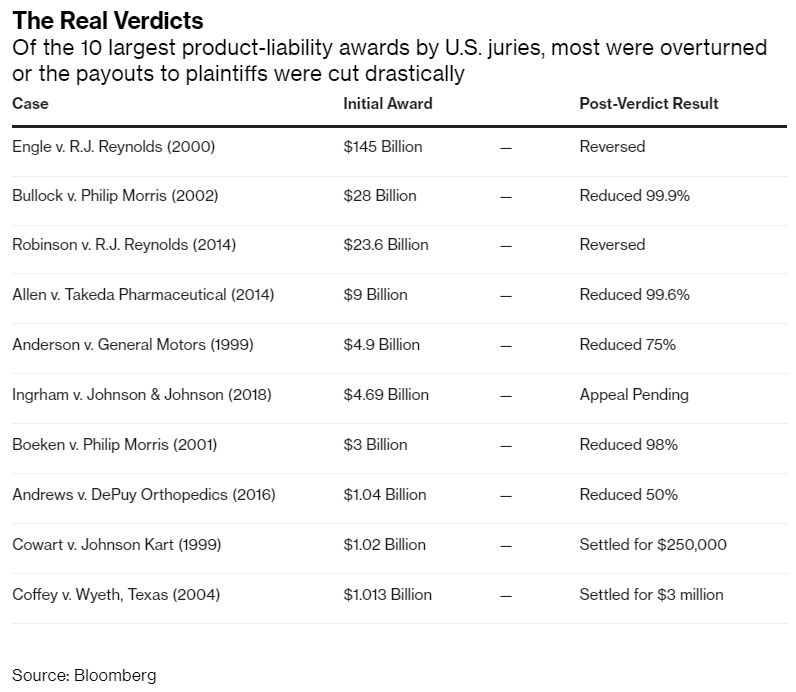
Almost all class-action lawsuits of headline-grabbing size are overturned on appeal or reduced by 50% or more.
I’m an Army vet myself, so I’m not anti-military in any way. But I think we can all agree that $55 million for hearing loss is a bit excessive. This was a jury award that awarded punitive damages to “stick it to big business.”
It’s very easy to be generous with other people’s money. How do I know that this is a ridiculous award that will almost certainly be overturned or reduced by nearly 100%?
If you extrapolate this latest award across all 300,000 pending cases, you get $13.5 TRILLION.
- almost 50% of US GDP
This is for earplugs that 3M made based on military specifications. In other words, they weren’t defective; they were designed based on what the military wanted. It turns out the military underestimated how much noise would cause permanent damage, and now 3M is being villainized as “evil.”
- thus such outlandish punitive jury awards
Will 3M spend many years battling in the courts? Most likely.
Is this going to act as an overhand for the stock? Almost certainly.
So does that mean that 3M might be a screaming bargain for many years, allowing patient high-yield investors to buy and reinvest dividends and build life-changing positions?
To answer that, let’s consider 3M’s long-term risk management and growth prospects.
3M’s Risk Management Is World-Class
What are the risks 3M faces?
3M is exposed to several risks, including slowing organic growth and supply chain-related disruptions, end-market weakness, a slowdown in industrial production, execution risk related to its acquisitions of MModal and Acelity in 2019, and market rejection of new product introductions.” – Morningstar
Some are short-term cyclical, like a slowing economy. Others are temporary, like supply chain disruptions. Intrinsic risks lie in its products losing market share to rivals like Honeywell (HON).
Fortunately, 3M’s R&D efficiency is the stuff of legend, ranked alongside Apple (AAPL) and Alphabet (GOOG) (GOOGL) in converting R&D spending into profits.
Our survey of prior environmental and product liability cases leads us to assume that a low- to mid-single-digit billion-dollar liability (present value) is far more likely.” – Morningstar
This leaves around $7 billion in likely legal liabilities as its biggest risk. Now that sounds pretty scary but remember two things:
- 3M has $7.8 billion in liquidity right now
- it’s generating a stable $6 billion per year in free cash flow
- legal verdicts like these are generally paid out over 15 to 30 years
In other words, unless 3M ends up with a much higher liability than most analysts, rating agencies, and bond investors expect, it’s not likely to go bankrupt or even cut its dividend due to these legal liabilities.
And let’s not forget that 3M has a history of incredibly successful long-term risk management. How do we know?
DK uses S&P Global’s global long-term risk-management ratings for our risk rating.
- S&P has spent over 20 years perfecting their risk model
- which is based on over 30 major risk categories, over 130 subcategories, and 1,000 individual metrics
- 50% of metrics are industry specific
- this risk rating has been included in every credit rating for decades
The DK risk rating is based on the global percentile of how a company’s risk management compares to 8,000 S&P-rated companies covering 90% of the world’s market cap.
MMM scores 89th Percentile On Global Long-Term Risk Management
S&P’s risk management scores factor in things like:
- supply chain management
- crisis management
- cyber-security
- privacy protection
- efficiency
- R&D efficiency
- innovation management
- labor relations
- talent retention
- worker training/skills improvement
- occupational health & safety
- customer relationship management
- business ethics
- climate strategy adaptation
- sustainable agricultural practices
- corporate governance
- brand management
MMM’s Long-Term Risk Management Is The 91st Best In The Master List 82nd Percentile In The Master List)
| Classification | S&P LT Risk-Management Global Percentile |
Risk-Management Interpretation |
Risk-Management Rating |
| BTI, ILMN, SIEGY, SPGI, WM, CI, CSCO, WMB, SAP, CL | 100 | Exceptional (Top 80 companies in the world) | Very Low Risk |
| 3M | 89 |
Very Good, Bordering on Exceptional |
Very Low Risk |
| Strong ESG Stocks | 86 |
Very Good |
Very Low Risk |
| Foreign Dividend Stocks | 77 |
Good, Bordering On Very Good |
Low Risk |
| Ultra SWANs | 74 | Good | Low Risk |
| Dividend Aristocrats | 67 | Above-Average (Bordering On Good) | Low Risk |
| Low Volatility Stocks | 65 | Above-Average | Low Risk |
| Master List average | 61 | Above-Average | Low Risk |
| Dividend Kings | 60 | Above-Average | Low Risk |
| Hyper-Growth stocks | 59 | Average, Bordering On Above-Average | Medium Risk |
| Dividend Champions | 55 | Average | Medium Risk |
| Monthly Dividend Stocks | 41 | Average | Medium Risk |
(Source: DK Research Terminal)
MMM’s risk-management consensus is in the top 18% of the world’s best blue-chips, and is similar to:
- Royal Bank of Canada (RY): Ultra SWAN
- Bank of Nova Scotia (BNS): Ultra SWAN
- Medtronic (MDT): Ultra SWAN dividend aristocrat
- Caterpillar (CAT): Ultra SWAN dividend aristocrat
- Alphabet (GOOG): Ultra SWAN
The bottom line is that all companies have risks, and MMM is very good, bordering on exceptional, at managing theirs, according to S&P.
How We Monitor MMM’s Risk Profile
- 22 analysts
- three credit rating agencies
- 25 experts who collectively know this business better than anyone other than management
- the bond market for real-time fundamental risk-assessment
So 3M’s thesis isn’t broken, but that doesn’t mean it’s necessarily a great buy today.
What’s The Matter With 3M
FactSet Research
6 months ago, 3M’s growth outlook was 8%, which is its historical growth rate for the past 20 years.
Combine a 5% yield and 8% growth, and you get a very attractive 13% long-term return potential.
Now?
Consensus Total Return Potential Ignoring Valuation
| Investment Strategy | Yield | LT Consensus Growth | LT Consensus Total Return Potential | Long-Term Risk-Adjusted Expected Return | Long-Term Inflation And Risk-Adjusted Expected Returns | Years To Double Your Inflation & Risk-Adjusted Wealth |
10-Year Inflation And Risk-Adjusted Expected Return |
| Nasdaq | 0.8% | 11.8% | 12.6% | 8.8% | 6.5% | 11.0 | 1.88 |
| Safe Midstream | 5.9% | 6.4% | 12.3% | 8.6% | 6.3% | 11.5 | 1.84 |
| Schwab US Dividend Equity ETF | 3.5% | 8.5% | 12.0% | 8.4% | 6.0% | 11.9 | 1.80 |
| Dividend Aristocrats | 2.6% | 8.5% | 11.1% | 7.8% | 5.4% | 13.2 | 1.70 |
| S&P 500 | 1.7% | 8.5% | 10.2% | 7.1% | 4.8% | 15.0 | 1.60 |
| REITs | 3.9% | 6.1% | 10.0% | 7.0% | 4.7% | 15.4 | 1.58 |
| 3M | 4.7% | 4.8% | 9.5% | 6.7% | 4.3% | 16.7 | 1.53 |
(Source: DK Research Terminal, FactSet, Ycharts, Morningstar)
3M’s total return potential has fallen so low that it’s expected to underperform most popular investing strategies.
Could 3M’s growth rate recover as Morningstar thinks it will? Of course, but if it doesn’t then 3M investors are left with a decent, if not exactly, life-changing investment opportunity.
Does that mean that 3M might not make an attractive medium-term buy purely due to valuation?
3M 2024 Consensus Total Return Potential
FAST Graphs, FactSet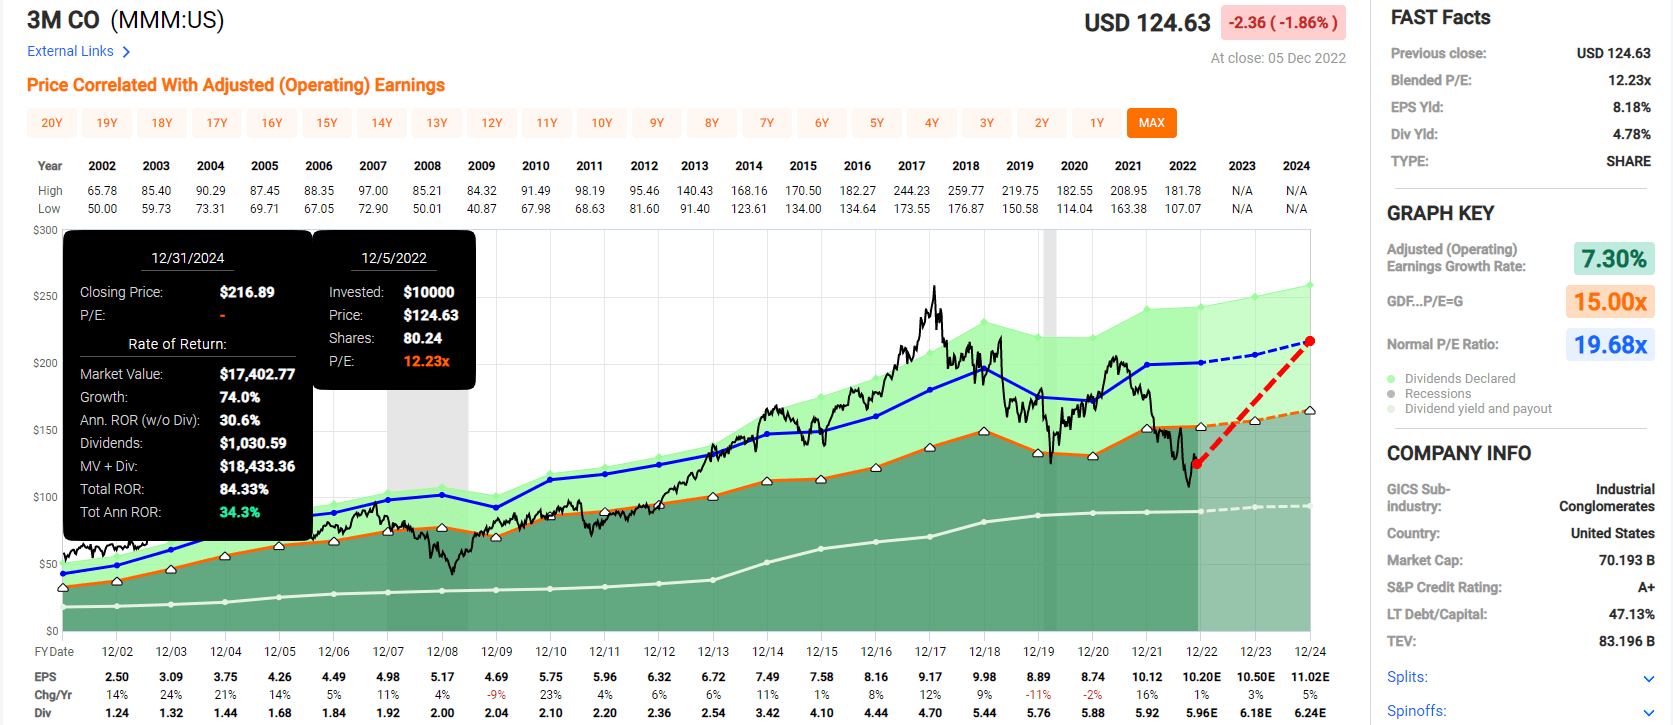
If 3M were to return to fair value and grow as expected through 2024, it could almost double, delivering Buffett-like 34% annual returns.
3M 2028 Consensus Total Return Potential
FAST Graphs, FactSet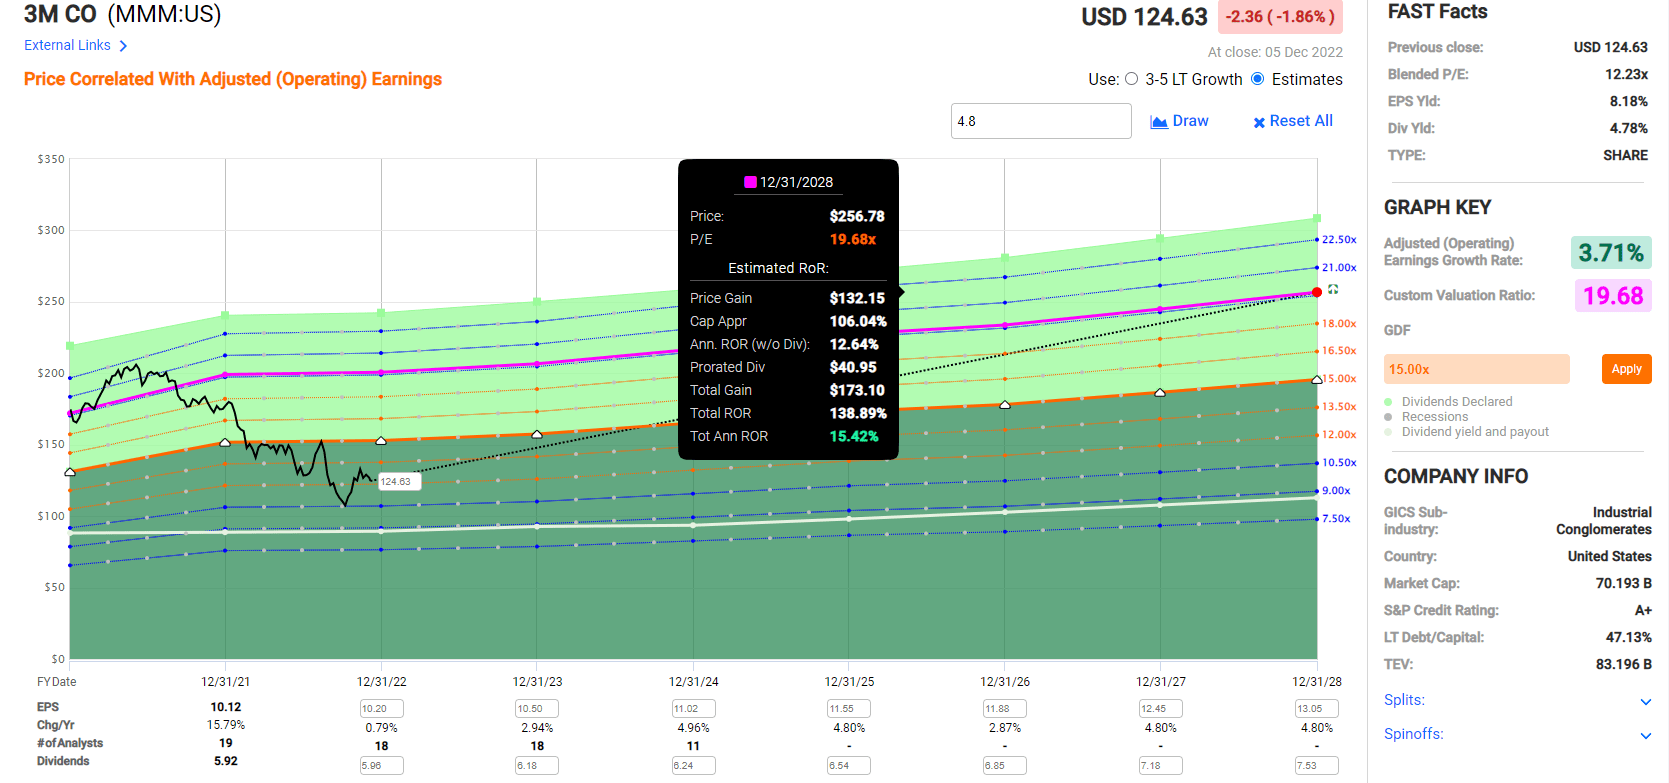
Over the next five years, 3M could deliver 139% total returns, or 15% annually.
- 14% to 17% CAGR five year consensus return potential range
That’s a very solid investment opportunity, assuming it grows as expected, which is no guarantee.
3M Investment Decision Score
DK Dividend Kings Automated Investment Decision Tool
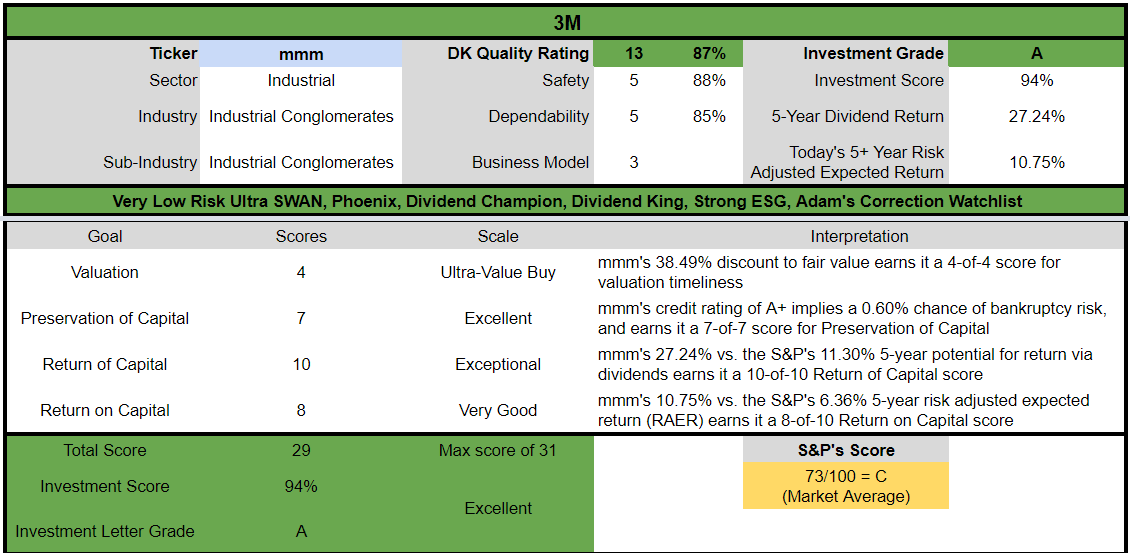
MMM is a potentially excellent high-yield Ultra SWAN opportunity for anyone comfortable with its risk profile. Look at how it compares to the S&P 500.
- 38% discount to fair value vs. 3% premium S&P = 41% better valuation
- 4.7% very safe yield vs. 1.7% (3X higher and much safer)
- approximately 9.5% long-term annual return potential vs. 10.2% CAGR S&P
- about 50% higher risk-adjusted expected returns
- 2.5X higher income potential over five years
But while 3M is a potentially attractive high-yield aristocrat opportunity, it’s not my top recommendation by any means. Not when there are superior-yielding and faster-growing aristocrats available.
Enbridge: A 6.6% Yielding Aristocrat Firing On All Cylinders
Further reading
- Enbridge Is A 7% Yielding Dividend Aristocrat Retirement Dream Stock
- full investment thesis, growth outlook, and risk profile
- 15% dividend tax withholding in taxable accounts
- own in a retirement account to avoid the withholding
- tax credit is available to recover the withholding in taxable accounts
Enbridge is my favorite midstream for two main reasons.
- the only dividend aristocrat in midstream (28-year dividend growth streak)
- the most advanced in its energy transition plans
ENB is firing on all cylinders, as we saw in its recent earnings report.
Reaffirmed 2022 full-year guidance for adjusted earnings before interest, income taxes, and depreciation (EBITDA)* in the top half of the $15.0 billion to $15.6 billion range and distributable cash flow (DCF) per share* at just above the midpoint of the $5.20 to $5.50 range…
Declared 28th consecutive annual common share dividend increase, raising it by 3.2% to $0.8875 per quarter ($3.55 annualized), effective March 1, 2023…
Announced intent to renew the Company’s normal course issuer bid program for 2023, allowing for the repurchase of up to $1.5 billion of its outstanding common shares.” – Seeking Alpha
ENB is executing well on its growth backlog and just announced the completion of its first European offshore wind farm and a potential partnership with Occidental Petroleum (OXY).
Enbridge (ENB) would build and operate the pipeline facilities and Oxy Low Carbon Ventures would build and operate the sequestration facilities, which would provide CO2 solutions for Enbridge’s proposed facilities as well as other point source emitters in the area.
Occidental Petroleum (OXY) has committed to develop several carbon capture projects, with plans to build as many as 135 direct air carbon capture facilities by 2035.” – Seeking Alpha
Carbon Sequestration means piping CO2 to an oil well and then injecting it into the shale, trapping it. As a side benefit, the increased pressure boosts oil production.
- OXY has been the industry leader in enhanced oil recovery for decades
If OXY completes its plans on time, then each capture facility will inject 500,000 tons of CO2, and ENB will provide the transportation capacity for this.
- 82.5 million tons of CO2 sequestration per year
How much are 82.5 million tons of CO2? In 2022 NOAA estimates the world will emit 36.6 billion tons.
- 0.23% of all CO2 emissions is what OXY is planning on returning into the ground
While this is not a needle-moving deal in terms of solving climate change, remember that this is just OXY’s first volley in a long-term plan to transition to green energy.
In other words, while 82.5 million tons is a drop in the bucket, that means that ENB and OXY can keep ramping up sequestration for years and decades to come.
- a potentially massive growth opportunity for ENB
And eventually, other big oil companies will likely follow suit, such as Exxon (XOM) and Chevron (CVX). At some point, when carbon is taxed, it will become even more profitable to pursue carbon capture and sequestration, and ENB is an industry leader that benefits from this long-term trend.
And in the meantime, ENB’s growth prospects look bright.
Since the beginning of this year, we have secured an additional $8 billion of “middle of the fairway” organic growth, bringing our secured backlog to $17 billion, executed highly strategic tuck-in M&A opportunities, and released $1.6 billion in the capital at attractive valuations.” – Seeking Alpha
ENB’s growth backlog is $12.4 billion, and it continues to find attractive investment opportunities, focusing on the most utility-like cash flows.
- 98% of ENB’s cash flow has no exposure to commodity prices
Enbridge expects to deploy approximately $6 billion of capital in 2023, inclusive of maintenance capital. The balance sheet will remain strong with the Debt-to-EBITDA ratio* at the end of 2023 expected to be in the lower half of the Company’s 4.5-5.0x target range. The financing plan includes issuances of approximately $6 billion in incremental debt in 2023, net of maturities, with no external equity required. The Company has hedged over half of its anticipated fixed-rate term-debt issuances for 2023.” – Seeking Alpha
ENB is pursuing a self-funding business model with no reliance on equity financing, just like all the best midstreams have been doing for years.
Leverage in the lower half of its target range makes rating agencies and bond investors very happy.
- 5X or less debt/EBITDA is what rating agencies consider safe in midstream
Reasons To Potentially Buy Enbridge Today
| Metric | Enbridge |
| Quality | 85% 13/13 Ultra SWAN (Sleep Well at Night) Dividend Aristocrat |
| Risk Rating | Very Low Risk |
| DK Master List Quality Ranking (Out Of 500 Companies) | 209 |
| DK Master List Quality Percentile | 59% |
| Dividend Growth Streak (Years) | 28 |
| Dividend Yield | 6.7% |
| Dividend Safety Score | 86% |
| Average Recession Dividend Cut Risk | 0.5% |
| Severe Recession Dividend Cut Risk | 1.70% |
| S&P Credit Rating |
BBB+ Stable Outlook |
| 30-Year Bankruptcy Risk | 5.00% |
| LT S&P Risk-Management Global Percentile |
96% Exceptional, Very Low Risk |
| Fair Value | $49.25 |
| Current Price | $39.37 |
| Discount To Fair Value | 20% |
| DK Rating |
Potential Strong Buy |
| P/Cash Flow | 9.4 |
| Growth Priced In | 1.8% |
| Historical P/Cash Flow | 9 to 12 |
| LT Growth Consensus/Management Guidance | 4.9% |
| 5-year consensus total return potential |
7% to 18% CAGR |
| Base Case 5-year consensus return potential |
12% CAGR (2X S&P 500) |
| Consensus 12-month total return forecast | 16% |
| Fundamentally Justified 12-Month Return Potential | 28% |
| LT Consensus Total Return Potential | 11.6% |
| Inflation-Adjusted Consensus LT Return Potential | 9.3% |
| Consensus 10-Year Inflation-Adjusted Total Return Potential (Ignoring Valuation) | 2.43 |
| LT Risk-Adjusted Expected Return | 7.71% |
| LT Risk-And Inflation-Adjusted Return Potential | 5.38% |
| Conservative Years To Double | 13.37 |
(Source: Dividend Kings Zen Research Terminal)
ENB’s long-term return potential (and guidance) is superior to MMM’s, and its five-year consensus return potential is basically identical.
- 2.1% per year higher returns over 30 years is potentially 87% more inflation-adjusted wealth
Enbridge 2024 Consensus Total Return Potential
(Source: FAST Graphs, FactSet)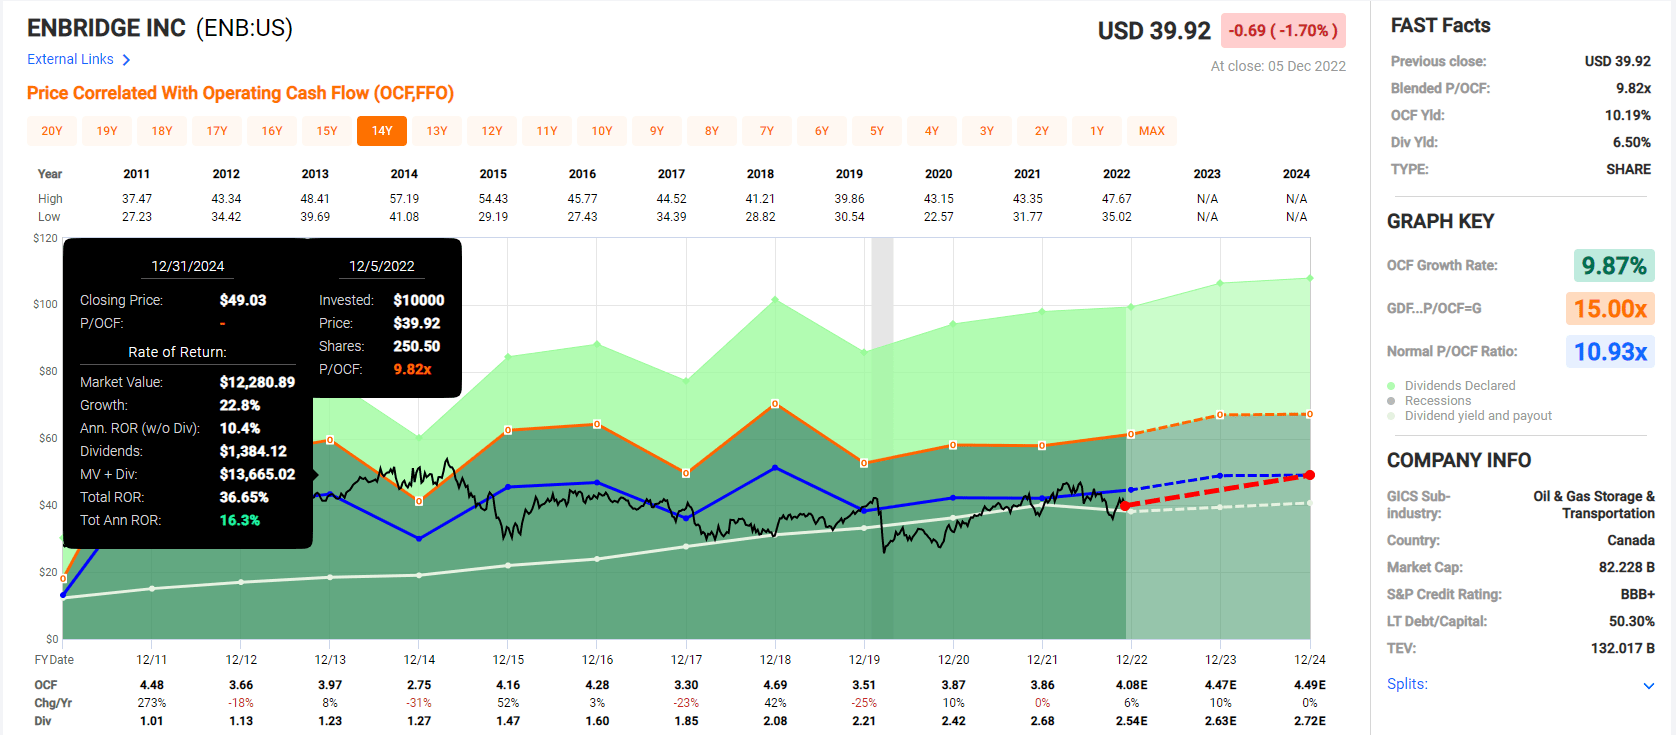
ENB offers a very attractive 16% annual return potential over the next two years, 2X that of the S&P 500.
Enbridge 2028 Consensus Total Return Potential
(Source: FAST Graphs, FactSet)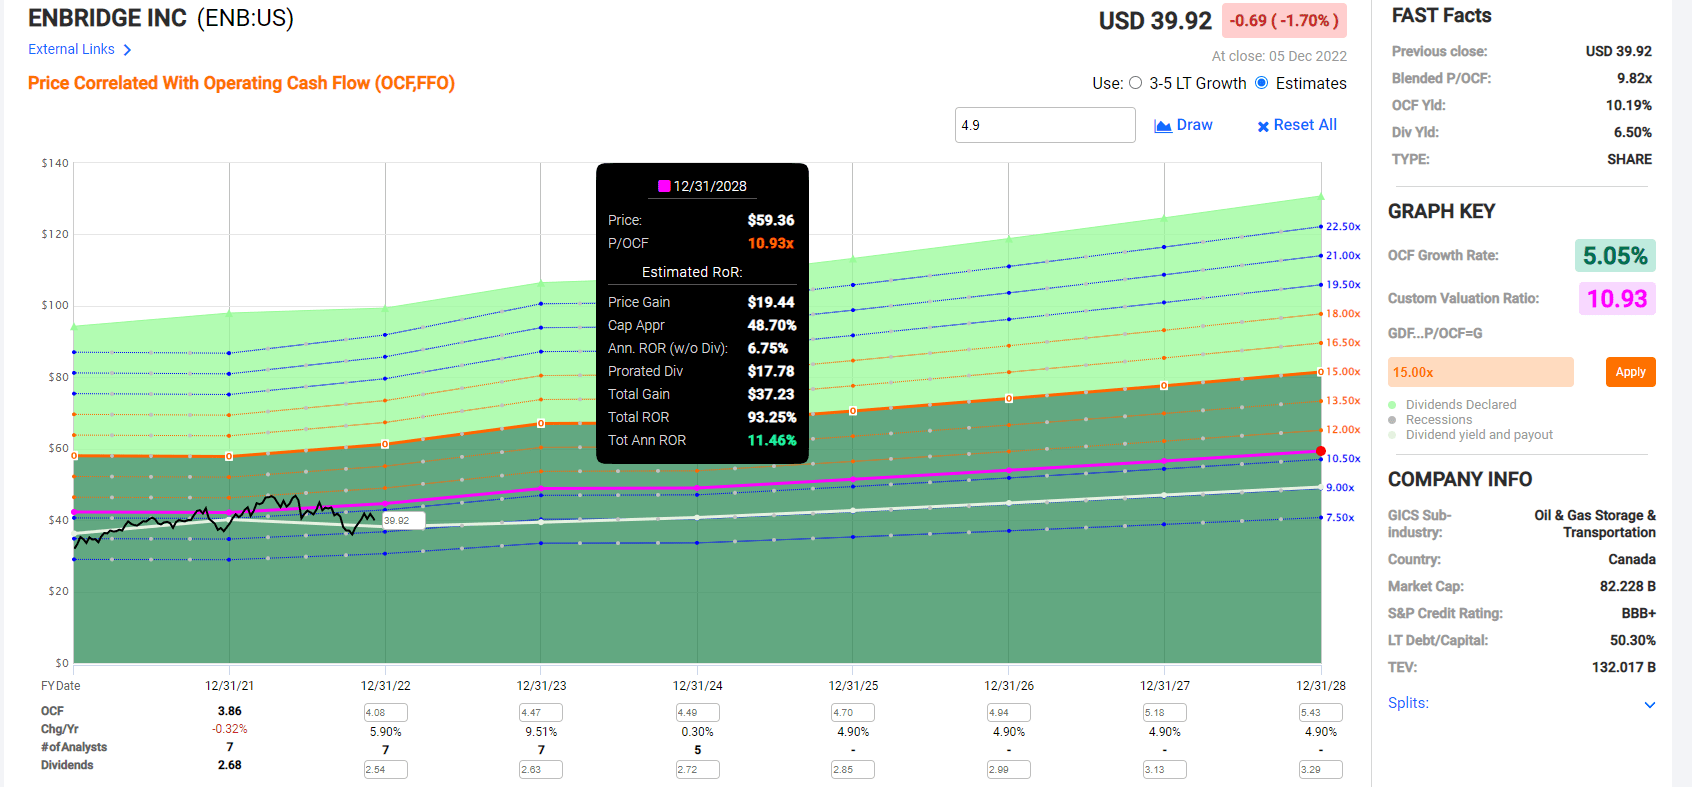
ENB’s 11.5% annual return potential might not sound exciting, but it’s a potential double by 2028, 2X more than the S&P consensus.
And more importantly, ENB has a $120 trillion global green energy opportunity to tap into to keep growing steadily for decades to come.
- the bond market thinks ENB is going to keep growing through 2112, at least
- ENB will potentially outlive us all
ENB Investment Decision Score
Dividend Kings Automated Investment Decision Tool 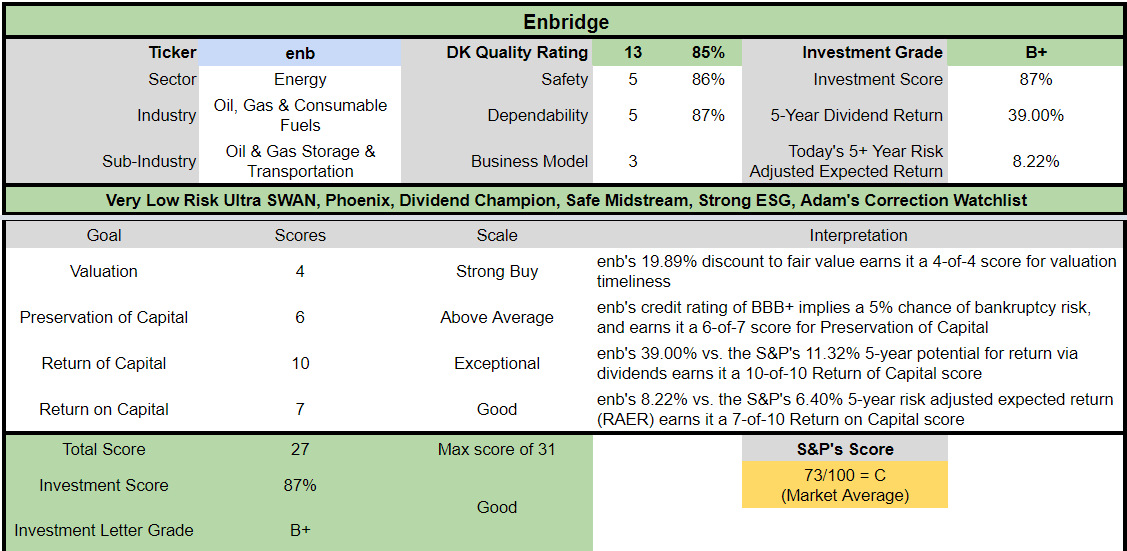
ENB is a potentially good ultra-yield Ultra SWAN aristocrat opportunity for anyone comfortable with its risk profile. Look at how it compares to the S&P 500.
- 20% discount to fair value vs. 3% premium S&P = 23% better valuation
- 6.7% very safe yield vs. 1.7% (4X higher and much safer)
- approximately 11.6% long-term annual return potential vs. 10.2% CAGR S&P
- about 33% higher risk-adjusted expected returns
- 3.5X higher income potential over five years
Altria: An 8% Yielding Dividend King Growing Just As Fast As 3M
Further Reading:
- Buy Altria Before August 26th, When Everyone Else Likely Will
- deep dive look at MO’s investment thesis, growth outlook, and risk profile
Altria pretty much met expectations, as it has done consistently for a decade, outside of the Pandemic supply chain disruptions.
Seeking Alpha FAST Graphs, FactSet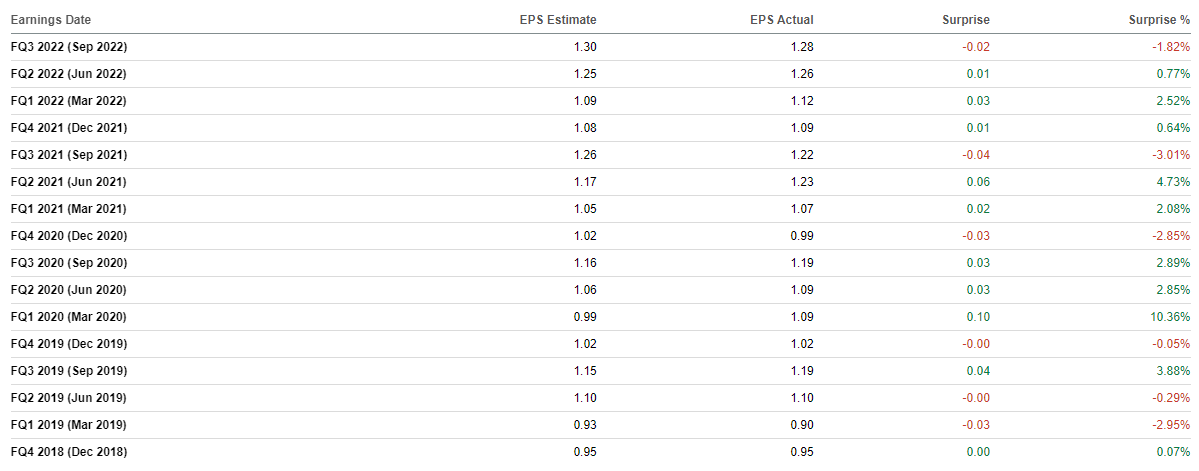
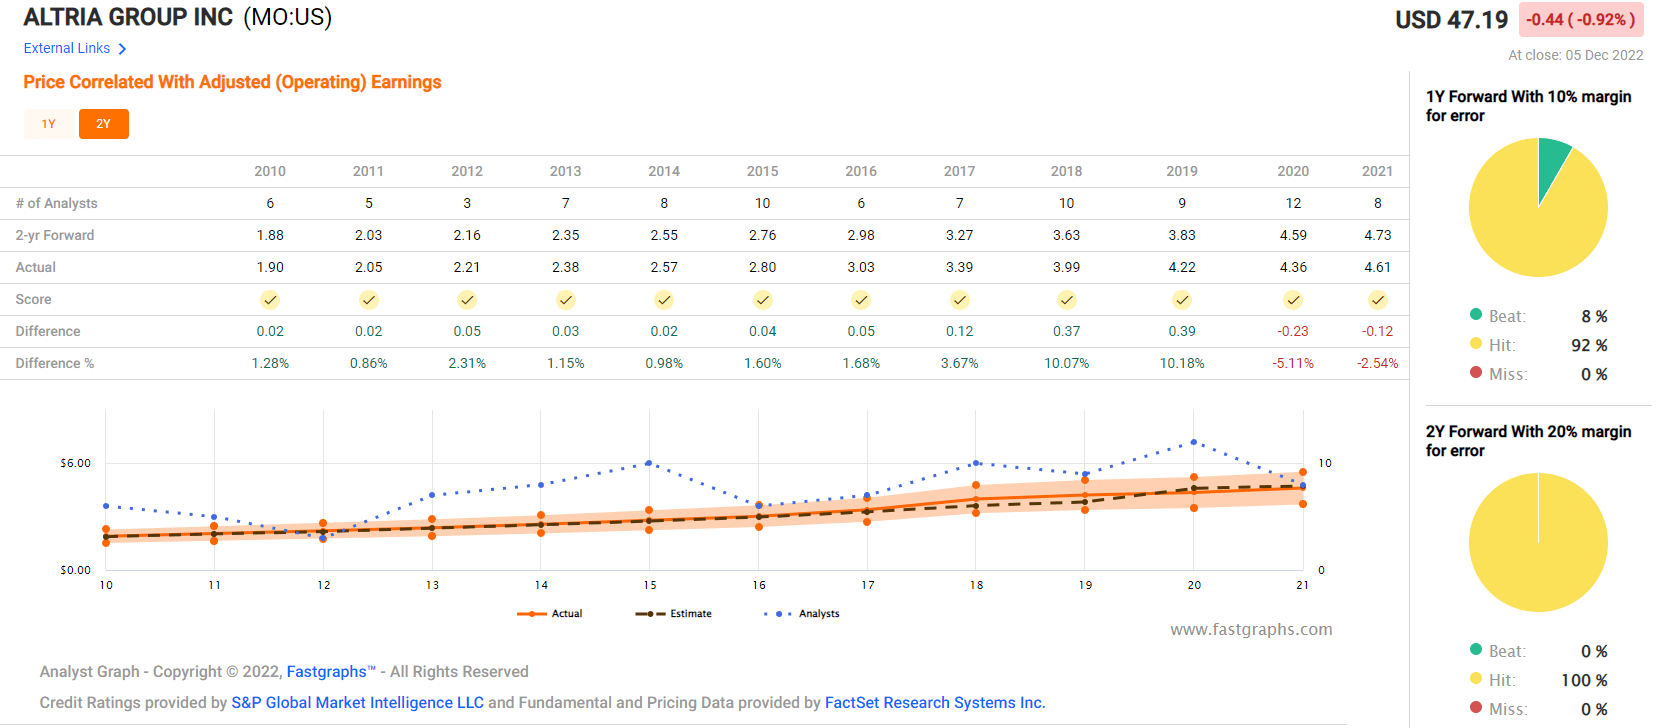
This is a very predictable business, which is what one would expect from a defensive dividend king with a 53-year dividend growth streak.
But that’s not to say there weren’t some worrisome things in MO’s report.
Altria reported weak cigarette volume and revenue in the third quarter of 2022. However, the positive mix meant that operating income of $3.1 billion and earnings per share of $1.28 were in line with our estimates…
Volume was weak, with cigarette volume down 9%, and down 10% when including trade inventory movements, and Altria lost almost 1 percentage point of retail share over the third quarter last year. The industry suffered an above-average volume decline rate (down 8%), and some trading down, as the impact of higher gas prices and broader inflationary pressures took their toll on smokers.” – Morningstar
MO’s volumes have been falling slightly faster than expected in recent quarters, though it’s been able to generate flat sales growth by raising prices.
- Morningstar estimates it has about 30 more years in which it can do this before consumers revolt
Once again, Altria’s pricing power came to the fore, and cigarette net revenue was flat. The oral tobacco business continued its progress in the third quarter, with a 1% volume and almost 8% net revenue growth. On! again performed well, gaining 2 percentage points of retail share, and this masked volume weakness among the moist chewing tobacco brands.” – Morningstar
On!, its oral nicotine pouch brand, is currently the only reduced-risk product it sells after PM bought out its rights to iQos in the US.
MO is partnering with Japan Tobacco to commercialize heated tobacco and vaping in the US and remains the industry laggard behind PM and BTI.
Despite the volume pressure, operating income grew by 5.5%, and the EBIT margin was 57.5%, up by 415 basis points. We believe this improvement is largely due to the mix effect of the disposal of the wine business, which is maintainable to a degree, but we anticipate operating deleverage to gradually erode margins in the long term.” – Morningstar
MO’s strong cost discipline improved margins significantly, though Morningstar worried margins would eventually erode.
Analysts don’t share that concern. Here are MO’s consensus net margins.
- 2022: 41.3%
- 2023: 42.3%
- 2024: 43.3%
- 2025: 43.5%
And here are the consensus free cash flow margins:
- 2022: 34.5%
- 2023: 40.0%
- 2024: 40.3%
- 2025: 40.6%
MO remains one of the most profitable companies on earth, with free cash flow and net margins in the top 5% of global companies.
How worried about analysts about its ability to pivot to a smoke-free future?
FactSet Research Terminal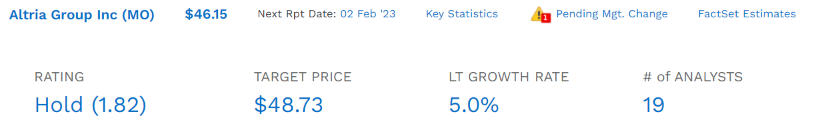
MO almost always grows as expected and has been for 20 years. How does MO’s growth outlook compare to its major peers?
- BTI: 10.4%
- MO: 5.0%
- PM: 3.1%
With growth matching 3M but a yield almost 2X as high, MO offers an exceptional long-term investment opportunity for anyone comfortable owning a tobacco company.
Reasons To Potentially Buy Altria Today
| Metric | Altria |
| Quality | 85% 13/13 Ultra SWAN (Sleep Well at Night) Dividend King |
| Risk Rating | Medium Risk |
| DK Master List Quality Ranking (Out Of 500 Companies) | 216 |
| DK Master List Quality Percentile | 57% |
| Dividend Growth Streak (Years) | 53 |
| Dividend Yield | 8.1% |
| Dividend Safety Score | 86% |
| Average Recession Dividend Cut Risk | 0.5% |
| Severe Recession Dividend Cut Risk | 1.70% |
| S&P Credit Rating |
BBB Stable Outlook |
| 30-Year Bankruptcy Risk | 7.50% |
| LT S&P Risk-Management Global Percentile |
44% Average, Medium Risk |
| Fair Value | $70.10 |
| Current Price | $46.20 |
| Discount To Fair Value | 34% |
| DK Rating |
Potential Very Strong Buy |
| PE | 9.5 |
| Cash-Adjusted PE | 8.6 |
| Growth Priced In | 0.2% |
| Historical PE | 14 to 17 |
| LT Growth Consensus/Management Guidance | 5.0% |
| 5-year consensus total return potential |
16% to 20% CAGR |
| Base Case 5-year consensus return potential |
19% CAGR (5X S&P 500) |
| Consensus 12-month total return forecast | 14% |
| Fundamentally Justified 12-Month Return Potential | 60% |
| LT Consensus Total Return Potential | 13.1% |
| Inflation-Adjusted Consensus LT Return Potential | 10.8% |
| Consensus 10-Year Inflation-Adjusted Total Return Potential (Ignoring Valuation) | 2.78 |
| LT Risk-Adjusted Expected Return | 8.48% |
| LT Risk-And Inflation-Adjusted Return Potential | 6.15% |
| Conservative Years To Double | 11.70 |
(Source: Dividend Kings Zen Research Terminal)
MO is priced for 0.2% growth and is actually growing at 5%. It offers 3.6% better long-term return potential than MMM.
- 3X the inflation-adjusted wealth over 30 years compared to MMM
Altria 2024 Consensus Total Return Potential
FAST Graphs, FactSet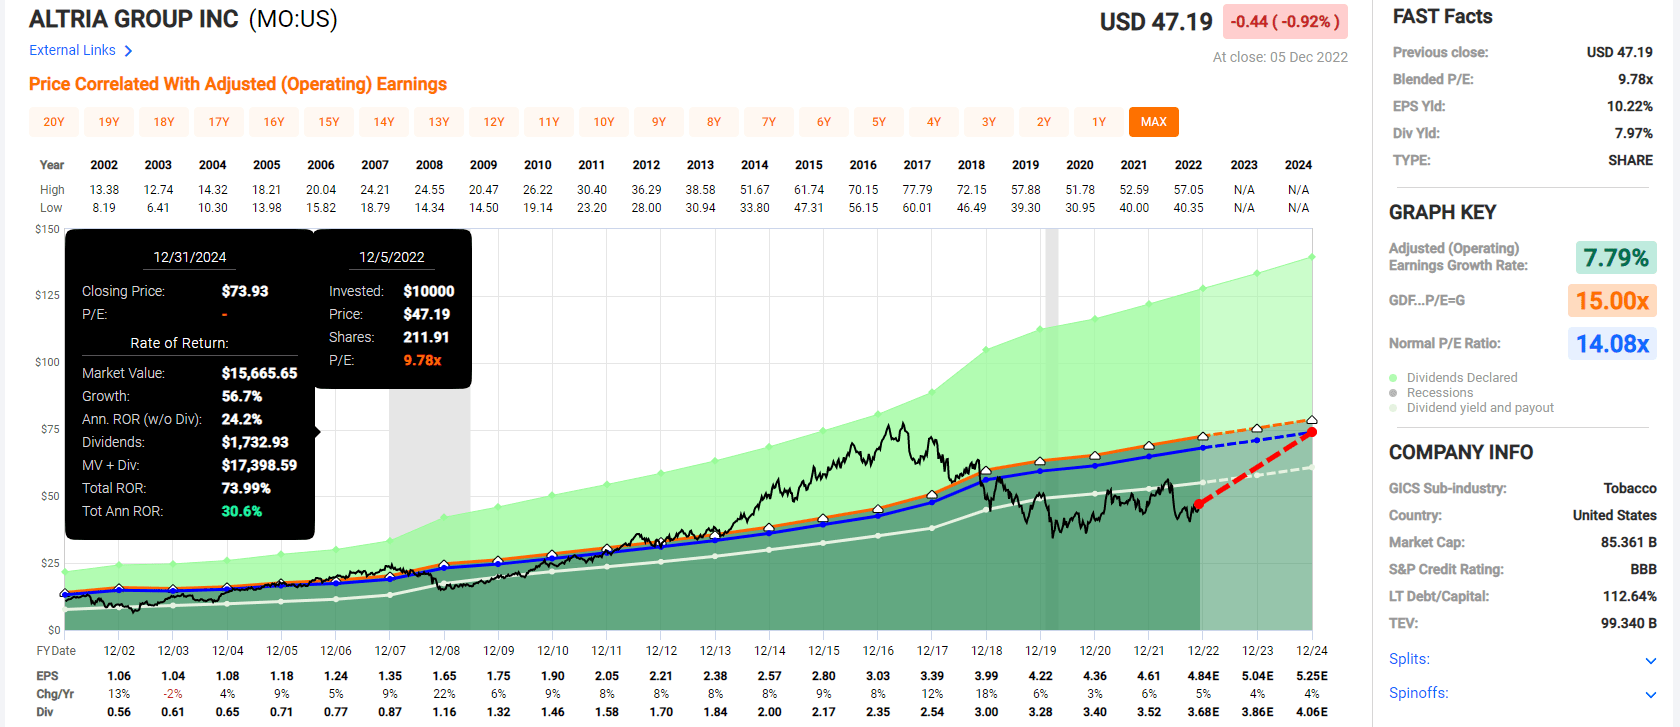
Altria 2028 Consensus Total Return Potential
FAST Graphs, FactSet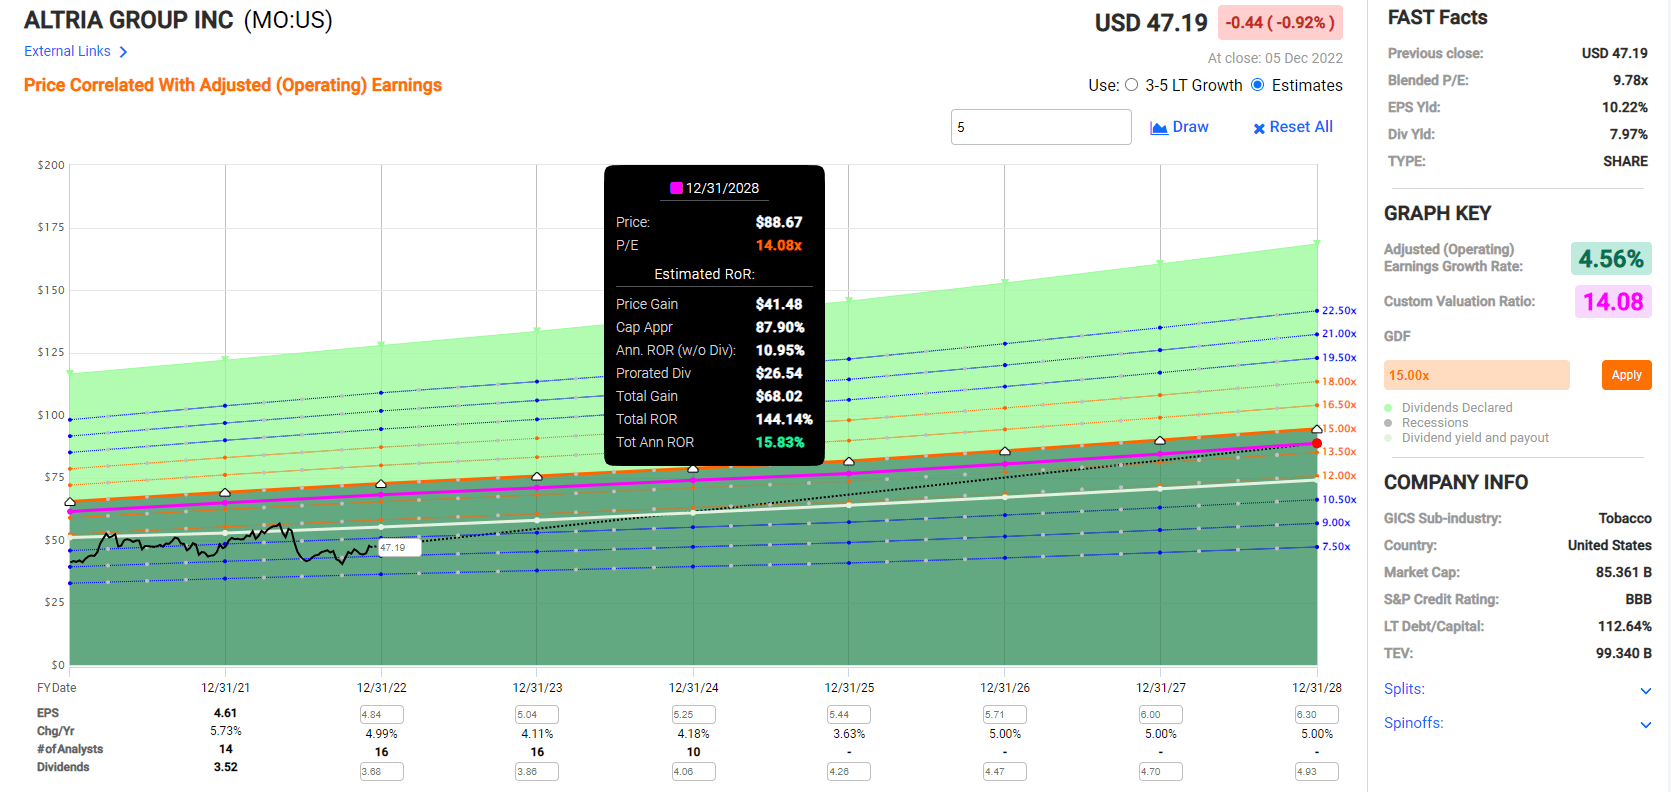
MO matches MMM for five-year return potential at about 15% to 16% per year but offers almost 2X the very safe yield and 3X the long-term wealth potential.
Altria Investment Decision Score
Dividend Kings Automated Investment Decision Tool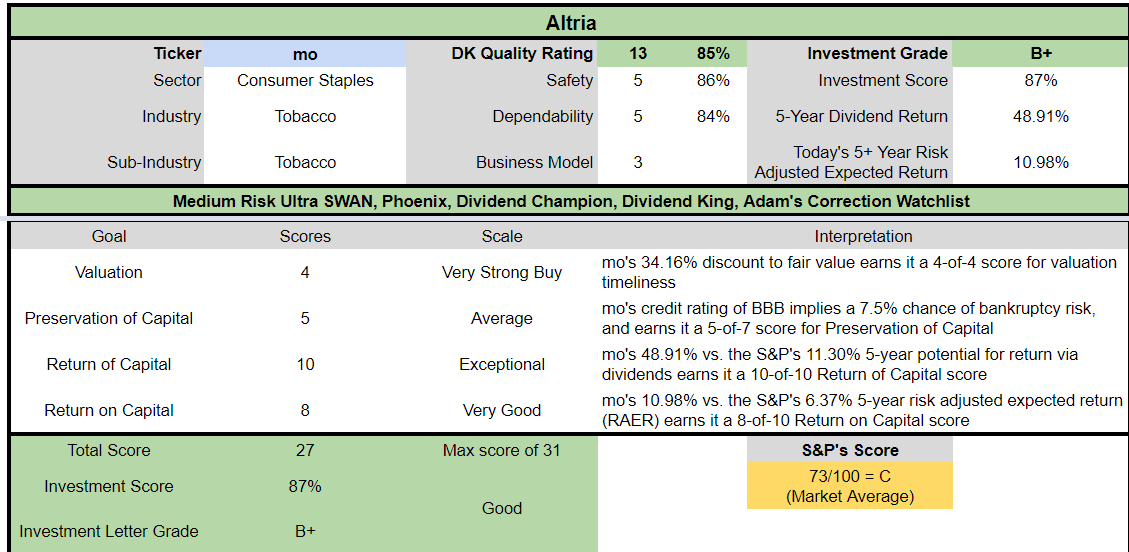
MO is a potentially good ultra-yield Ultra SWAN aristocrat opportunity for anyone comfortable with its risk profile. Look at how it compares to the S&P 500.
- 34% discount to fair value vs. 3% premium S&P = 37% better valuation
- 8.1% very safe yield vs. 1.7% (almost 5x higher and much safer)
- approximately 13.1% long-term annual return potential vs. 10.2% CAGR S&P
- about 66% higher risk-adjusted expected returns
- 4.5X higher income potential over five years
Bottom Line: 3M’s Thesis Has Weakened, So Consider High-Yield Aristocrat Alternatives
Don’t get me wrong, 3M is far from the next GE. Its dividend remains well covered by relatively stable free cash flow, its balance sheet is still A-rated, and legal liability fears are almost certainly significantly overblown.
That being said, with a growth outlook of just 4.8% and 9.5% long-term return potential, 3M is far from the best high-yield aristocrat you can buy.
Consensus Long-Term Return Potential (Ignoring Valuation)
| Investment Strategy | Yield | LT Consensus Growth | LT Consensus Total Return Potential | Long-Term Risk-Adjusted Expected Return | Long-Term Inflation And Risk-Adjusted Expected Returns | Years To Double Your Inflation & Risk-Adjusted Wealth |
10-Year Inflation And Risk-Adjusted Expected Return |
| Altria | 8.1% | 5.0% | 13.1% | 9.2% | 6.8% | 10.5 | 1.94 |
| Nasdaq | 0.8% | 11.8% | 12.6% | 8.8% | 6.5% | 11.0 | 1.88 |
| Safe Midstream | 5.9% | 6.4% | 12.3% | 8.6% | 6.3% | 11.5 | 1.84 |
| Schwab US Dividend Equity ETF | 3.5% | 8.5% | 12.0% | 8.4% | 6.0% | 11.9 | 1.80 |
| Enbridge | 6.7% | 4.9% | 11.6% | 8.1% | 5.8% | 12.4 | 1.76 |
| Dividend Aristocrats | 2.6% | 8.5% | 11.1% | 7.8% | 5.4% | 13.2 | 1.70 |
| S&P 500 | 1.7% | 8.5% | 10.2% | 7.1% | 4.8% | 15.0 | 1.60 |
| REITs | 3.9% | 6.1% | 10.0% | 7.0% | 4.7% | 15.4 | 1.58 |
| 3M | 4.7% | 4.8% | 9.5% | 6.7% | 4.3% | 16.7 | 1.53 |
(Sources: DK Research Terminal, FactSet, Morningstar, Ycharts)
With the 2023 recession likely to begin within four to five months, and legal uncertainties likely to drag on for years, 3M might not return to fair value until 2025.
Meanwhile, Altria and Enbridge represent higher-yielding, and faster-growing aristocrats, offering superior total return opportunities.
- ENB offers almost 2X the inflation-adjusted returns of MMM over 30 years
- MO offers 3X the inflation-adjusted returns of MMM over 30 years
Altria’s valuation is nearly as attractive as 3M’s; it’s less uncertain, and its 31% annual return potential through 2024 is almost as good.
Enbridge’s valuation might not be as attractive as MO or MMM’s, but it’s firing on all cylinders and has 96th-percentile risk management, according to S&P.
I have little double that anyone buying 3M today, or who bought it in 2022 and who holds for several years, will make money. The question is whether you’ll make a return as nice as what ENB and MO offer today.
Not even Buffett has unlimited funds to invest, and if you’re looking to buy a high-yield aristocrat today, I consider MO and ENB much more attractive long-term opportunities.
Disclosure: I/we have a beneficial long position in the shares of MMM, ENB, MO either through stock ownership, options, or other derivatives. I wrote this article myself, and it expresses my own opinions. I am not receiving compensation for it (other than from Seeking Alpha). I have no business relationship with any company whose stock is mentioned in this article.
Additional disclosure: Dividend Kings owns MMM, ENB, and MO in our portfolios.
—————————————————————————————-

Dividend Kings helps you determine the best safe dividend stocks to buy via our Automated Investment Decision Tool, Zen Research Terminal, Correction Planning Tool, and Daily Blue-Chip Deal Videos.
Membership also includes
-
Access to our 10 model portfolios (all of which are beating the market in this correction)
-
my correction watchlist
-
50% discount to iREIT (our REIT-focused sister service)
-
real-time chatroom support
-
real-time email notifications of all my retirement portfolio buys
-
numerous valuable investing tools
Click here for a two-week free trial, so we can help you achieve better long-term total returns and your financial dreams.