Summary:
- Consumer spending fears continue to send this major equity lower.
- Inflationary issues have seen a key level of $101 bypassed.
- Alarmingly, Amazon has now also bypassed the next key technical level which was the Fibonacci 261 and has been spiraling lower in recent weeks.
shaunl
It has not been a good year for the equity markets to say the least. Inflationary issues aside for the moment, the reality is that equities needed a cooling off after a decade of grinding higher and higher. At the center of the major equities stands Amazon (NASDAQ:AMZN).
Down nearly 50 percent this year as an awful 2022 for bullish investors as the curtain comes down and we move to 2023.
Holiday sales were better than feared for Amazon but investors don’t seem to be convinced the pain is over.
It is very much like a see-saw between the Fed and CPI data with no apparent exact surety in sight. Amazon lies at the heart of extra consumer spending and if inflation doesn’t solidly cool, this equity will continue to be pressured. And here in lies the problem, inflation hasn’t solidly cooled and it is showing through the continued dip in this equity and technically there is a further additional drop in sight.
High Inflation means less consumer spending on products other than necessities which translates to weakening forward profits for companies like Amazon.
Still by far the e-commerce king should inflation ease and sentiment shift and Amazon moves to the next outlined technical level and shows signs of a turnaround, one would think this stock would be a good buy.
Let’s now move to the technical charts to see where Amazon may be headed next.
The reality is, gauging what the macro technical charts are showing is somewhat of a myth as after Amazon’s stock spilt earlier this year, the monthly chart is only showing bearish candles and has no possible way of gauging a future price reading.
For this reason we are forced to move backwards by a time frame to the weekly which immediately reveals an alarming figure. That figure is circa $50 next stop.
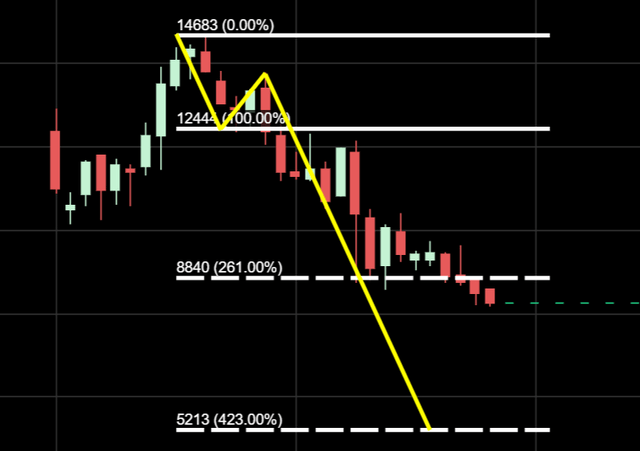
Amazon has not only bypassed its numerical copy of its wave one, it has also bypassed its Fibonacci 261 with the next technical price reading being the Fibonacci 423. A Fibonacci 423 reading from a wave one is quite unusual which could suggest there is serious investor concern having not turned around at the preceding technical levels.
If you would like to find out how you can gauge in depth future pricing interpretation the link to my book (The Ward Three Wave Theory) is available in my Seeking Alpha bio.
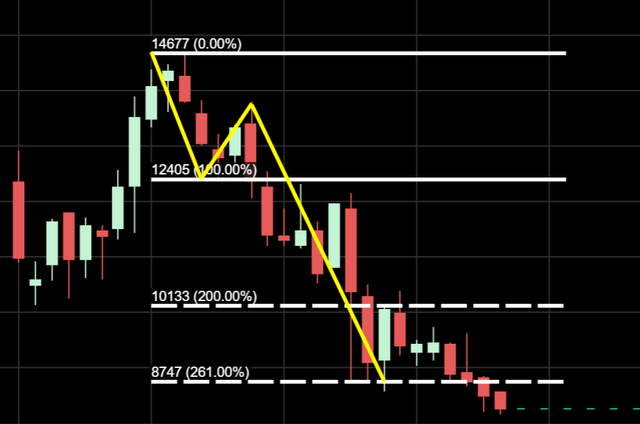
Now we can move to the post stock split weekly chart below and see the wave one $146-$124 with the wave two circa $135. A bearish wave two is always identifiable by a bullish candle following bearish candles, this bullish candle paves the way for the drop lower and in this case, the drop lower came below the support region of $124.
$101 was a previous support region from my Seeking Alpha articles earlier this year and the share price did initially get a bounce from that region actual forming the skeleton of a bullish wave one two pattern. As we can see, this bullish action could not hold up with $87 which was the Fibonacci 261 a next technical stop.
Once again there was an attempt at bullish action from this region but that wasn’t to be either and in recent weeks that technical barrier was crossed too.
So this leaves us with the question, where is Amazon headed next. An additional quite significant drop actually with $52 the exact number.
We can see in the chart below that the Fibonacci 423 is the next technical price region arising from the weekly bearish wave pattern where should Amazon arrive there, I will be keenly looking for bullish wave patterns to form.
Amazon Fibonacci 423 weekly chart price reading (OvalX)
To finalize, I would expect Amazon to get to $52 within the next 30 to 120 days. It could be a case that bullish sentiment is severely diminished once markets reopen in the new year and this equity takes a nose dive to that level. The second case would be for a slower dip lower and a possible uptake as Spring approaches. As always it is also plausible that Amazon wants to come slightly outside the Fibonacci 261 before moving higher from here.
Should there be a bullish turnaround on the macro associated time frames I will be publishing an updated article on Seeking Alpha.
Disclosure: I/we have no stock, option or similar derivative position in any of the companies mentioned, and no plans to initiate any such positions within the next 72 hours. I wrote this article myself, and it expresses my own opinions. I am not receiving compensation for it (other than from Seeking Alpha). I have no business relationship with any company whose stock is mentioned in this article.

