Summary:
- Loosening Covid 19 polices are affecting the Apple supply chain with factory workers increasingly on sick leave.
- A forecasted disruption to supply during the holiday season leaves Apple on the doorstep of a new low in its structure.
- We will look at what the next stop may be price wise and how it may get there.
onurdongel
Charts created by writer from OvalX
In this article we will examine news surrounding Apple’s (NASDAQ:AAPL) supply chain issues and how it is reflected in how the tech giant’s share price is performing. Before moving to Apple’s technical structure, we will dig into the news coming from both China and Apple itself before trying to gauge where this equity may be stopping next.
The Chinese city of Zhengzou also known as “iPhone city” is approaching its third month suffering from a Covid 19 outbreak and Apple’s supply chain is also suffering.
On November 6th, in a rare press release, Apple warned of “significant disruption” looking ahead to the holiday season and as China has chosen to relax its protracted and very strict attempt to stamp out Covid 19 rather than to manage it, a perfect storm appears to have erupted for the US tech giant as workers driving the supply chain fall sick to the virus.
A fifth of the iPhones produced are sold to the Chinese market but that is far out balanced in supply terms as over 90 percent of iPhones are assembled in the country.
The Chinese government’s apparent mismanagement of their Covid 19 policies is starting to have a direct impact on the world’s digital darling but is this just a temporary issue or a more worrying case?
In June I issued a sell signal for Apple with Seeking Alpha with $129 as a key support level that this equity is looking to bypass.
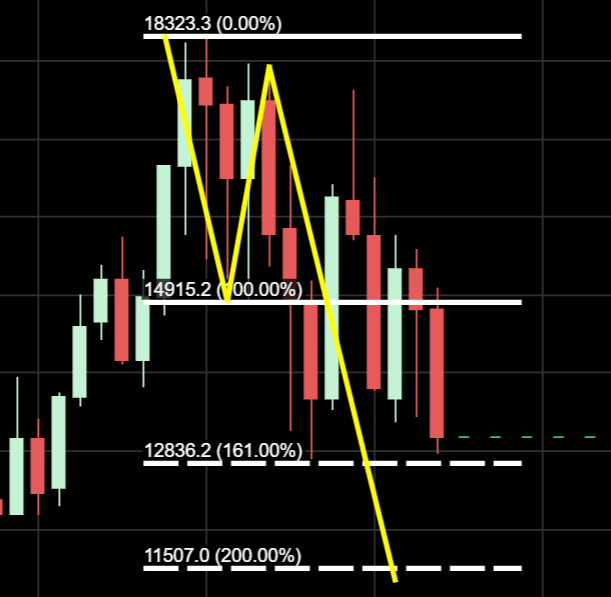
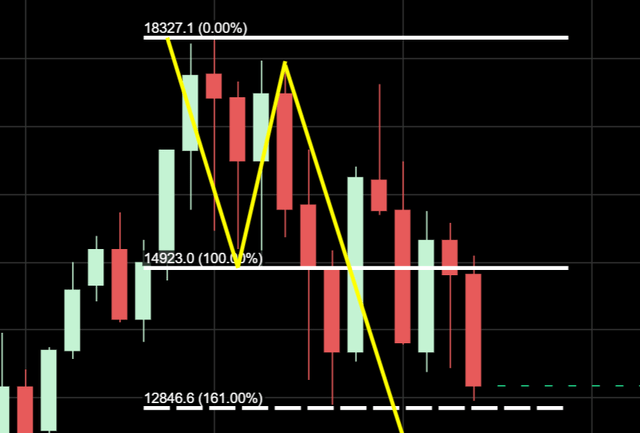
If we move to the chart below we can see a close up of the bearish wave one two structure. An initial topping out at $183 in January saw a decline to $148 by March forming the wave one. With the latter price point being hit, this also created the bullish candle wave two that allowed for the third wave to form and drop to new southern pastures at lower levels.
The Fibonacci 161 was the next stop at the $129 region which was then achieved in June. Apple very nearly made an attempt to break higher and render the bearish wave over from that price region with an enormous buy until the Jackson Hole speech was released in August and since then Apple has been clinging onto to a potential bullish set up from the Fibonacci 161 that has ultimately faded as the holiday season neared.
So let’s examine where the technical next stop may be price wise assuming there is a clear break below the $129 region.
It is one of the defining rules from my book “The Ward Three Wave Theory” that a financial market should look for its third wave to numerically replicate its wave one. If this proves to be exact in Apple’s case, then $115 is where this equity should be headed next.
We can see in the chart below that $115 is the Fibonacci 200 of this structure, if this price is to be achieved, then we can look to it being a bottom by looking for bullish three wave patterns that may form on the lower time frames. It is only as three wave patterns complete upwards from the daily, weekly eventually leading to the monthly chart, that we have any form of certainty that a bottoming at that price area may be forming. With failing bullish wave patterns climbing through the timeframes, it will be the Fibonacci 261 that all eyes will turn to below $100; but as we speak, we are a number of stages away from dealing with analyzing that scenario.
Apple monthly chart (2) (OvalXApple)
To Finalize, I would expect Apple to complete at $115 within the next 30 to 120 days, a strong break of $129 will go a long way towards heightening the probability of this as it is also plausible that the share price just wants to come slightly lower from here only to re set itself and form a new wave structure going north. If $115 is achieved, I will be looking for bullish wave patterns as mentioned and will be publishing an updated article in this case.
About the Three Wave Theory
The three wave theory was designed to be able to identify exact probable price action of a financial instrument. A financial market cannot navigate its way significantly higher or lower without making waves. Waves are essentially a mismatch between buyers and sellers and print a picture of a probable direction and target for a financial instrument. When waves one and two have been formed, it is the point of higher high/lower low that gives the technical indication of the future direction. A wave one will continue from a low to a high point before it finds significant enough rejection to then form the wave two. When a third wave breaks into a higher high/lower low the only probable numerical target bearing available on a financial chart is the equivalent of the wave one low to high point. It is highly probable that the wave three will look to numerically replicate wave one before it makes its future directional decision. It may continue past its third wave target but it is only the wave one evidence that a price was able to continue before rejection that is available to look to as a probable target for a third wave.
Disclosure: I/we have no stock, option or similar derivative position in any of the companies mentioned, and no plans to initiate any such positions within the next 72 hours. I wrote this article myself, and it expresses my own opinions. I am not receiving compensation for it (other than from Seeking Alpha). I have no business relationship with any company whose stock is mentioned in this article.

