
Summary:
- Management attributed revenue decline to market weaknesses in PC and server segments but highlighted recovery in the latter half of 2023 and emphasized AI servers, storage, and PCs for future growth.
- We analyzed Dells AI developments across all three of its segments to identify any competitive advantages that could give it an edge in the respective markets it competes in.
- Notably, Dell’s AI servers, exemplified by PowerEdge XE9680, exhibit strength, while PowerScale F900 enhances AI workloads, positioning Dell competitively in the market.
Thinglass
In a previous analysis of Hewlett Packard Enterprise Company (HPE) vs HP Inc. (HPQ), we emphasized Dell Technologies Inc.’s (NYSE:DELL) strategic move to consolidate its PC and server businesses through the acquisition of EMC in 2016. Notably, Dell emerged as a leader in both the server and storage vendors market and stands as the third-largest PC maker globally. However, despite its diverse portfolio, Dell experienced a 14.3% decline in revenue growth in 2023 compared to the previous year. During its latest earnings briefing from February 29th, management attributed this decline to market weaknesses in the PC and server segments, although highlighted that there was a notable recovery in all segments during the latter half of 2023. Furthermore, the company emphasized the significance of AI servers, AI storage, and AI PCs as key drivers for future growth. Consequently, we delved into the growth prospects of each of Dell’s segments, analyzing the impact of AI on each market and evaluating Dell’s competitiveness against its competitors, resulting in our Buy rating.
|
Revenue Breakdown by Segment ($ mln) |
2019 |
2020 |
2021 |
2022 |
2023 |
5-Year Average |
|
Servers and networking |
17,127 |
16,497 |
17,901 |
20,398 |
17,624 |
|
|
Growth (%) |
-14.2% |
-3.7% |
8.5% |
13.9% |
-13.6% |
-1.8% |
|
Storage |
16,842 |
16,091 |
16,465 |
17,958 |
16,261 |
|
|
Growth (%) |
0.4% |
-4.5% |
2.3% |
9.1% |
-9.4% |
-0.4% |
|
Total Client Solutions Group |
45,838 |
48,355 |
61,464 |
58,213 |
48,916 |
|
|
Growth (%) |
6.1% |
5.5% |
27.1% |
-5.3% |
-16.0% |
3.5% |
|
Total |
79,807 |
80,943 |
95,830 |
96,569 |
82,801 |
|
|
Growth (%) |
-0.1% |
1.4% |
18.4% |
0.8% |
-14.3% |
6.9% |
Source: Company Data, Khaveen Investments
Servers and Networking Segment
About the Products
Dell’s Servers portfolio includes “high-performance general-purpose and AI-optimized servers able to run workloads across customers’ IT environments, on-premises and in multicloud and edge environments“, such as AI model training, fine-tuning, and inferencing. On the other hand, its Networking portfolio includes Ethernet switches and Edge Networking infrastructure designed to address the needs of modern workloads across the edge, core, and cloud environments.
IDC, Statista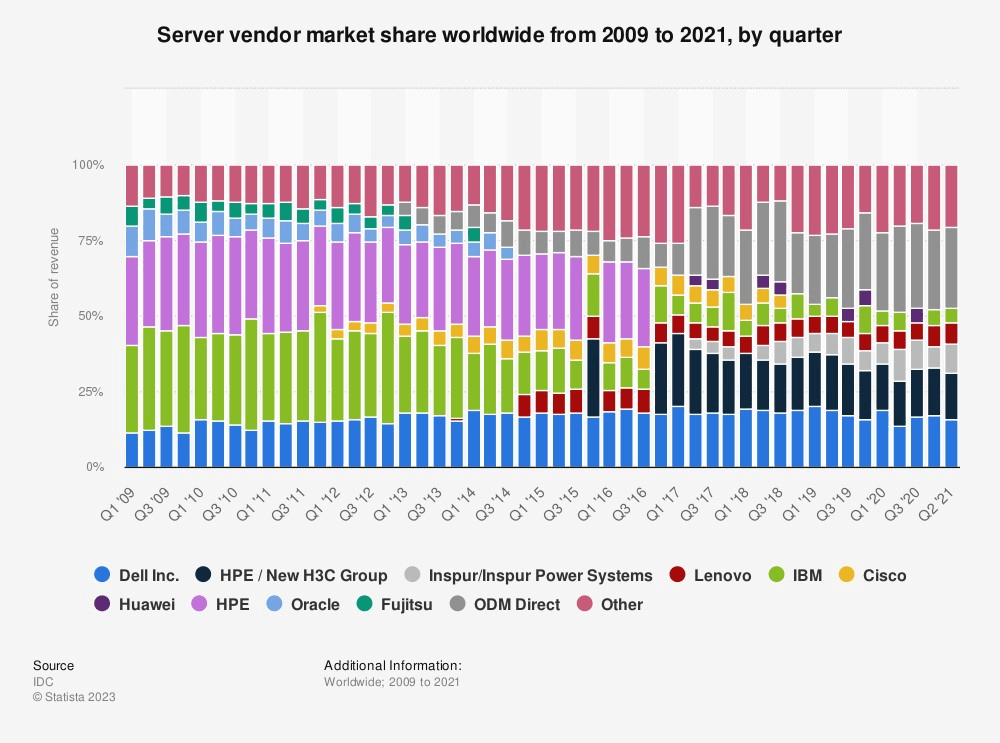
From the chart above, Dell’s market share fluctuated and declined slightly by 2% from 2016 (17.6%) to 2021 (15.6%), whereas HPE’s market share experienced a strong decline of 9.9% from 25.6% to 15.7% over the same period. Additionally, Inspur increased its market share by 3.3% to 9.4%, while International Business Machines Corporation’s (IBM) share declined significantly over the years. We also examined the number of server products, and HPE has the highest number with 52 products, followed by Dell and Inspur with 47 products. We believe despite having fewer server products than HPE, Dell is positioned as a well-established server vendor with a stable market share in a competitive market.
|
Comparison |
Dell |
HPE |
Inspur |
Lenovo Group Limited (OTCPK:LNVGY) |
IBM |
|
Number of Servers Product |
Source: Company Data, Khaveen Investments
Furthermore, we examine how Dell could maintain or improve its position in the server market with its AI-powered servers, one of the main segment growth drivers as highlighted by management in the latest earnings call.
How AI Enhances Servers
In our previous analysis of Advanced Micro Devices, Inc. (AMD), we highlighted how AI helps optimize data center operations such as reducing energy consumption, improving reliability, and optimizing servers. However, we also took note that AI relies on a combination of products and systems, particularly GPUs and CPUs, to achieve its full potential due to the high computational demands of large language models. GPUs excel in accelerating the training of deep neural networks through parallel computations, while CPUs handle various AI tasks including data preprocessing, model training, and less computationally intensive algorithms like rule-based systems or decision trees.
We referred to MLPerf Inference Score, which is a benchmark suite that measures system performance in processing inputs and generating results with pre-trained models across various scenarios. In addition, we examine three different metrics, to compare the performance of Dell and its competitors’ products:
- BERT: “A language representation model by Google. It uses two steps, pre-training and fine-tuning, to create state-of-the-art models for a wide range of tasks“.
- RetinaNet: “A one-stage object detection model that utilizes a focal loss function to address class imbalance during training“.
- ResNet: “A deep learning model used for computer vision applications“.
Additionally, we examined the results in both Server and Offline Modes to assess the System Under Test’s capabilities under dynamic and fixed query workloads, respectively. We used the score of Cisco’s server as a base of 1.0 as Cisco Systems, Inc. (CSCO) has the lowest score, and we adjusted other companies’ scores accordingly.
ML Commons, Khaveen Investments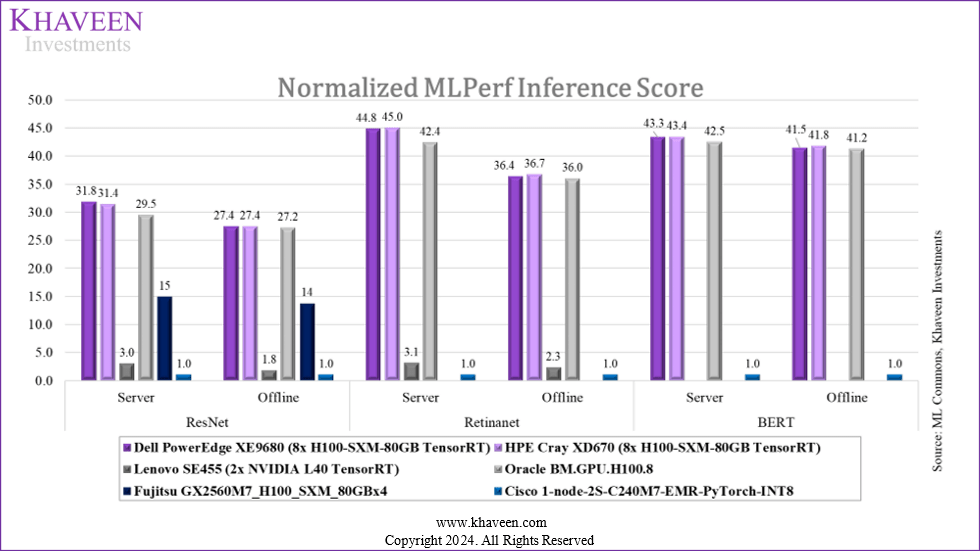
From the chart, Dell and HPE’s servers outperformed compared to other competitors. Both companies’ scores across all metrics were in line with each other, with only minor differences ranging from 0.0 to 0.4. Oracle Corporation’s (ORCL) servers also showcased a commendable performance, though slightly lower than Dell and HPE. We attributed the high scores of Dell, HPE, and Oracle to the utilization of 8 NVIDIA Corporation (NVDA) H100 accelerators, which significantly enhanced their capabilities. Fujitsu Limited’s (OTCPK:FJTSF) servers, although benefitting from the H100 accelerators, achieved a lower score due to the deployment of fewer accelerators (4 instead of 8). Similarly, we identified that the low score of Cisco’s servers may be attributed to the absence of any accelerator usage.
|
Comparison |
Process Core |
ResNet |
Retinanet |
BERT |
Factor Score |
||||
|
Servers |
Server |
Offline |
Server |
Offline |
Server |
Offline |
Ranking |
||
|
Dell PowerEdge XE9680 |
2 |
1 |
1 |
2 |
2 |
2 |
2 |
1.7 |
1.36 |
|
HPE Cray XD670 |
4 |
2 |
1 |
1 |
1 |
1 |
1 |
1.6 |
1.39 |
|
Lenovo SE455 |
6 |
5 |
5 |
4 |
4 |
NA |
NA |
4.8 |
0.74 |
|
Oracle BM.GPU.H100.8 |
2 |
3 |
3 |
3 |
3 |
3 |
3 |
2.9 |
1.13 |
|
Fujitsu GX2560M7 |
4 |
4 |
4 |
4.0 |
0.90 |
||||
|
Cisco C240M7-EMR |
1 |
6 |
6 |
6 |
6 |
6 |
6 |
5.3 |
0.64 |
|
Average |
3.2 |
3.5 |
3.3 |
3.2 |
3.2 |
3.0 |
3.0 |
3.2 |
|
Source, Khaveen Investments
From the results, we compiled a ranking table based on each server’s process core and scores from pre-trained models. The number of process cores is a factor for server efficiency, as more process cores could enable the servers to handle more tasks simultaneously, and Cisco’s server used the best process core compared to other companies’ servers. Overall, HPE servers have the highest ranking at 1.6, followed by Dell at 1.7, and Lenovo and Cisco servers are ranked last. Finally, we computed the factor score using each server’s average ranking within a range of 0.5x to 1.5x. Dell’s score is 1.36x, indicating that the company’s AI server has more competitive advantages compared to other competitors, though HPE’s AI server outperforms it slightly at 1.39x.
Outlook
TrendForce, Gartner, DIGITIMES Research, Khaveen Investments
According to TrendForce, despite a decline of 6% in global server shipments growth in 2023, AI server shipments exceeded expectations with 37.7% growth compared to 2022. Moreover, it is forecasted to continue growing with 38% growth in 2024, while global servers’ forecast growth stands at a mere 2.1%, further indicating the strong demand for AI servers.
With Dell holding a market share of 15.6%, we estimated the company’s non-AI and AI server shipments for 2023. For Dell’s non-AI server shipment projection, we assumed zero competitiveness from the company and thus a consistent market share of 15.6% from 2024 to 2027, forecasting based on the market’s non-AI server shipments. Regarding AI server shipments, we factored in our computed factor score of 1.36 for Dell and multiplied it by the market’s projected 38% growth in AI server shipments for 2024 to derive Dell’s anticipated AI server shipments growth. Subsequently, we multiplied this result by Dell’s AI server market share from the previous year to determine the company’s AI server unit shipments. We repeated this calculation for subsequent years and calculated Dell’s total server unit shipment growth based on both AI and non-AI server shipments.
Overall, we estimated Dell’s total server unit shipment growth in 2024 to be 3.2%, higher than the market growth of 2.1%. Similarly, the company’s server shipment growth in the following year is also higher than the market growth, indicating the company’s competitiveness in AI servers.
|
Servers Shipment Forecast |
2023 |
2024F |
2025F |
2026F |
2027F |
|
Total Server Shipments (mln) |
13.39 |
13.66 |
14.48 |
15.35 |
16.27 |
|
Growth (%) |
-6.0% |
2.1% |
6.0% |
6.0% |
6.0% |
|
Dell’s AI Server Unit Shipments (mln) |
0.18 |
0.28 |
0.38 |
0.50 |
0.68 |
|
Dell’s Non-AI Server Unit Shipments (mln) |
1.90 |
1.88 |
1.94 |
2.00 |
2.04 |
|
Dell’s Total Server Unit Shipments (mln) |
2.09 |
2.16 |
2.32 |
2.50 |
2.72 |
|
Growth % |
3.2% |
7.4% |
7.9% |
8.6% |
|
|
Dell AI Server Market Share (%) |
15.6% |
17.1% |
18.4% |
19.7% |
21.1% |
|
Dell Non-AI Server Market Share (%) |
15.6% |
15.6% |
15.6% |
15.6% |
15.6% |
|
Dell Weighted Server Market Share (%) |
15.6% |
15.8% |
16.0% |
16.3% |
16.7% |
Source: Company Data, IDC, Khaveen Investments
Due to Dell’s competitiveness in AI servers as discussed previously, we expect its AI server market share to increase substantially from 15.6% in 2023 to 21.1% in 2027. As a result, we expect Dell’s weighted server market share would also increase from 15.6% to 16.7% over the forecast period, gaining share from other companies.
Storage Segment
Next, we examined how AI could benefit Dell’s data storage business.
About the Products
Dell’s storage portfolio includes:
- All-flash arrays storage: storage that contains only flash memory drives (similar to USB drives or memory cards) and is ideal for high-speed data access (e.g. PowerStore)
- Scale-out file storage: storage that can expand its capacity by adding more drives (HHD, SSD, NVMe, etc.) to the existing storage array. (e.g. PowerScale)
- Object platforms storage: Storage architecture that handles large amounts of “unstructured data such as photos, videos, email, web pages, sensor data, and audio files“. (e.g. ECS)
- Software-defined storage (“SDS”): a cloud storage for managing and provisioning virtualized data that is independent of the underlying hardware, improving efficiency and reducing costs. (e.g. PowerFlex, ObjectScale)
IDC, StorageNewsletter, Statista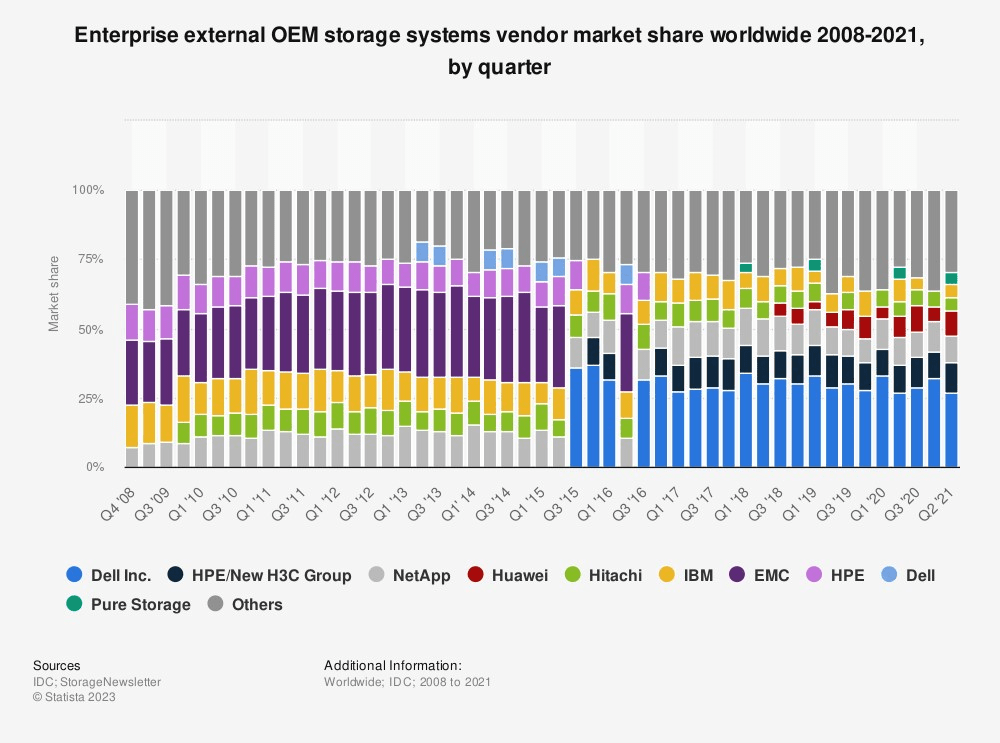
In our previous analysis of HPE vs HPQ in late 2023, we highlighted Dell’s market share in the enterprise data storage market was triple compared to HPE. Moreover, we expected the company to maintain its leading position moving forward. To identify the reason for the company’s leadership in this market, we compiled the total number of storage available from the leading storage vendors. Dell’s number of storage products is the highest among the top 6 leading storage companies, further indicating the company’s competitiveness in the storage market.
|
Comparison |
Dell |
HPE |
NetApp |
Huawei |
Hitachi |
IBM |
|
Number of Storage Products |
Source: Company Data, Khaveen Investments
How Storage Products Enhance AI
Data storage is essential for AI, supporting training, data storage, and inference tasks. AI workloads involve training algorithms, often in phases, with diverse data types. These workloads demand high-speed, scalable storage, typically flash-based, to handle unstructured data efficiently. In addition, according to NVIDIA, AI storage should have high performance and scalability in both capacity and performance to accommodate the growing demands of AI workloads.
Dell’s PowerScale, a scale-out file storage, received enhancements to its storage systems, resulting in up to a 200% improvement in performance for streaming reads and writes, along with updates to its PowerScale OneFS software to enhance AI modeling capabilities.
PowerScale will offer a new smart scale-out capability to improve single compute node performance for enhanced GPU utilization, leading to faster storage throughput for AI training, checkpointing and inferencing. – Dell
Dell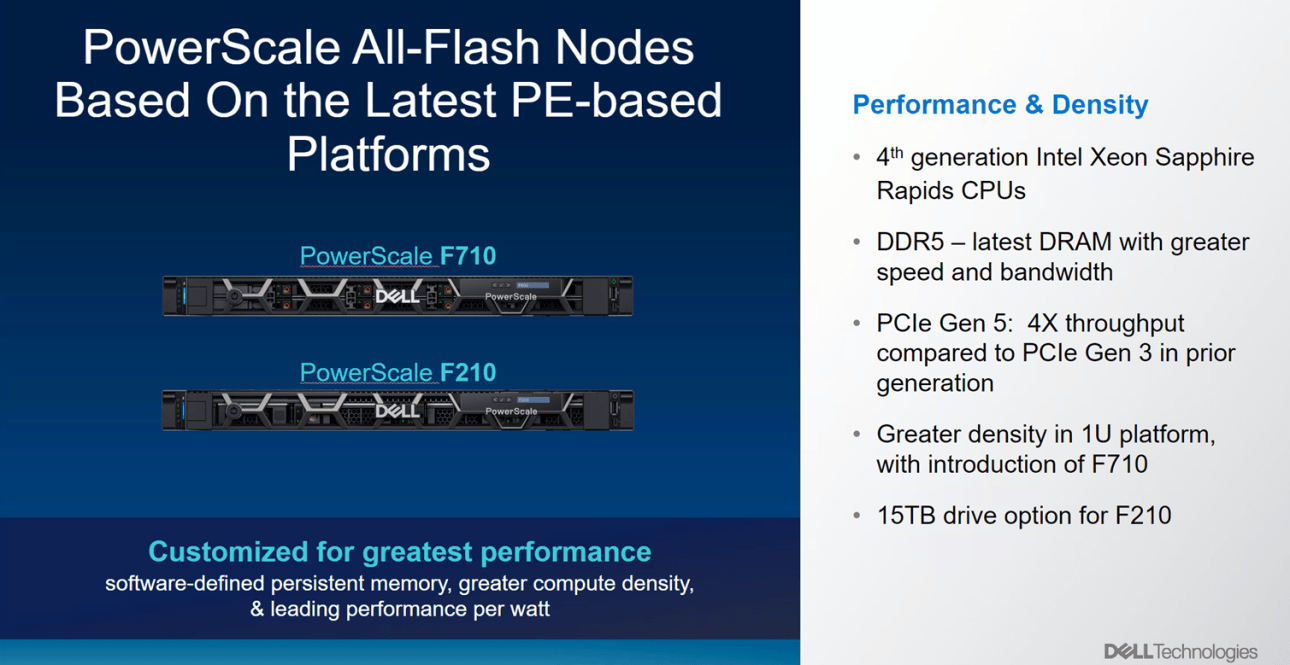
Additionally, according to the company, “Dell PowerScale is expected to be the first Ethernet storage solution validated on NVIDIA DGX SuperPOD, which will give customers increased flexibility, speed and ease for AI storage”.
Analysis
We compiled a table of AI storage launched by the leading storage vendors, excluding Huawei and Hitachi (4th and 5th largest players respectively) due to a lack of available information and specifications of AI storage. We compared the storage that offers the greatest scalability and capacity and is specifically used for AI/ML or High-Performance Computing (HPC) workloads:
- Dell PowerScale F900: “The F900 is best suited for… algorithmic trading, artificial intelligence, machine learning and HPC workloads”.
- HPE Alletra 4120: “specifically designed to run the broadest range of data storage-intensive workloads “.
- NetApp AFF A900: “Run artificial intelligence and machine learning applications with the lowest latency “.
- IBM Storage Scale System 3500: “A single storage platform for multiple applications and high-performance workloads “
- Pure Storage FlashBlade//S: “… the ideal data storage platform for AI…unstructured workloads and accelerates AI processes “.
We examined based on three main metrics including system form factor, raw capacity, and scalability. The system form factor refers to the number of rack units per storage, so a higher number of the factor allows for greater raw capacity. In addition, raw capacity and scalability are other important factors for AI data storage, as discussed previously.
|
AI Storage Comparison |
System Form Factor |
Raw Capacity per Cluster |
Scalability (Max no. of nodes per cluster) |
|
Dell PowerScale F900 |
2U |
Up to 186 PB (186,000 TB) |
252 nodes |
|
HPE Alletra (4120) |
2U |
Up to 96 PB (96,000 TB) |
200 nodes |
|
NetApp, Inc.’s (NTAP) NetApp AFF A900 |
4U-8U |
Up to 702.7 PB (702,700 TB) |
24 nodes |
|
IBM Storage Scale System 3500 |
2U |
Up to 633 YB (633 tln TB) |
1000 nodes |
|
Pure Storage FlashBlade//S |
5U |
Up to 1.92 PB (1,920 TB) |
10 nodes |
Source: Company Data, Khaveen Investments
Regarding the system form factor, NetApp storage boasts the highest number of 4-8U, followed by Pure Storage’s FlashBlade//S, while the remaining three storages all come in 2U sizes. For raw capacity, IBM’s Storage Scale System 3500 edges out other competitors’ storage with a massive capacity of 633 YB per cluster (equivalent to 633 tln TBs). Dell’s PowerScale F900 leads as the second highest with a raw capacity of up to 186 PB (equivalent to 186,000 TB) per cluster, while Pure Storage’s FlashBlade//S has the lowest capacity of only 1,920 TB despite its larger system form factor. Additionally, IBM storage stands out with the highest number of nodes per cluster (1000 nodes), enabling superior scalability compared to other storage solutions. Dell storage ranks second in node count with 252 nodes, while Pure Storage lags with the lowest scalability. Therefore, we believe even though Dell’s storage lacks competitiveness compared to IBM and NetApp’s storage, it is still better than the storage of HPE and Pure Storage. The table below shows our ranking and our derived factor score for each storage.
|
AI Storage Comparison |
System Form Factor |
Raw Capacity per Cluster |
Scalability (Max no. of nodes per cluster) |
Average |
Factor Score |
|
Dell PowerScale F900 |
3 |
3 |
2 |
2.67 |
1.08 |
|
HPE Alletra (4120) |
3 |
4 |
3 |
3.33 |
0.92 |
|
NetApp AFF A900 |
1 |
2 |
4 |
2.33 |
1.17 |
|
IBM Storage Scale System3500 |
3 |
1 |
1 |
1.67 |
1.33 |
|
Pure Storage FlashBlade//S |
2 |
5 |
5 |
4.00 |
0.75 |
Source: Khaveen Investments
Overall, IBM’s AI Storage performed the best with the highest average ranking of 1.67, followed by NetApp’s AFF A900 storage (2.33). Even though Dell is the leader in the storage vendor market, its AI storage only ranked 3rd among the leading storage vendors with an average ranking of 2.67. However, it still has more competitive advantages compared to HPE and Pure Storage’s AI storage. We calculated Dell’s AI storage factor score to be 1.08 and expected that it would outperform the market, except for NetApp and IBM.
Outlook
The storage market is expected to grow at a CAGR of 5.49%, driven by “scalable and flexible storage solutions“. In addition, we believe that the demand for AI data storage (with high capacity and scalability) would also increase to accommodate AI and HPC workloads. Factoring our calculated factor score of 1.08 for Dell, we derived Dell’s storage CAGR to be 5.95%, reflecting the company’s competitiveness. We forecasted the company’s storage segment from 2024 and beyond based on the CAGR.
|
Revenue Projection by Segment ($ mln) |
2023 |
2024F |
2025F |
2026F |
2027F |
|
Storage |
16,261 |
17,228 |
18,253 |
19,338 |
20,488 |
|
Growth (%) |
-9.4% |
5.95% |
5.95% |
5.95% |
5.95% |
Source: Company Data, Statista, Khaveen Investments
Client Solutions Group Segment
About the Products
Dell’s CSG includes “notebooks, desktops, and workstations and branded peripherals that include displays, docking stations, keyboards, mice, and webcam and audio devices, as well as third-party software and peripherals.“
Gartner, Khaveen Investments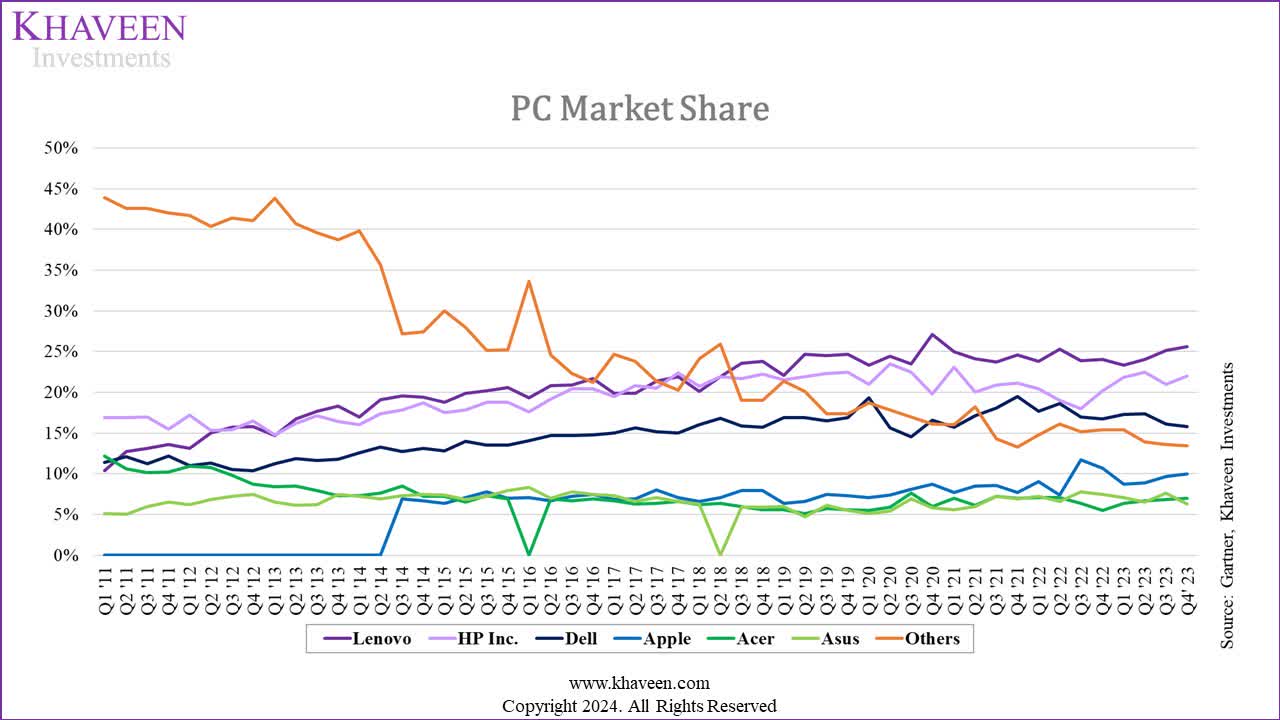
Based on the market share chart, the leading PC makers have been gaining shares over the past decades, as the Others’ market share showed a declining trend over the same period. In 2023, Lenovo and HP Inc.’s market share experienced a slight increase (23.3% to 25.6% and 21.8% to 22% respectively). On the other hand, Dell, which ranks 3rd overall, has its market share decreased sequentially from 17.3% in Q1 to 15.8% in Q4. We believe the decline could be attributed to the poor demand from both the Commercial and Consumer segments, which resulted in a negative 19.5% growth in Dell’s PC shipments in 2023. Additionally, management highlighted the increased competition QoQ in low-price PC brands in its Q4 2023 earnings call, which, we believe, could be the reason for Dell’s sluggish demand.
How AI Enhances PC Products (“NPU”)
Despite the strong decline in PC shipments in 2023, management showed positive regarding the opportunity from AI PCs with Dell’s latest introduction of commercial AI PCs.
While PC demand recovery has pushed out, we remain bullish on the coming PC refresh cycle and the longer-term impact of AI on the PC market. – Yvonne McGill, CFO
For a PC to have AI-enabled features, a specific chip is used, called a Neural Processing Unit (“NPU”), which is “a dedicated processor or processing unit on a larger SoC designed specifically for accelerating neural network operations and AI tasks“. It is more efficient than GPUs for these tasks due to its dedicated focus and optimized architecture. NPUs are integrated into larger SoCs like Intel Core Ultra and the latest AMD Ryzen series processors, or can be discrete units on motherboards for specialized operations.
Compared to GPUs, NPUs offer greater efficiency for AI-related tasks because they extract dedicated circuits from GPUs, allowing them to handle AI workloads more effectively and at lower power levels. NPUs complement CPUs and GPUs by specializing in AI-driven tasks, such as background blurring in video calls or object detection in photo editing, while the other processors handle broader tasks.
In addition, Intel Corporation (INTC) reported that its newest Intel Core Ultra processor, equipped with NPU, has demonstrated superior performance compared to another processor lacking an NPU, as depicted in the image below.
Intel
AI PC Competitiveness
As AI PCs are a new market, we believe that the company that has introduced more AI PCs would have a first-mover advantage and thus can have more product breadth competitiveness than other PC makers. Therefore, we compiled a table of AI-capable PCs as % of the total PCs from the top 5 PC makers. We got the total number of PCs for each company from its website. For AI PCs, we sorted out the PCs that use processors with NPU integrated, including the Intel Core Ultra Processors series and AMD Ryzen (AMD) (8000s series and 7000s series). To enable AI PC, the processor (with NPU) needs to reach 40 TOPS, and those processors are considered the best available in the current market, with AMD at 39 TOPS and Intel at 34 TOPS.
|
AI PC |
Lenovo |
HP |
Dell |
Asus |
Acer |
|
Number of AI PC |
80 |
31 |
23 |
14 |
6 |
|
Using Intel Core Ultra Processor (Max 34 TOPS) |
48 |
21 |
21 |
4 |
3 |
|
Using AMD Ryzen 8040s series (Max 39 TOPS) |
20 |
3 |
0 |
4 |
3 |
|
Using AMD Ryzen 7040 series |
12 |
7 |
2 |
6 |
0 |
|
Total PC |
223 |
215 |
84 |
59 |
59 |
|
% of AI-capable PC |
35.9% |
14.4% |
27.4% |
23.7% |
10.2% |
|
Ranking |
1 |
4 |
2 |
3 |
5 |
|
Factor Score |
1.5 |
0.75 |
1.25 |
1 |
0.5 |
Source: Company Data, Khaveen Investments
We observed that Lenovo, which has the largest percentage of market share, also has the largest number of PCs as well as AI PCs (35.9%). On the other hand, the second-largest PC maker HP Inc even has a lower % of AI PCs (14.4%) than Dell (27.4%) and Asus (23.7%). Additionally, Acer has the lowest % of AI PCs in its product portfolio. Overall, we believe Dell, though lags Lenovo, still edges out other competitors in terms of AI PC competitiveness. We indicated the ranking for each company and calculated our factor score accordingly.
Outlook
Canalys, Khaveen Investments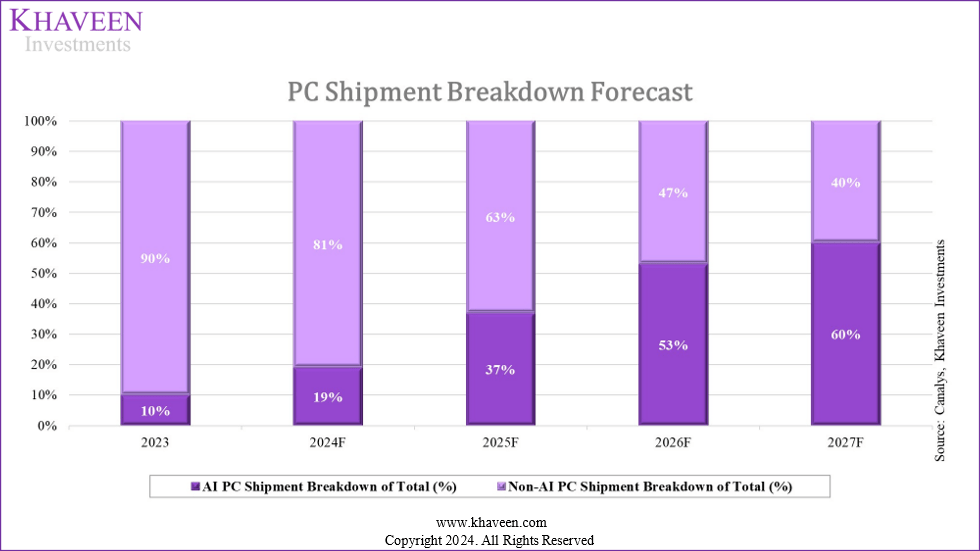
Canalys forecasted that the AI PC market will grow at a CAGR of 67.1% from 2023-2027, reflecting strong demand for AI PCs. AI PCs’ market share is expected to increase from 19% to 60% in 2027, driving the global PC shipment market.
With Dell holding a market share of 15.8%, we estimated the company’s non-AI and AI PC shipments for 2023. We did a similar projection to Dell’s server shipment growth for the company’s PC shipment growth in 2024 and beyond. For Dell’s non-AI PC shipment projection, we assumed zero competitiveness from the company and thus a consistent market share of 15.8% from 2024 to 2027, forecasting based on the market’s non-AI PC shipments. Regarding AI PC shipments, we factored in our computed factor score of 1.25 for Dell and multiplied it by the market’s projected growth in AI PC shipments to derive Dell’s anticipated AI PC shipments growth. Subsequently, we multiplied this result by Dell’s AI PC market share from the previous year to determine the company’s AI PC unit shipments. We then calculated Dell’s total PC unit shipment growth based on both AI and non-AI PC shipments.
Similar to Dell’s server shipment growth, we projected the company’s AI PC shipment growth in 2024 and beyond, factoring in Dell’s factor score of 1.25. We then multiplied it by the market’s AI shipment projected growth and Dell’s AI PC market share from the previous year to calculate the company’s AI PC unit shipments. For Dell’s non-AI PC shipment projection, we assumed no competitive advantage for the company, resulting in a consistent market share of 15.8% from 2024 to 2027, forecasted based on non-AI PC shipments. Overall, we estimated Dell’s total PC unit shipment growth in 2024 to be 14.2%, higher than the market growth of 11.5%. Similarly, the company’s PC shipment growth in the following year is also higher than the market growth, indicating the company’s competitiveness in AI PCs.
|
PCs Shipment Forecast |
2023 |
2024F |
2025F |
2026F |
2027F |
|
Total PC Shipments (mln) |
262.86 |
292.97 |
329.38 |
336.15 |
341.45 |
|
Growth (%) |
11.5% |
12.4% |
2.1% |
1.6% |
|
|
Dell’s AI PCs Unit Shipments (mln) |
4.15 |
9.96 |
24.76 |
39.05 |
46.37 |
|
Dell’s Non-AI PCs Unit Shipments (mln) |
37.38 |
37.49 |
32.79 |
24.96 |
21.58 |
|
Dell’s Total PCs Unit Shipments (mln) |
41.53 |
47.45 |
57.54 |
64.01 |
67.95 |
|
Growth % |
14.2% |
21.3% |
11.2% |
6.1% |
|
|
Dell AI PC Market Share (%) |
15.8% |
17.9% |
20.3% |
21.9% |
22.6% |
|
Dell Non-AI PC Market Share (%) |
15.8% |
15.8% |
15.8% |
15.8% |
15.8% |
|
Dell Weighted PC Market Share (%) |
15.8% |
16.2% |
17.5% |
19.0% |
19.9% |
Source: Company Data, Gartner, Khaveen Investments
We expect the company’s AI PC market share to increase substantially by 6.8% from 15.6% in 2023. Moreover, we estimate Dell’s weighted PC market share to increase from 15.8% to 19.9% over the forecast period, gaining share from other companies. Given Lenovo’s top ranking in overall PC shipments and AI PC numbers, we anticipate it to outperform the market and gain additional market share. Meanwhile, we expect Dell’s market share to strengthen relative to other competitors, except for Lenovo.
Verdict
|
Revenue Projection by Segment ($ mln) |
2023 |
2024F |
2025F |
2026F |
2027F |
|
Servers and networking |
17,624 |
18,157 |
19,457 |
20,929 |
22,618 |
|
Growth (%) |
-13.6% |
3.0% |
7.2% |
7.6% |
8.1% |
|
Storage |
16,261 |
17,228 |
18,253 |
19,338 |
20,488 |
|
Growth (%) |
-9.4% |
5.95% |
5.95% |
5.95% |
5.95% |
|
Total Client Solutions Group (PCs) |
48,916 |
55,886 |
67,773 |
75,392 |
80,026 |
|
Growth (%) |
-16.0% |
14.2% |
21.3% |
11.2% |
6.1% |
|
Total |
82,801 |
91,271 |
105,484 |
115,659 |
123,132 |
|
Growth (%) |
-14.3% |
10.2% |
15.6% |
9.6% |
6.5% |
Source: Company Data, Khaveen Investments
All in all, we forecast Dell to achieve a robust growth rate of 10.2% in 2024, largely fueled by the expansion in AI servers, AI storage and AI PCs. Our confidence in Dell’s trajectory stems from its deliberate integration of AI technologies across its server, storage, and PC offerings, showcasing its dedication to enhancing performance and adapting to dynamic market needs. Notably, we analyzed that Dell’s AI servers, exemplified by the PowerEdge XE9680, exhibit exceptional prowess in various AI tasks, leveraging NVIDIA’s H100 accelerators for superior performance, albeit slightly trailing behind HPE’s AI servers. In storage, we believe Dell’s PowerScale F900 stands out for its ability to enhance AI workloads, catering to the demands of AI modeling and training, despite our analysis determining a lower competitive factor score compared to competitors like NetApp and IBM. Nonetheless, we anticipate this AI storage solution to bolster Dell’s stronghold in the enterprise storage market. Furthermore, we believe Dell’s foray into commercial AI PCs, featuring NPUs, positions the company as a front runner in the AI PCs market and could be poised to capture a significant market share. While both Dell and HPE/HPQ operate across similar segments, we believe HPE holds an advantage in AI servers, whereas Dell excels in AI storage and AI PCs.
Khaveen Investments
Based on a discount rate of 8.3% (company’s WACC) and terminal value based on the industry’s average EV/EBITDA TTM of 13.36x, we derived an upside of 20.8%. Thus, we rate Dell as a Buy with a target price of $150.89.
Analyst’s Disclosure: I/we have a beneficial long position in the shares of DELL either through stock ownership, options, or other derivatives. I wrote this article myself, and it expresses my own opinions. I am not receiving compensation for it (other than from Seeking Alpha). I have no business relationship with any company whose stock is mentioned in this article.
No information in this publication is intended as investment, tax, accounting, or legal advice, or as an offer/solicitation to sell or buy. Material provided in this publication is for educational purposes only, and was prepared from sources and data believed to be reliable, but we do not guarantee its accuracy or completeness.
Seeking Alpha’s Disclosure: Past performance is no guarantee of future results. No recommendation or advice is being given as to whether any investment is suitable for a particular investor. Any views or opinions expressed above may not reflect those of Seeking Alpha as a whole. Seeking Alpha is not a licensed securities dealer, broker or US investment adviser or investment bank. Our analysts are third party authors that include both professional investors and individual investors who may not be licensed or certified by any institute or regulatory body.