
Summary:
- Over the past ten years, since 2013, Amazon.com, Inc. has generated better than $250 billion in cash from operations that it has reinvested into the business.
- As companies like Amazon grow and mature, the benefits of investment in scalability can start to top out.
- At the end of September 2022, Amazon’s $1.15 Trillion equity capitalization approximated nearly 5X its cost.
- Further drops in Amazon’s share price in response to recessionary concerns would serve to make the shares more attractive.
echoevg
Written by Christopher H. Volk, author of The Value Equation: A Business Guide to Wealth Creation for Entrepreneurs, Leaders & Investors.
As a consumer, analyst, and business leader, I have always been of two minds when it comes to Amazon.com, Inc. (NASDAQ:AMZN).
On the one hand, like much of America, I am a long-time Prime customer, having incorporated Amazon into my shopping and media consumption habits for years. It’s been amazing.
On the other hand, I am a sceptic.
Over the years, I have received individual packages almost daily from Amazon that contain modestly priced items. How, I have wondered, can anyone make any money on this?
So, I set out to try to understand how Amazon’s business model delivers for its shareholders using the Value Equation framework that I created and used as a public company CEO.
The Value Equation
All corporate business models can be broken down into six basic variables:
- Sales
- Business Investment
- Operating Profit Margin
- % of the Company Funded by OPM (Other People’s Money)
- The Cost of That Money
- Annual Maintenance CapEx and Periodic Investment Losses.
The approach here is financial, rather than accounting. Sales is the one variable common to both, but the other variables deviate somewhat.
Operating Profit Margin is the amount of income before depreciation and OPM payments as a percentage of sales. I tend to also generally deduct stock-based compensation (“SBC”), both because it is non-cash and because it reflects the value of share grants and not the actual shares ultimately earned. The impact of share grant equity dilution is incorporated later.
Business Investment is the amount of cash invested in the company net of non-interest-bearing liabilities.
To do this, you basically ignore accumulated depreciation and any non-cash accounting balance sheet items you can find, such as operating lease assets or straight-lined rents.
Non-interest-bearing liabilities include trade payables, accruals and customer deposits/gift cards, all of which help AMZN to fund part of its needed investment at no cost. What you are left with is the amount of the net business cost that needs to be financed with lease and borrowing proceeds or shareholder equity.
When it comes to how AMZN funds its growth, the company leans on its free cash flow. Over the past ten years, since 2013, the company has generated better than $250 billion in cash from operations that it has reinvested into the business.
Second to this amount are assets rented subject to operating leases.
In 2013, annual rents approximated $750 million. For the first three quarters of 2022, cash operating lease expense amounted to an annualized $8.3 billion. Assuming the real estate was rented at an annual cost of 5%, the cost of the buildings funded by landlord lease proceeds over the recent ten years would amount to an impressive $150 billion.
Lease proceeds are at the heart of why I use the term OPM. Whereas accountants are conditioned to think about borrowings, I come from a background where I have helped finance companies by owning their real estate. Just like borrowings, it is a capital stack election. Only the cost of the assets leased is not generally determinable for the reader of financial statements. You have to make an educated guess.
As to borrowings, AMZN only added $9.2 billion over the past decade.
The cost of OPM used by AMZN is simply estimated by dividing its interest and lease costs into the amount of estimated lease and borrowing proceeds.
Finally, there is maintenance CapEx.
Over the past decade, AMZN has spent an average of $19 billion annually on reported capital expenditures, or about 4% of the amount of their estimated business investment at the end of the most recent third quarter.
This excludes landlord lease proceeds not shown in the statements of cash flows. For the sake of simplicity, I assumed that half this amount, or 2%, involves capital expenditures required to maintain the business.
As large companies like Amazon become more seasoned, they tend to be subject to losses from bad investments or losses from discontinued real estate. I expect that this will start to happen. In its most recent third quarter report, the company noted some real estate impairments.
In 2021, the company impressively reported an $11 billion earnings pop in the form of non-cash appreciation on its investment in the electric vehicle manufacturer Rivian.
Such types of investments can also result in losses. As a result, using just 2% of business investment as a maintenance capex plug is likely conservative. There are always potential land mines out there that need to be incorporated in shareholder returns.
Once you have the six variables computed, it’s a simple matter to string them together into The Value Equation to compute a current pre-tax equity return on shareholder equity at cost.
The Value Equation
Christopher H. Volk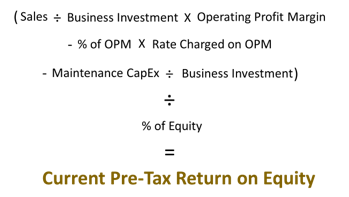
Current pre-tax equity returns are the root of total return expectations. Here is how it looks for Amazon:
Company Financial Statements and YCharts Data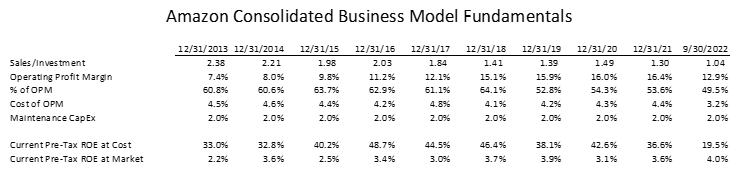
Amazon’s business model has changed over time. Most notably, its ratio of Sales to Business Investment is less than half what it was a decade ago, which has done the most to adversely impact equity returns.
If you thought Amazon was a prototypical asset-light company, such has not come to pass. Meanwhile, the company’s operating profit margin in 2022 has fallen from prior year levels as elevated costs, some inflation-induced, have taken a toll.
Still, operating margins are far better than where they stood a decade ago. Presumably, this improvement is, at least partly, a result of prior investments in growth and scale that started to pay off. As companies like Amazon grow and mature, the benefits of investment in scalability can start to top out.
A reduced reliance on OPM funding has also diminished current equity returns. Altogether, the company’s current pre-tax equity returns have been trending downward since they impressively peaked at over 48% in 2016.
All of this is nice to know, but Amazon cannot be bought at cost. At its peak in 2015, Amazon’s equity sold for about 16 times its initial cost, propelling founder Jeffrey Bezos for a while to be the world’s richest person.
At the end of 2021, the company’s equity was selling for about 10 times cost. Based on recent pricing, the multiple has fallen further to around 3.5X, with shares falling in value by half in 2022.
The difference between equity at cost and equity at market is called Equity Market Value Added, or EMVA. Investors in AMZN cannot buy in at cost, which means the Business Investment variable in their Value Equation is different.
To compute current investor equity returns, you need to add EMVA to the initial investment at cost. This change to the equation will alter two of the other variables as well. The portion of Business Investment funded by OPM will change, as will the percentage of Business Investment annually reinvested in maintenance capex and investment losses.
At the end of September, the current pre-tax ROE for shareholders at market approximated 4%. Using the company’s share price at December 31 elevates the current pre-tax return further to around 5.4%.
Bridging from a current pre-tax rate of return to a total expected shareholder rate of return first requires an expectation for taxes. Over the past decade, Amazon’s calculated tax rate has been highly volatile, with the median overall rate just shy of 20%. Using a rate of 20% results in a current shareholder rate of return of about 4.3% based on a year-end share price.
Now comes the stock-based compensation, which we ignored when computing AMZN’s operating profit margin.
On average, shareholder dilution arising from the exercise of stock options has been about 1.3% since 2013. Future dilution may be less owing to recent AMZN share price declines. But, if we assume an annual dilution of 1.3%, the current net investor after tax diluted return comes to around 3%.
The final step to arrive at an estimated total after-tax rate of return is to add in an expected rate of growth. For followers of AMZN, this is the hard part. Earnings, earnings per share, and operating income growth have been volatile over the past decade. It is also the heart of the issue.
Christopher H. Volk
The market tends to prefer greater growth dependability than AMZN has exhibited. However, the market also loves quality disruptors like AMZN, often extending wide valuation latitude.
Still, when it comes to operating income, net income, and EPS, the median AMZN growth numbers over the past decade have been 13.6%, 8.1% and 18.5% respectively.
If you like any of these and believe they are reflective of a sustained business model, then AMZN is almost certainly a long-term buy at the current price, suggesting future returns ranging from the low teens to low twenties.
Company Financial Statements and YCharts Data
Peeling Back the Growth
Amazon is a large, complex company, and getting behind the numbers is a challenge. The annual reports have the most useful data, since they break down revenues and operating earnings by segment.
How Amazon has determined its segments has changed over the years, which means that disclosures have not been consistent over its history as the company has grown.
Today, the segments include North American Sales (this includes Canada and Mexico), International Sales, and Amazon Web Services, or AWS. The last of these started in 2006, with results that were not separately disclosed until 2015. It has been on a growth tear ever since.
AWS, in a completely different line of business, is the leader in cloud data storage, provides services in 190 countries, and has been the horse in recent AMZN consolidated performance.
Company Financial Statements 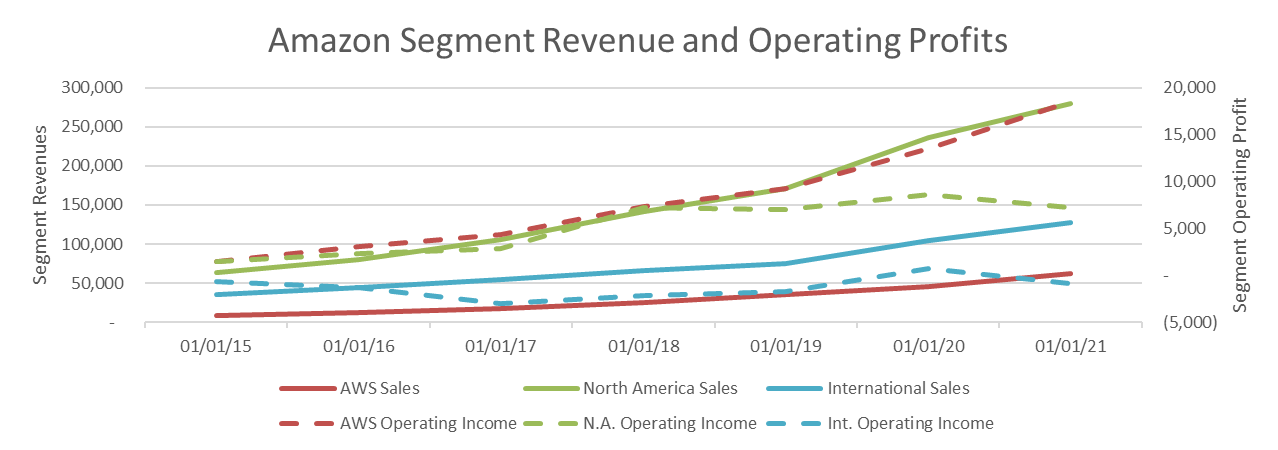
Looking at the chart of AMZN segment revenues and operating profits could cause one to question the future expected rate of Amazon’s growth. Sales growth is impressive, but North American operating income has been more or less stagnant since 2018.
Given the company’s declining profitability through September, 2022, one can expect this chart to look worse with the pending release of year-end 2022 numbers. The same can be said for reported international operating profit margins, which have been negative every year since 2015, with the exception of a small $717 pandemic-aided operating profit in 2020.
What stands out is AWS.
AMZN’s cloud computing services segment has simply reported solid sales growth, averaging 41% since 2015, with a far better average operating income growth of approximately 141%. For the seven years ended in December 2021, AWS provided, on average, more than 70% of Amazon’s operating income, with sales averaging just over 10% of the consolidated company.
Christopher H. Volk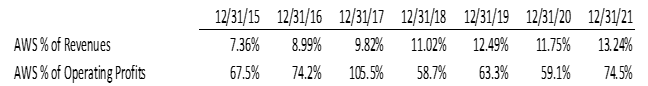
AMZN’s growth can be looked at also by country, as illustrated below:
Company Financial Statements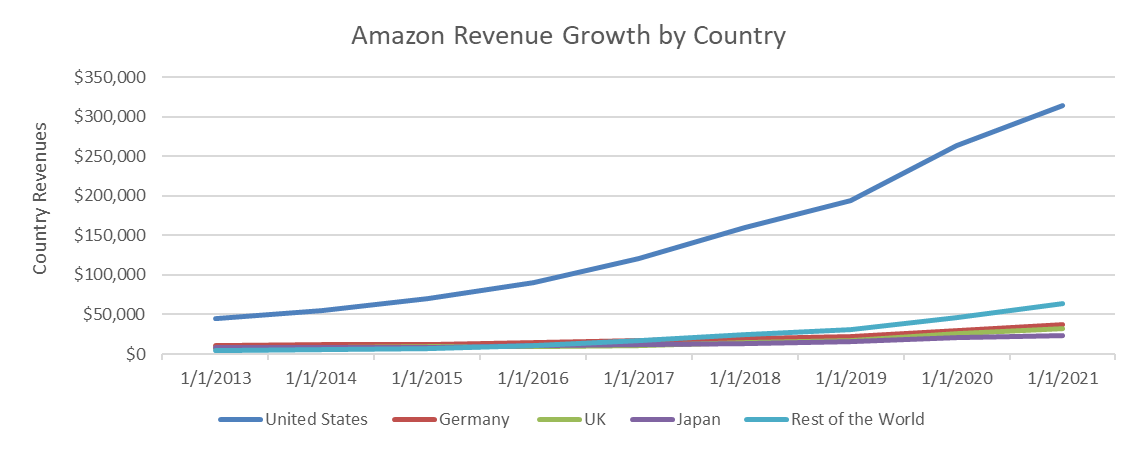
Without question, the United States is where AMZN has its home field advantage and where growth has been incredible, averaging nearly 30% annually from 2012 to 2021.
Wanting to Break Down Equity Returns
The thing about using a tool like The Value Equation to determine current corporate equity rates of return on a company like AMZN is that the result is of a consolidated whole. But if we could dismantle AMZN and look at the returns of each segment specifically, the information would tell us so much more.
Even this would fall short of what I would prefer to know. That’s because there is much inside each of the North American and International silos, not the least of which is the company’s impressive array of media investments. And how about its Whole Foods Market, Ring, or other material subsidiaries?
How I compute operating margin and how AMZN does is different.
The AMZN numbers are basically pre-tax income before interest income and interest expense. Still, it is easy to estimate that the company’s current approximate after-tax ROE for shareholders is far less than the consolidated 3% for its North American and International Segments.
These areas have been the greatest sources of revenue growth, giving hope to those who like to look at values of companies in relation to their sales. But price: sales ratios are far less relevant with market-leading, maturing, large cap enterprises.
Given AMZN’s segment reporting and what I anticipate it will show as of December 31, 2022, it is no surprise that AMZN has announced widespread staffing cuts estimated to be as high as 20,000 as it looks to improve its operating model and prospects for earnings growth, especially in its non-AWS activities.
For “brick and mortar” retailers, the segment reporting chart must be particularly annoying. It is one thing to compete head-to-head with the convenient services Amazon provides. It is another matter altogether to compete with a retailer whose operations and values are effectively subsidized by a highly profitable and scalable web services company.
Recent Value Creation
The notion of value creation is one of making a company worth more than it costs to put in place. The world’s leading companies tend to have this attribute in common, which creates EMVA. At the end of September 2022, AMZN’s $1.15 Trillion equity capitalization approximated nearly 5X its cost.
Equity at cost is a function of proceeds from shares issued, together with free cash flow reinvested in the business. AMZN does not pay any shareholder dividends, which means nearly all corporate cash flows have been reinvested in the company.
What follows is a look at the equity capitalization change of AMZN compared to the company’s reinvested free cash flows over the most recent five- and ten-year periods.
YCharts Data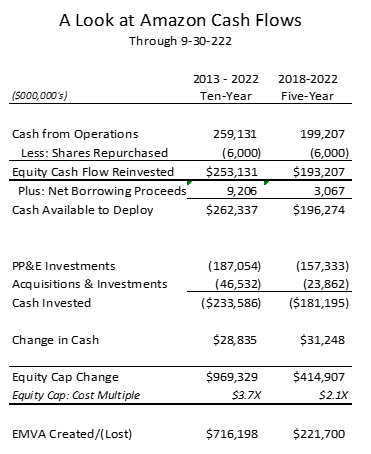
Over the recent ten years, AMZN reinvested over $250 billion into its business and was rewarded with a $969 billion change in equity capitalization, for a ratio of 3.7X.
Of note, this is less than the company’s overall ratio at the end of September of around 5X. As companies mature, their ability to create value tends to slow. Part of this is simply the denominator impact of working off a much larger base.
Over five years, AMZN results are a bit less. The company reinvested $196 billion into its operations, while its equity value rose by $414 billion. The multiple of equity value created lowered to 2.1X.
What happens if we use the company’s year-end 2022 share price? The ten- and five-year multiples would fall to 2.6X and .6X, respectively. For the recent five-year period, Amazon would have accomplished a first in its history, virtually lighting $74 Billion on fire and reducing EMVA by a like amount.
Added Earnings Growth Risks
The Value Equation can help you estimate the current, diluted after-tax rate of shareholder return. In the case of AMZN, it’s going to be in the area of 3%. Now, the expected total rates of return have become all about the growth.
In turning to the company’s growth prospects, the segment results for North America and International, where most of the sales reside, are not encouraging. The AMZN business model appears to need enhancements to get there. But there are other risks as well.
AWS Growth Risk
One risk is that the AWS business model begins to lose some of its luster. With average sales growth of 41% and operating profit growth more than three times that figure, it’s hard to imagine how this could be expected to last.
According to Synergy Research Group, cloud computing demand increased by 34% in the third quarter, making it the eleventh time in twelve quarters that the year-on-year growth rate has been in the 34-40% range. Amazon currently has the largest estimated market share of 33%.
However, such rapid sector and corporate growth cannot be expected to last. In addition, excess profits are rarely sustainable. Successes naturally breed imitators and elevated competition.
Synergy Research Group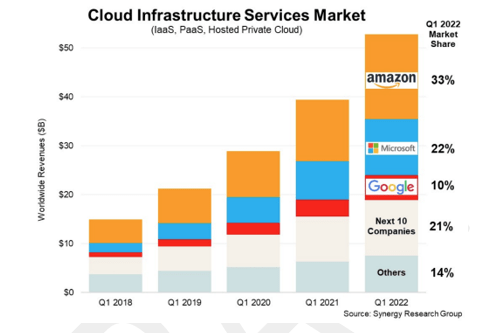
Litigation Risk
Large and powerful companies are like low-hanging fruit when it comes to litigation risk. Recently, California Attorney General Rob Bonta filed an anti-trust suit against AMZN alleging that the company is actually stifling price competition and using its market power to coerce third-party sellers into agreeing not to sell their products at a lower price elsewhere.
Indeed, the litigation sections of AMZN’s public filings are long and filled with similar types of legal action from plaintiffs and regulators across the globe. While AMZN universally notes such litigation to be meritless in its public disclosures, it is not hard to imagine some litigation eventually exacting material behavioral or monetary costs.
Recession Risk
While much of the consensus seems to point to a recession, with many believing we are already there, I tend to be less concerned when it comes to AMZN. My perspective on AMZN, just like my historic analysis, is for the long-term.
Conclusion
Where do I come out on Amazon’s sustained prospects for growth? Like the consumer that wonders how they make any money selling and shipping packages of modestly priced merchandise, I am skeptical about Amazon.com, Inc.
For the company to have sustained earnings growth that justifies its current share price and approximate 3% current after tax equity return, Amazon.com, Inc. will have to find a way to reverse operating margin slides in its North American and International segments.
AWS will have to remain as potent a segment as it has been. And the company will need to accomplish all this while not being distracted by increasing litigation having the potential to be material. These are strong challenges.
One should not overlook the operational complexity of AMZN in addressing its growth challenge. The company has added to its core business by making 115 corporate acquisitions since 1998, together with added stakes in more than 20 non-controlled investments.
With so many business lines, Amazon is a virtual conglomerate behemoth. Such complexity makes understanding AMZN much more difficult. I can only imagine what it must be like to run.
Further drops in Amazon share price in response to recessionary concerns would serve to make the shares more attractive. That said, I do not currently own Amazon.com, Inc. shares and, at the year-end 2022 price, given modest business model current shareholder returns, together with material risks to earnings and cash flow growth, I am still not a buyer.
Disclosure: I/we have no stock, option or similar derivative position in any of the companies mentioned, and no plans to initiate any such positions within the next 72 hours. I wrote this article myself, and it expresses my own opinions. I am not receiving compensation for it (other than from Seeking Alpha). I have no business relationship with any company whose stock is mentioned in this article.
Sign Up For A FREE 2-Week Trial
Join iREIT on Alpha today to get the most in-depth research that includes REITs, mREIT, Preferreds, BDCs, MLPs, ETFs, Builders, Asset Managers, and we added Prop Tech SPACs to the lineup.
We recently added an all-new Ratings Tracker called iREIT Buy Zone to help members screen for value. Nothing to lose with our FREE 2-week trial.

And this offer includes a 2-Week FREE TRIAL plus my FREE book.