
Summary:
- The Home Depot, Inc. reported full-year results last week, and Lowe’s Companies, Inc. presented its results just yesterday. Investors were spooked by the rather weak guidance, sending the stocks lower.
- The article discusses Home Depot’s and Lowe’s Companies’ performance in 2022 against the bigger picture of the last decade and the Great Recession.
- I explain the seemingly alarming rise in debt and put it into proper perspective. Both stocks remain solid dividend growth investments, but one is clearly better.
- Moreover, I outline my expectations for 2023 and beyond and show what returns shareholders can realistically expect.
gonin/iStock via Getty Images
Introduction
The last few days have not been easy for investors in The Home Depot, Inc. (NYSE:HD) and Lowe’s Companies, Inc. (NYSE:LOW). HD reported its full-year 2022 results last week, on February 21, 2023, while LOW just released its results yesterday. After a relief rally at the end of 2022, shares of the two major U.S. home improvement retailers are again approaching the lows reached last fall. Clearly, investors had expected better results and stronger guidance. As of March 1, 2023, HD and LOW are down 30% and 26% from their all-time highs, respectively.
I reported on HD stock back in August 2022 and warned that the market has been getting ahead of itself. I discussed my growing interest in LOW in a recent article, in which I pointed out why long-term dividend growth investors should not hope for the next roaring bull run and instead learn to appreciate a prolonged sideways or bear market.
Now that both companies’ fiscal 2022 earnings are on the table, let’s see how they performed and what can realistically be expected for 2023 and beyond. Besides a discussion of the oft-cited high leverage of the two companies, I will also provide a valuation update and outline my strategy with respect to somewhat cyclical stocks like HD or LOW.
Please note that for clarity, I have colored the charts related to The Home Depot in blue, while those reflecting data of Lowe’s are colored in red.
Home Depot And Lowe’s Performance In 2022, Expectations For 2023, And A Broader View Of The Past
The Home Depot Inc. and Lowe’s Companies Inc. are the two heavyweights in the U.S. home improvement market – with annual sales of nearly $160 billion, HD is about 60% larger than LOW (fiscal 2022 sales of $97 billion). The two companies manage some 40,000 stock-keeping units ((SKUs)), so it is hardly surprising that they were not spared the supply chain disruptions and inventory problems that occurred as a result of government-mandated measures to contain the spread of SARS-CoV-2 beginning in 2020.
As is widely known, both companies experienced spectacular fiscal 2020 and 2021, with HD’s sales growing 20% and 14%, respectively, while Lowe’s performance was somewhat front-loaded, with sales growth of 24% and 7% in fiscal 2020 and 2021, respectively. With rising interest rates, a deteriorating housing market, inflation pressuring consumers, and a likely recession, it’s hardly surprising that sales growth has stalled – in fiscal 2022, HD posted 4% growth, while Lowe’s posted less than 1% growth. Lowe’s also posted slightly weaker comparable sales growth numbers than The Home Depot.
For fiscal 2023, The Home Depot expects sales growth and comparable sales to be flat, while Lowe’s expects sales of only $88 billion to $90 billion, a decline of more than 8%, primarily due to the sale of its Canadian retail business (see below). On a comparable basis, sales are expected to be flat to down -2%, which is somewhat disappointing compared to HD. It might be that Lowe’s management is trying to be a bit more conservative than in the past, given its still much more significant exposure to retail customers. Over the last twelve years, Lowe’s occasionally reported negative earnings surprises (Figure 1), while HD generally surprised to the upside (Figure 2).
Figure 1: Lowe’s [LOW] annual earnings surprises in percent (obtained from Seeking Alpha) Figure 2: Home Depot’s [HD] annual earnings surprises in percent (obtained from Seeking Alpha)![Lowe’s [LOW] annual earnings surprises in percent](https://static.seekingalpha.com/uploads/2023/3/2/49694823-16777578821920192_origin.png)
![Home Depot’s [HD] annual earnings surprises in percent](https://static.seekingalpha.com/uploads/2023/3/2/49694823-16777578971752079_origin.png)
At the same time, it is fair to say that these figures largely reflect a normalization of the pandemic-related boom. In fact, against the backdrop of a weaker macroeconomic environment (particularly due to higher mortgage rates and inflation), I am quite positive about both companies’ forecasts. I believe HD and LOW will suffer similarly in a recession, probably best evidenced by their performance during the Great Recession. For fiscal 2008, HD management reported a 6.5% decline in net sales on a like-for-like basis (2007 had 53 weeks), while comparable store sales declined 8.7%. Comparable store sales at LOW declined 7.2% in 2008.
Looking at the more recent performance of the two companies, Lowe’s gross margin has been somewhat more volatile, but in the last two fiscal years they have been effectively tied, with HD having a negligible lead (Figure 3).
Figure 3: Comparison of Home Depot’s [HD] and Lowe’s Companies’ [LOW] gross margin (own work, based on the companies’ fiscal 2004 to fiscal 2021 10-Ks and the fiscal 2022 earnings press releases)![Comparison of Home Depot’s [HD] and Lowe’s Companies’ [LOW] gross margin](https://static.seekingalpha.com/uploads/2023/3/2/49694823-16777579979524004_origin.png)
It is the operating and free cash flow margins where the two companies differ. HD’s five-year average operating margin is about 14.5%, with a standard deviation of just 0.5%, while Lowe’s only converts about 9.5% of its sales into operating profits (five-year average). However, the company has been able to significantly increase its margins in recent years, after Marvin Ellison took the helm in 2018.
In fiscal 2022, Lowe’s saw gross margin decline by about 60 basis points, but that was more than offset by operating margin expansion (nearly 90 basis points), indicating very strong execution against the backdrop of a challenging environment. However, Lowe’s performance was outshined by the 140 basis point operating margin expansion reported by HD. However, I think it’s important not to extrapolate The Home Depot’s margin expansion as the company expects a 70+ basis point decline in fiscal 2023, while it’s fair to expect continued margin expansion from Lowe’s. The company has projected a midpoint of 13.7%, which tracks The Home Depot quite well. However, I want to emphasize that these lines should not be taken to mean that the two companies are maximizing profitability at all costs. HD announced that it will invest $1 billion in front-line employee compensation (which is the main driver of the margin decline mentioned above). LOW just reported that it awarded $70 million in voluntary bonuses to assistant store managers and supply chain supervisors and $150 million to eligible hourly employees in FQ4 2022.
HD also continues to outperform LOW in terms of free cash flow (normalized for working capital movements and adjusted for stock-based compensation expense). I consider the very reliable five-year average free cash flow (“FCF”) margin of 10.2% (standard deviation 0.4%) an excellent performance for a de facto middle-man’s business (Figure 4). Like operating margin, Lowe’s free cash flow margin has improved dramatically over the last five years and is now around 9% – the ongoing business transformation is clearly bearing fruit (Figure 5).
Figure 4: Home Depot’s free cash flow, normalized with respect to working capital movements and adjusted for stock-based compensation expense (own work, based on the company’s fiscal 2002 to fiscal 2022 10-Ks and the fiscal 2022 earnings press release) Figure 5: Lowe’s Companies’ [LOW] free cash flow, normalized with respect to working capital movements and adjusted for stock-based compensation expense (own work, based on the company’s fiscal 2002 to fiscal 2022 10-Ks and the fiscal 2022 earnings press release)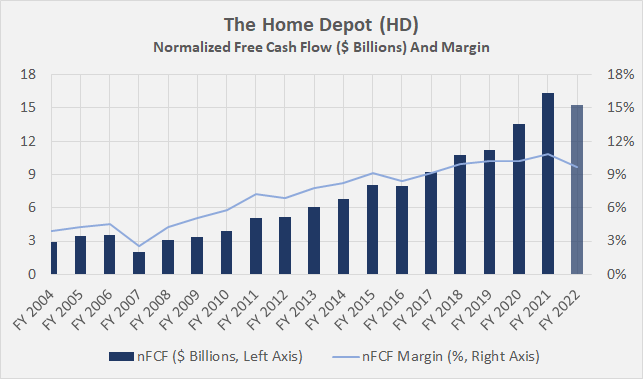
![Lowe’s Companies’ [LOW] free cash flow, normalized with respect to working capital movements and adjusted for stock-based compensation expense](https://static.seekingalpha.com/uploads/2023/3/2/49694823-16777580562447586_origin.png)
The strong margin profile is one of the reasons I prefer home improvement retailers over grocers and department stores like Walmart (WMT, see my recent update) or Target (TGT, see my comparative analysis with WMT). Of course, given the moderate cyclicality of home improvement retailers, their margins should be expected to contract in a recession. As an aside, Lowe’s margin decline in fiscal 2006 and subsequent “expansion” during the Great Financial Crisis – as shown in Figure 5 above – should not be misinterpreted. The company was aggressively expanding its store presence at the time, like The Home Depot, which was ahead in that race (Figure 6). While Lowe’s continued to report higher capital expenditures over most of the last decade, both came in below 20% of normalized operating cash flow beginning fiscal 2020. These are remarkably low percentages for retail companies. It should be remembered that both companies own the majority of their stores (89% and 84% at the end of fiscal 2021 for HD and LOW, respectively).
Figure 6: Comparison of Home Depot’s [HD] and Lowe’s Companies’ [LOW] capex ratio, calculated by dividing annual capital expenditures by operating cash flow, which has been adjusted with respect to working capital movements and stock-based compensation expense (own work, based on the companies’ fiscal 2004 to fiscal 2021 10-Ks and the fiscal 2022 earnings press releases)![Comparison of Home Depot’s [HD] and Lowe’s Companies’ [LOW] capex ratio, calculated by dividing annual capital expenditures by operating cash flow, which has been adjusted with respect to working capital movements and stock-based compensation expense](https://static.seekingalpha.com/uploads/2023/3/2/49694823-16777580912911522_origin.png)
Although Lowe’s Companies is still less profitable than The Home Depot, the latter’s relatively smaller store base should be considered. At the end of fiscal 2021, HD operated 20% more stores than Lowe’s, but generated 60% more sales. This suggests that there is still significant margin expansion to be expected as Lowe’s grows its professional segment (16% growth for the full year and 10% growth in the fourth quarter) and continues to reduce complexity.
In this context, it is worth noting that Lowe’s continues to focus on the transformation of its U.S. business and has completed the sale of its 200+ stores in Canada to private equity firm Sycamore Partners in Q4 2022. The transaction will contribute to further margin expansion and reduce complexity, including from an accounting and currency hedging perspective. In my opinion, this is an important step on the way to catching up with The Home Depot, which itself continues to operate in Canada (and Mexico). However, I would have preferred to see the transaction close a year earlier, as financing terms haven’t exactly gotten easier and the $400 million proceeds (plus certain performance-based deferred consideration) seem surprisingly low to me. This suggests that the Canadian stores were not exactly highly profitable, and it also seems worth noting that Lowe’s will record an impairment charge of about $2 billion after the transaction closes.
What To Make Of The Debt Piles And What Can HD And LOW Shareholders Expect Going Forward?
While I can’t predict the future, of course, I think it’s prudent to at least entertain the idea that the major indexes might stay rangebound for the foreseeable future due to stagflation. With that in mind, I take great comfort in owning dividend stocks with solid balance sheets and low payout ratios. However, HD and LOW are often cited as being excessively leveraged. But, is there any truth to these statements?
While it’s easy to discount HD and LOW’s balance sheets because of their low equity ratios – LOW even reported a shareholders’ deficit at the end of fiscal 2022 – debt should be viewed in the context of free cash flow. Debt can ultimately only be repaid and serviced through organic cash flow. At the end of fiscal 2022, HD and LOW reported net debt (excluding operating leases) of $40.4 billion and $32.2 billion, respectively. While these are serious numbers, due in large part to somewhat aggressive share repurchases (Figure 7 and Figure 8), they represent leverage ratios of 2.7 and 3.8 times net debt to three-year average normalized free cash flow, respectively.
Figure 7: Share repurchases of The Home Depot [HD] versus the daily closing share price of HD stock (own work, based on the company’s fiscal 2004 to fiscal 2021 10-Ks and the fiscal 2022 earnings press release) Figure 8: Share repurchases of Lowe’s Companies [LOW] versus the daily closing share price of LOW stock (own work, based on the company’s fiscal 2004 to fiscal 2021 10-Ks and the fiscal 2022 earnings press release)![Share repurchases of The Home Depot [HD] versus the daily closing share price of HD stock](https://static.seekingalpha.com/uploads/2023/3/2/49694823-16777607949677072_origin.png)
![Share repurchases of Lowe's Companies [LOW] versus the daily closing share price of LOW stock](https://static.seekingalpha.com/uploads/2023/3/2/49694823-16777609637123733_origin.png)
I have already discussed HD’s debt service ability in detail in another article published in December 2022. In short, I do not consider HD’s debt to be a concern, even in the event of a recession. While large companies typically refinance their debt as it matures, HD currently generates so much free cash flow that it could theoretically pay down its debt as it matures, assuming it suspended share repurchases. It should be noted that in such a hypothetical scenario, the company could even continue to pay its (growing) dividend.
At first glance, things don’t look so good for Lowe’s due to its significantly higher leverage ratio. However, if one analyzes the company’s upcoming maturities in a manner similar to The Home Depot, the debt no longer looks worrisome (Figure 9). Like HD, LOW could theoretically pay down its debt as it matures and continue to pay a (growing) dividend if it maintains annual free cash flow of $8 billion to $9 billion per year and suspends share repurchases. Note that Lowe’s has not yet released its 10-K for fiscal 2022. Therefore, I took the upcoming debt maturities from the fiscal 2021 10-K filing (p. 56) and included the debt assumed in 2022 according to the company’s third-quarter 2022 10-Q filing (p. 11).
Figure 9: Lowe’s Companies’ [LOW] after-dividend free cash flow and debt maturity profile (Own work, based on the company’s fiscal 2021 10-K, the FQ3 2022 10-Q and own estimates)![Lowe’s Companies’ [LOW] after-dividend free cash flow and debt maturity profile](https://static.seekingalpha.com/uploads/2023/3/2/49694823-16777581517707934_origin.png)
Over the last three years, HD paid out about 47% of its normalized free cash flow via dividends, while Lowe’s paid out only about 24%. Therefore, it’s easy to see that even in a period of stagflation, both companies will likely continue to increase their dividends. Granted, they will suspend their share buybacks and focus on deleveraging, but I think both stocks continue to be very good dividend growth investments, even in a temporarily unfavorable environment. HD’s recent announcement of a 10% dividend increase is a clear indication of continued strong business performance and management confidence in the company. Lowe’s did not announce a dividend increase yesterday, but that was to be expected – the company is a quarter behind HD, and I expect it to announce a dividend increase in late May 2023.
Finally – consider this example: If both companies continue to grow their dividends at a rate of 10% each year – assuming zero free cash flow growth – HD’s payout ratio would reach 75% in 2026, when the yield on cost (if the stock is bought today) already surpasses the current yield on 30-year Treasuries. LOW investors would need to wait another two years, but its payout ratio would still be considerably more manageable at only around 50% of free cash flow.
So while I’m not surprised if we experience an extended period of poor equity performance, I take great comfort in having home improvement companies like LOW and HD in my diversified portfolio. I’ve learned to appreciate such periods because they amplify the power of compound interest. Clearly, I would rather reinvest my dividends at current valuations than in a market where stocks are hitting new highs on a regular basis.
A Brief Valuation Update On HD And LOW Stocks
From an adjusted operating earnings perspective, HD stock still appears somewhat overvalued (Figure 19), while LOW is a good value, as shown by the blended price/earnings ratio of currently around 14 (Figure 11). Investors are – somewhat understandably – paying a premium for the market leader with its higher profitability and slightly better credit rating of A2 with a stable outlook (Moody’s), compared to Baa1 (stable outlook) for Lowe’s. While the company’s transformation efforts are clearly bearing fruit and the Pro segment continues to post healthy growth, there is still room for improvement. At the same time, it is important to remember that Lowe’s is already on par with The Home Depot in terms of cash return on invested capital (CROIC) – both regularly generate a cash return of over 30% on their invested capital.
Figure 10: FAST Graphs chart of The Home Depot [HD] stock (obtained with permission from www.fastgraphs.com) Figure 11: FAST Graphs chart of Lowe’s Companies [LOW] stock (obtained with permission from www.fastgraphs.com)![FAST Graphs chart of The Home Depot [HD] stock](https://static.seekingalpha.com/uploads/2023/3/2/49694823-1677762829399699_origin.png)
![FAST Graphs chart of Lowe’s Companies [LOW] stock](https://static.seekingalpha.com/uploads/2023/3/2/49694823-16777628972982738_origin.png)
An even larger valuation gap results if we value the two stocks from a normalized free cash flow perspective (Figure 12). I think an 8% cost of equity for HD is a reasonable expectation, as is a one percentage point premium in the case of LOW due to the modest uncertainty. From this perspective, Lowe’s stock is almost fairly valued if we assume the company is able to grow its normalized free cash flow by 2% over time. Against this backdrop, HD stock would be overvalued by about 25%. Granted, HD might be able to grow its FCF faster, but given the more pronounced headroom for margin expansion at LOW, I would view a 3% growth rate for the smaller company as more realistic, suggesting the shares are slightly undervalued at $190.
Figure 12: Discounted cash flow sensitivity analyses for The Home Depot [HD] stock and Lowe’s Companies [LOW] stock (own work)![Discounted cash flow sensitivity analyses for The Home Depot [HD] stock and Lowe’s Companies [LOW] stock](https://static.seekingalpha.com/uploads/2023/3/2/49694823-16777621012691083_origin.png)
Conclusion
The renewed selling pressure on The Home Depot, Inc. and Lowe’s Companies, Inc. shares is largely due to somewhat muted forecasts due to a normalization of the pandemic-related trend and a somewhat deteriorating macroeconomic environment, as well as a temporary decline in margins, largely due to investments employee compensation.
In my opinion, both companies performed well – especially against the backdrop of a challenging environment. While it is obvious that neither stock is priced for a recession, I think one should also consider management’s confidence in the businesses. HD and LOW are very well positioned, are making the right investments and are highly profitable. Lowe’s Companies still has room to catch up to The Home Depot, but the performance improvements since Marvin Ellison took the helm in 2018 are clearly visible. Both are great dividend growth stocks, although I think LOW has more room for growth due to its much lower payout ratio, but of course, keep an eye on its weaker credit rating and refinancing rates for the bonds priced in 2022 (weighted average of 4.6%, $9.75 billion principal).
I bought my first Lowe’s Companies, Inc. shares earlier this year and own a still very modest position in HD, of about 0.8% of my total portfolio value. I would feel comfortable investing 1.5% of my portfolio value in each HD and LOW. As I discussed in another article around New Year’s, I will carefully add to my The Home Depot, Inc. position depending on the share price performance this year, while recognizing that the stock is still somewhat expensive. I took a less negative view of yesterday’s LOW earnings announcement than the market and believe the valuation is already quite attractive, so I will take the opportunity to add to my position. However, knowing that further deterioration in the economic environment would certainly put pressure on these moderately cyclical stocks, I am not an aggressive buyer for the rest of 2023 – assuming, of course, that valuations do not decline materially.
Thank you very much for taking the time to read my article. Do you agree or disagree with my conclusions? I’d appreciate your thoughts in the comments section below – Also, if there is anything you’d like me to improve or expand upon in future articles. In any case, please consult with a registered and experienced investment advisor before making or arranging any trades.
Disclosure: I/we have a beneficial long position in the shares of HD, LOW either through stock ownership, options, or other derivatives. I wrote this article myself, and it expresses my own opinions. I am not receiving compensation for it (other than from Seeking Alpha). I have no business relationship with any company whose stock is mentioned in this article.
Additional disclosure: The contents of this article and my comments are for informational purposes only and may not be considered investment and/or tax advice. I am neither a licensed investment advisor nor a licensed tax advisor. Furthermore, I am not an expert on taxes and related laws – neither in relation to the U.S. nor other geographies/jurisdictions. It is not my intention to give financial and/or tax advice and I am in no way qualified to do so. I cannot be held responsible and accept no liability whatsoever for any errors, omissions, or for consequences resulting from the enclosed information. The writing reflects my personal opinion at the time of writing. If you intend to invest in the stocks or other investment vehicles mentioned in this article – or in any form of investment vehicle generally – please consult your licensed investment advisor. If uncertain about tax-related implications, please consult your licensed tax advisor.