
Summary:
- JPMorgan Chase & Co is an extremely powerful, consistent and successful financial institution.
- Its leadership shows across a range of effective financial franchises.
- The company has a wide moat built from cost advantages and switching cost leverage, intelligent capital expenditures and technical efficiency.
- The financial sector is poised to benefit from the current environment featuring rising interest rates, with JPMorgan a likely winner.
- I see JPMorgan as a Strong Buy for a diversified investment portfolio.
olaser
Introduction
JP Morgan Chase (NYSE:JPM) is the most dominant corporate financial institution in the United States by most accounts. It owns multiple successful banking franchises, and sits near the top of the heap compared to peers:
“JPMorgan Chase & Co. is an American multinational investment bank and financial services holding company headquartered in New York City and incorporated in Delaware. As of 2022, JPMorgan Chase is the largest bank in the United States, the world’s largest bank by market capitalization, and the fifth largest bank in the world in terms of total assets, with total assets of US$3.954 trillion. Additionally, JPMorgan Chase is ranked 24th on the Fortune 500 list of the largest United States corporations by total revenue.”
“The J.P. Morgan brand is used by the investment banking, asset management, private banking, private wealth management, commercial banking, and treasury services divisions. Fiduciary activity within private banking and private wealth management is done under the aegis of JPMorgan Chase Bank, N.A.-the actual trustee. The Chase brand is used for credit card services in the United States and Canada, and the bank’s retail banking activities in the United States and United Kingdom.”
JPM’s multiple franchises include:
- Investment banking
- Commercial banking
- Credit card services
- Retail banking
- Asset/Wealth Management
JPM’s combination of size, diversification and strategic risk management give it a competitive advantage. The cohesion with which it has fit these pieces together sets it apart.
The JP Morgan Business Case
The business case for JP Morgan is built upon several integrated factors:
- JPM maintains and grows an integrated set of financial franchises;
- Its ability to operate powerful product lines in tandem provides it enormous scope and scale;
- Efficient operation of these large-scale franchises translates to large profits and greater revenue per asset than its competitors;
- A large, scalable technology budget supports both operations and organic expansion.
Factors of franchise diversity, scale and technology weigh heavily in the banking sector. JPM’s competitors have not achieved its level of efficient integration of business lines. They will continue to lag JPMorgan because of its power and momentum, and the difficulty of scaling efficiently to JPMorgan’s levels.
Powerful Multiple Franchises
The weight and power of JP Morgan within and beyond US borders can be seen in different ways:
Within the US, JPM enjoys unparalleled scope and scale. It is the nation’s largest bank, and leads the payments category thanks to its status as the largest US credit card issuer.
Its investment bank is the leading global generator of client fees, and its FICC trading desk is also a key global player. JPM also has the top national commercial banking platform franchise and asset and wealth management operations.
Scale and Scope: Tools for an Expansion Cycle
Large banks must cope with the reality of multiple investment phases, or cycles, in order to generate future market share gains. JPMorgan is positioned at the start of a new expansion cycle that will naturally increase current expenses and dig into profits short-term. JPMorgan has proven the willingness to spend to grow, and also leverages newer franchises such as payment verticals or international retail towards this growth. Product growth during the expanding business cycle is likely to return those costs and then some.
The Bull Case
The JPM bull case springs from the business case and its solid foundations. It can be condensed to several key points:
- JP Morgan’s dominance and leading position in multiple banking/financial services segments is excellent leverage going forward;
- Higher interest rates and more stringent requirements for companies to borrow money is a positive for the entire banking sector. JPM, with its sizable customer base and diverse franchises, should be able to drive revenue and profitability across the board;
- Capital expenditures, organic expansion and proprietary distribution platforms help consolidate its healthy competitive position and the further addition of market share.
The JPM Moat
JP Morgan’s moat is wide and strong. The company features major positive attributes in two areas that are critical for large financial institutions: cost advantages and switching costs.
As a very large pool of customers performs the same transactions repetitively, the costs of supporting them are multiplied. JPM’s ability to replicate a structure built on relatively low costs across franchises and over time is a powerful element.
Having a dominant distribution of products and owning multiple franchises is implicitly and explicitly cost-advantageous. JP Morgan’s franchise breadth includes:
- Investment banking
- Credit/debit card issuance
- Merchant acquisition
- FICC products trading globally
- Global custodianship
- Commercial banking, and
- Global asset management of over $3 trillion.
JP Morgan’s size offers enormous advantage of scale and considerable fixed cost possibilities as in platform businesses. Its product breadth makes for true economies of scale.
The second key moat factor, switching costs, is directly related to franchise diversity and breadth. A definition of the term:
“Switching costs are the costs that a consumer incurs as a result of changing brands, suppliers, or products. Although most prevalent switching costs are monetary…there are also psychological, effort-based, and time-based switching costs.”
The financial impact of a change is the customer’s first consideration, but factors of emotion, effort and time also count. It also plays directly into customer satisfaction levels. How does JP Morgan perform in this regard? This survey from 2021 captures customer perceptions of major banks:
Customer Satisfaction Survey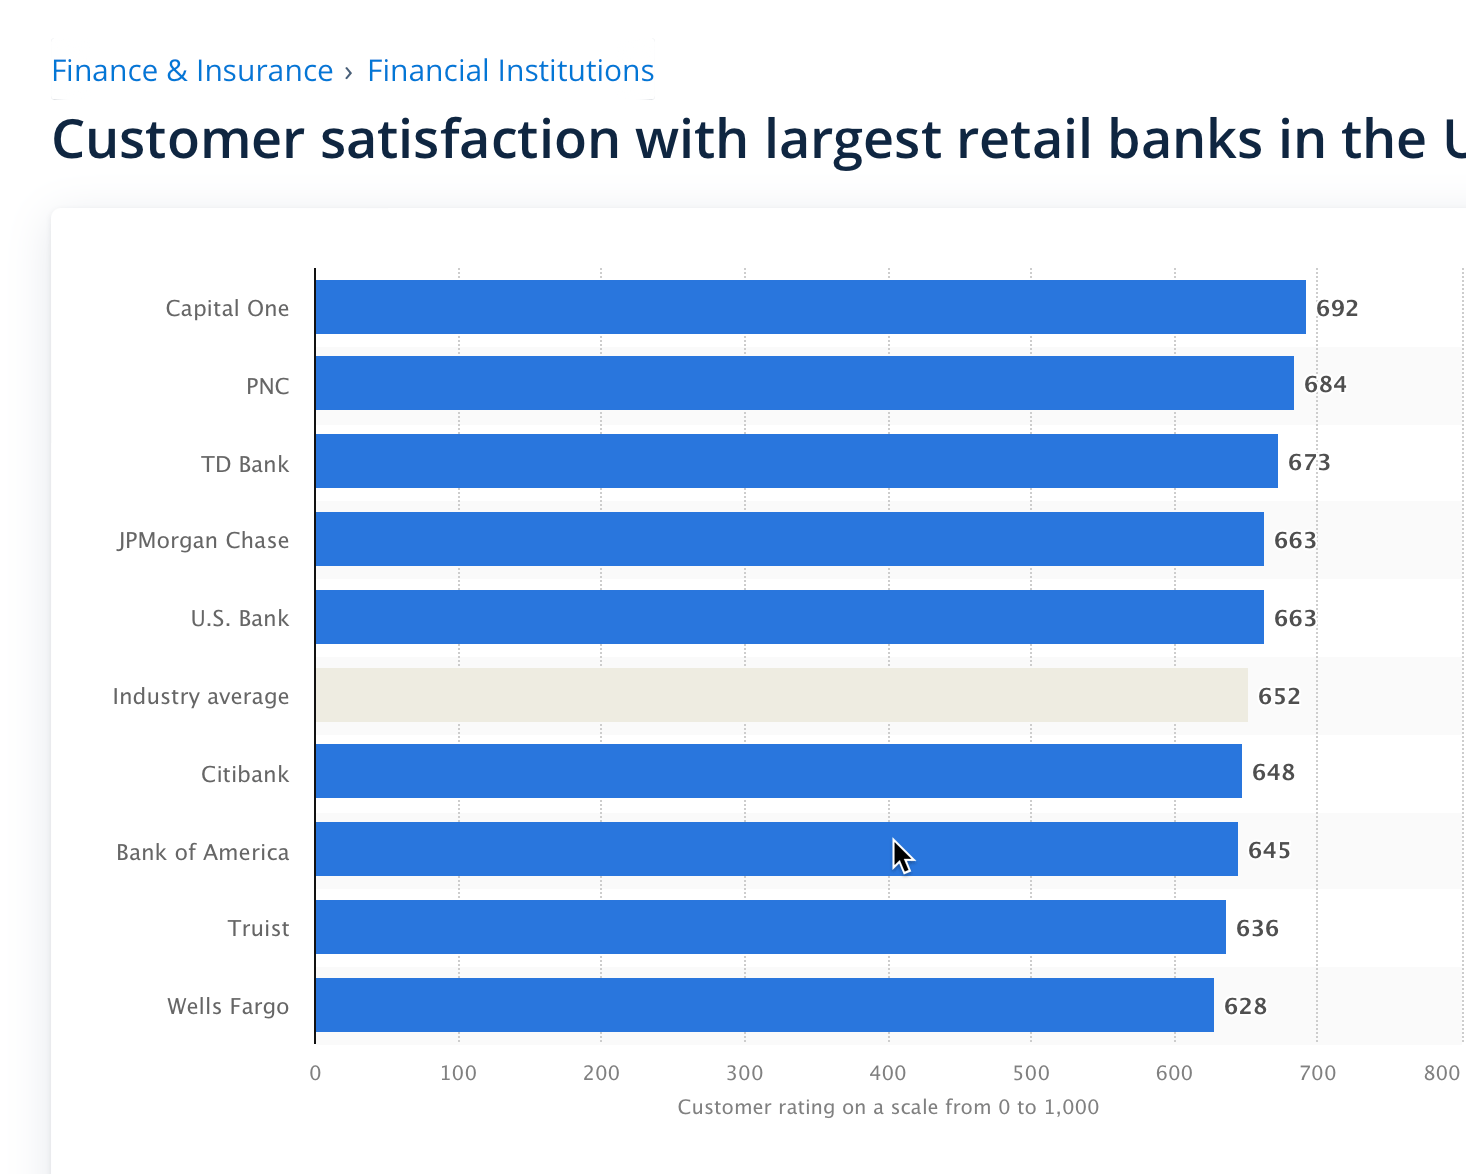
JPM’s customer satisfaction rank is reasonable, not exceptional. Still, customer satisfaction and customer retention are not identical.
JP Morgan Metrics: Financials, Valuation, Operating Performance, Dividends
Any company’s financial situation is a crucial factor in evaluating a potential investment. While this is true for any public company, the financials of banking institutions may be open to greater scrutiny.
Financial institutions’ metrics also have followed unique characteristics. Thus, Price/Earnings ratios for banks – especially large institutions – will be lower than those for companies in additional sectors.
Let’s break the financials down into their three natural divisions – income, balance sheet and cash flow. I use Morningstar’s JP Morgan work for these and most metrics presented.
Income Statement
JPM Financials (Morningstar)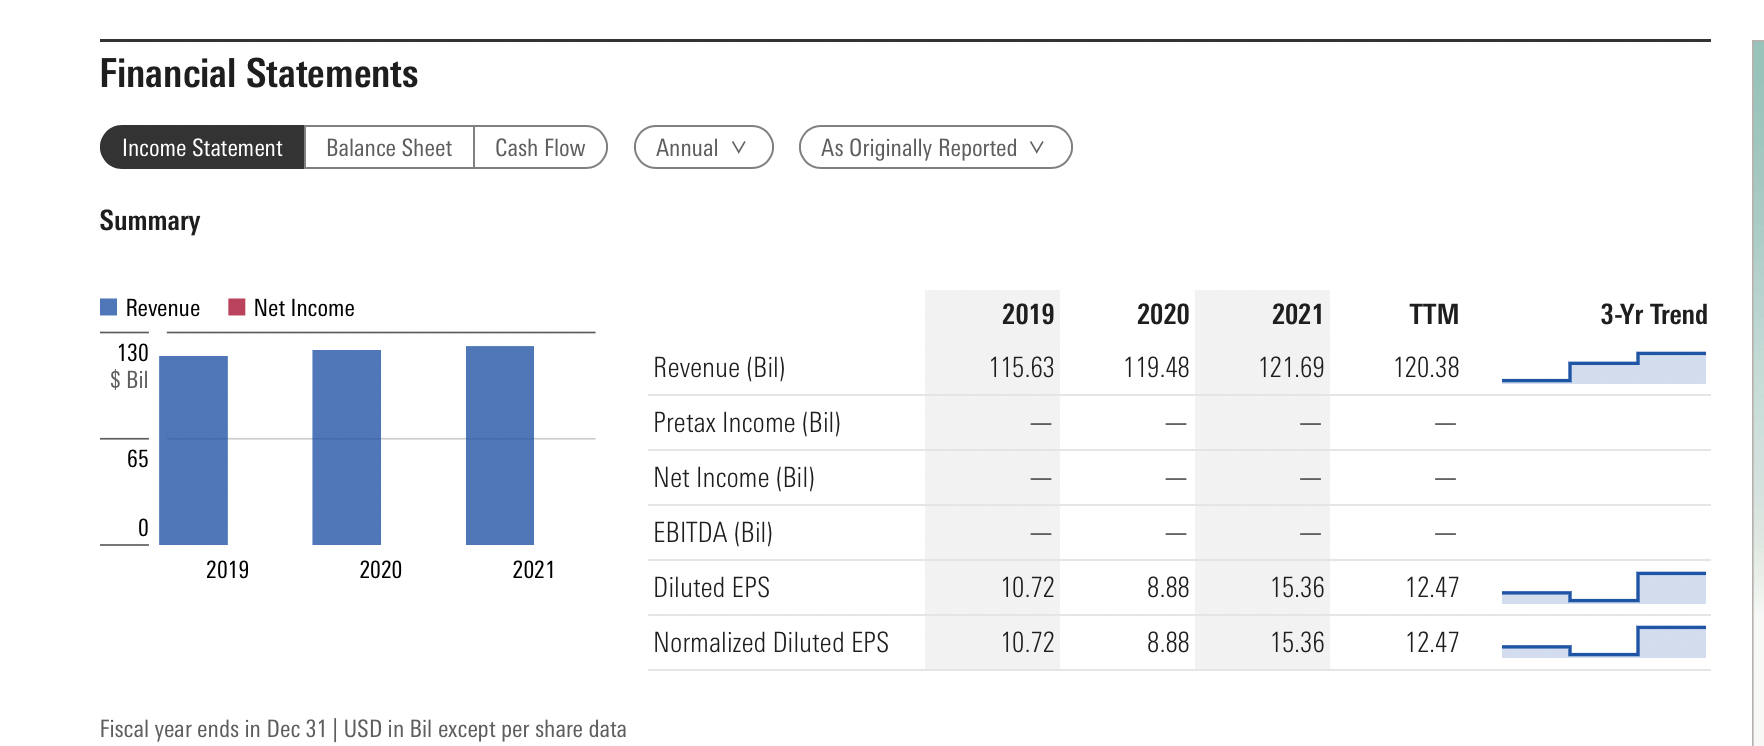
A look at the income statement reveals a slight jump from 2020 to 2021. The TTM (Trailing Twelve Months) figure for 2022 is not representative of full 2022 results, but its value is in neutralizing effects of seasonality and in diluting non-recurring abnormalities in financial results – such as temporary changes in demand, expenses, or cash flow.
Except for an unsurprising drop in the ‘Covid’ year of 202, diluted EPS (earnings per share) has risen from 2019. Again, 2022 EPS is TTM and actual EPS for the year will be known after the Q4 report.
Note: Diluted EPS is a calculation used to gauge company earnings per share (EPS) if all convertible securities were exercised (convertible preferred shares, convertible debentures, stock options, and warrants). Diluted EPS is typically lower than the simple or basic EPS.
Normalized diluted EPS is calculated by dividing a company’s profit less its one-time earnings, by both outstanding common stock and potential shares outstanding.
Balance Sheet
Morningstar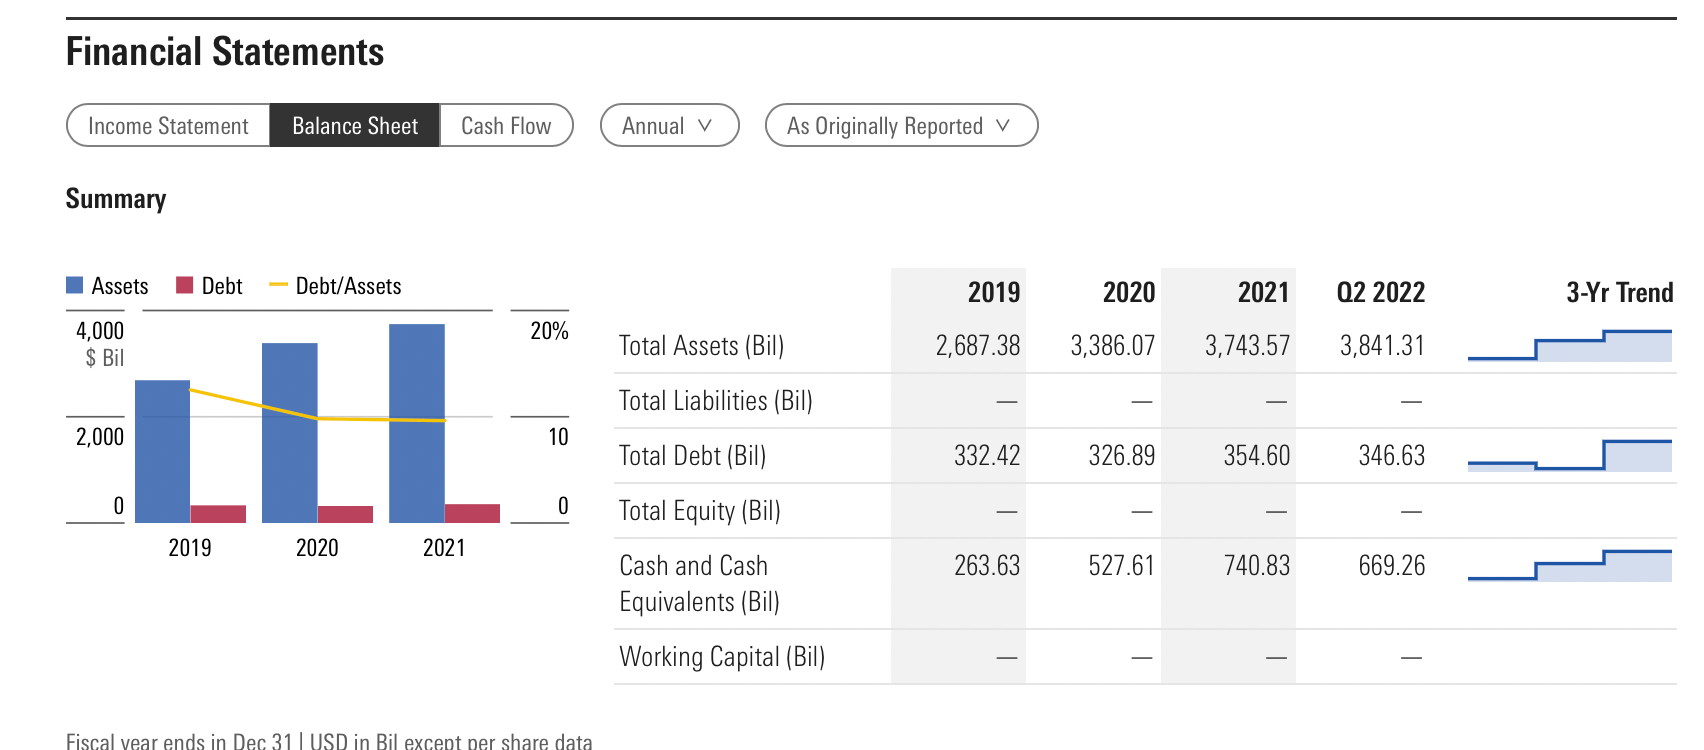
The JP Morgan balance sheet looks very healthy, even strengthening during 2020 and continuing to indicate positively today. Total debt has remained fairly steady since 2019, though it is ticking up slightly. The cash pile is growing at a strong clip.
Cash Flow
Morningstar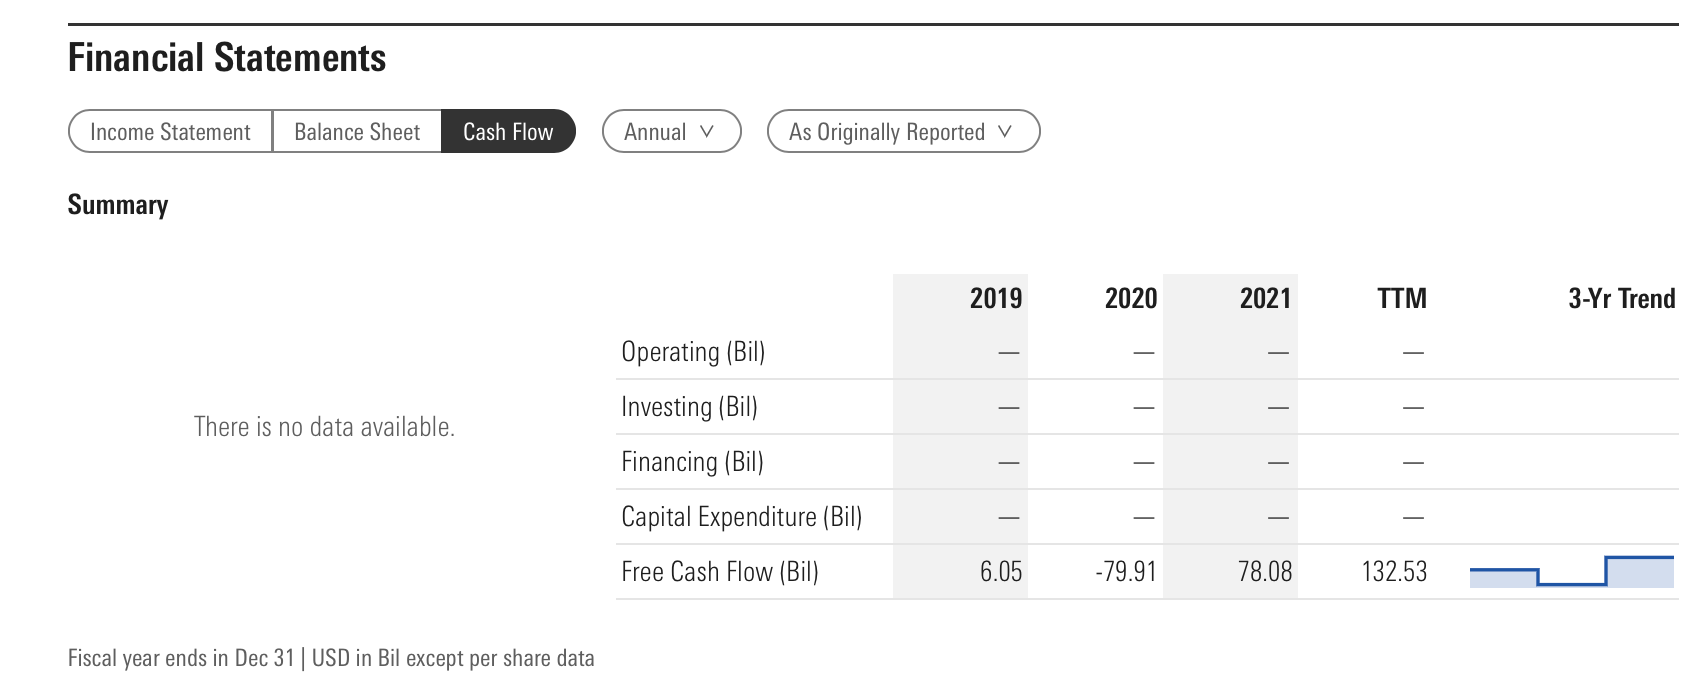
Cash flow is showing vast improvement. Following a sharp downtown in 2020 and negative cash for that year, it has rebounded in an extremely impressive way, achieving a level of $78 billion in 2021 and poised to pass that in 2022, with a TTM reading of 132.5 billion dollars.
Cash flow is an indicator of company performance, suggesting what may be returned to investors as potential share buybacks or dividend increases. JP Morgan’s enormous cash flow is also a resource for capital expenditure to expand existing franchises or to create new product lines.
Valuation
Valuation metrics are also quite positive overall. I go over each individually.
JPM Valuation Chart (Morningstar)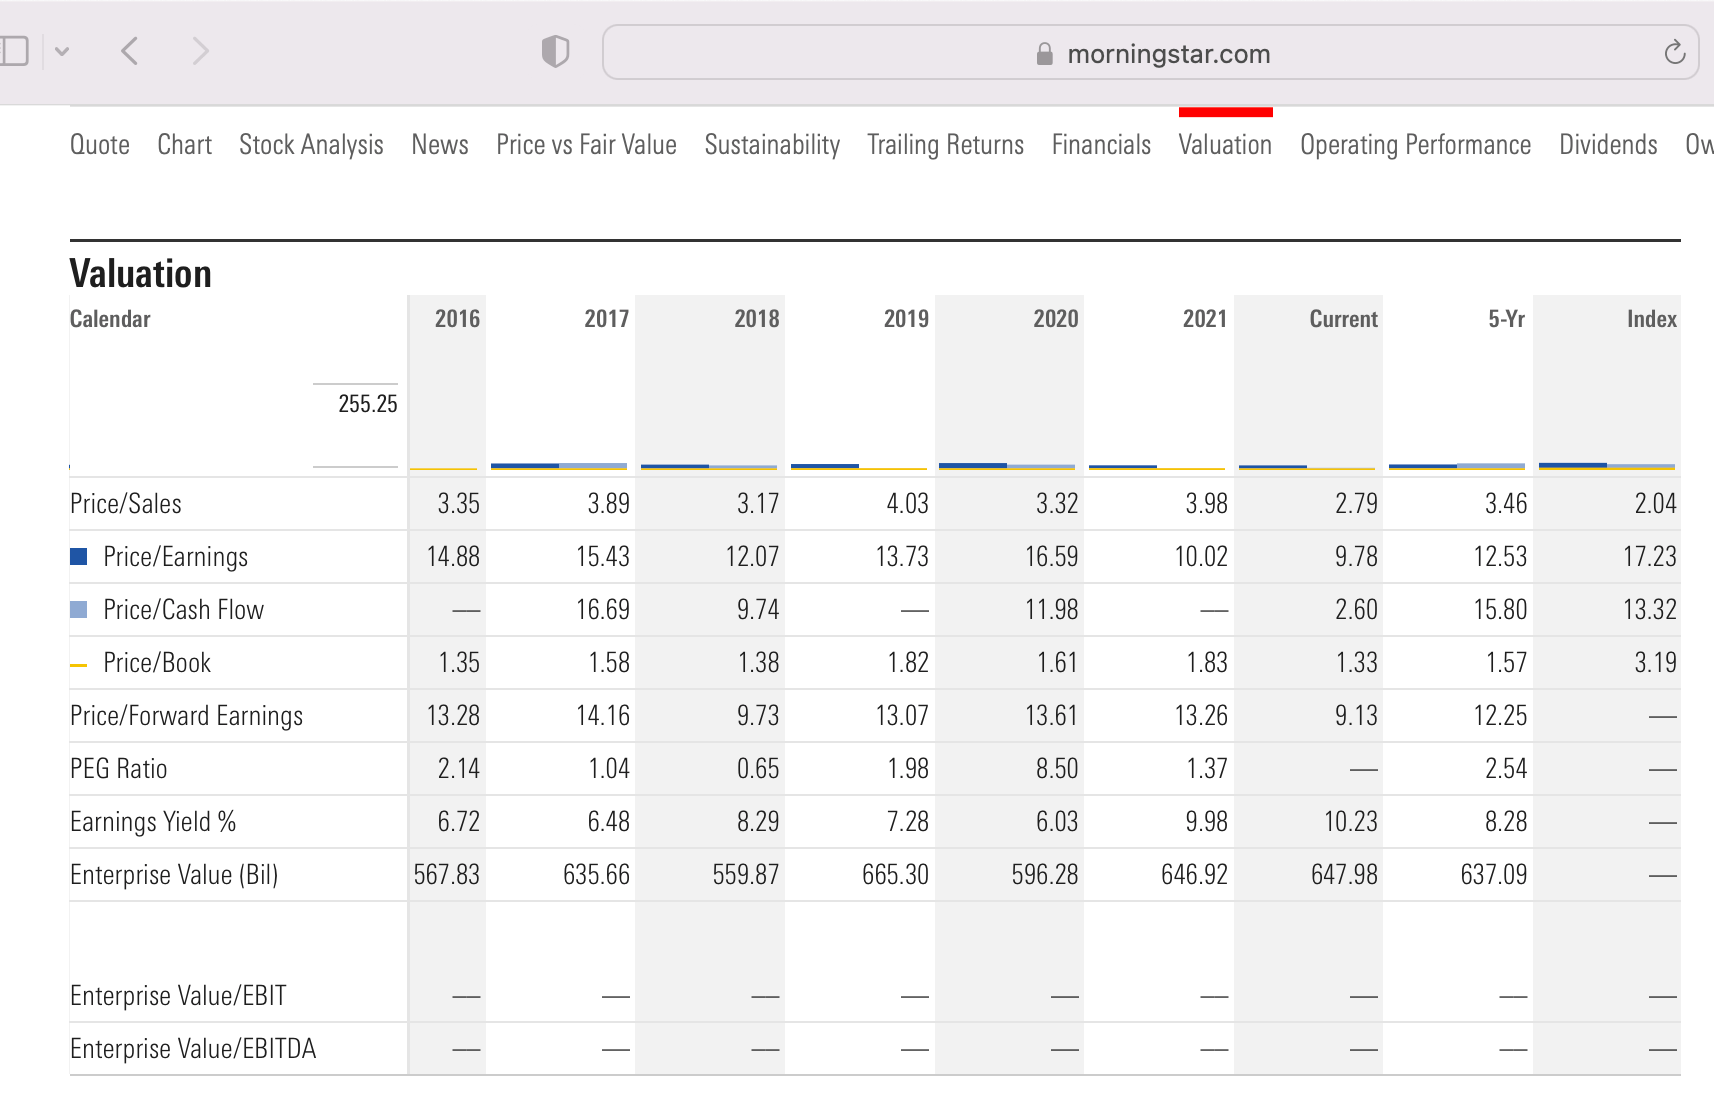
Key JP Morgan five-year valuation metrics include:
- Price/Sales: Price/sales ratios have varied since 2017, with the current reading of 2.79 well below the 2021 number. A very low, positive number.
- Price/Earnings: This key ratio is, at 9.78, slightly lower than last year’s reading and significantly below the JP Morgan five-year average reading of 12.53.
- Price/Cash Flow: This is also positive, sitting at a 2.6 ratio versus a five-year figure of 15.80. Given the priority of cash flow to large players, it suggests a potentially large share price upside from current levels.
- Price/Book: This number is 1.37, down from 1.83 for 2021 and below the 1.57 five-year number.
- Price/Forward Earnings: The 9.27 ratio is solid and below the five-year average of 12.25.
- PEG Ratio: The price-to-earnings growth ratio is not displayed for 2022. 2021’s number was 1.37. Given the decline in price, a good guess as the ratio at well below the ‘breakeven’ figure of 2 commonly assigned to PEGs.
- Earnings Yield: The current yield of 9.97% is in line with 2021 and solidly above the five-year average of 8.28.
- Enterprise Value (BIL): $656 billion dollars is up slightly since last year and is moderately above the five-year reading of 637 billion.
Operating Performance
JPM Operating Performance (Morningstar)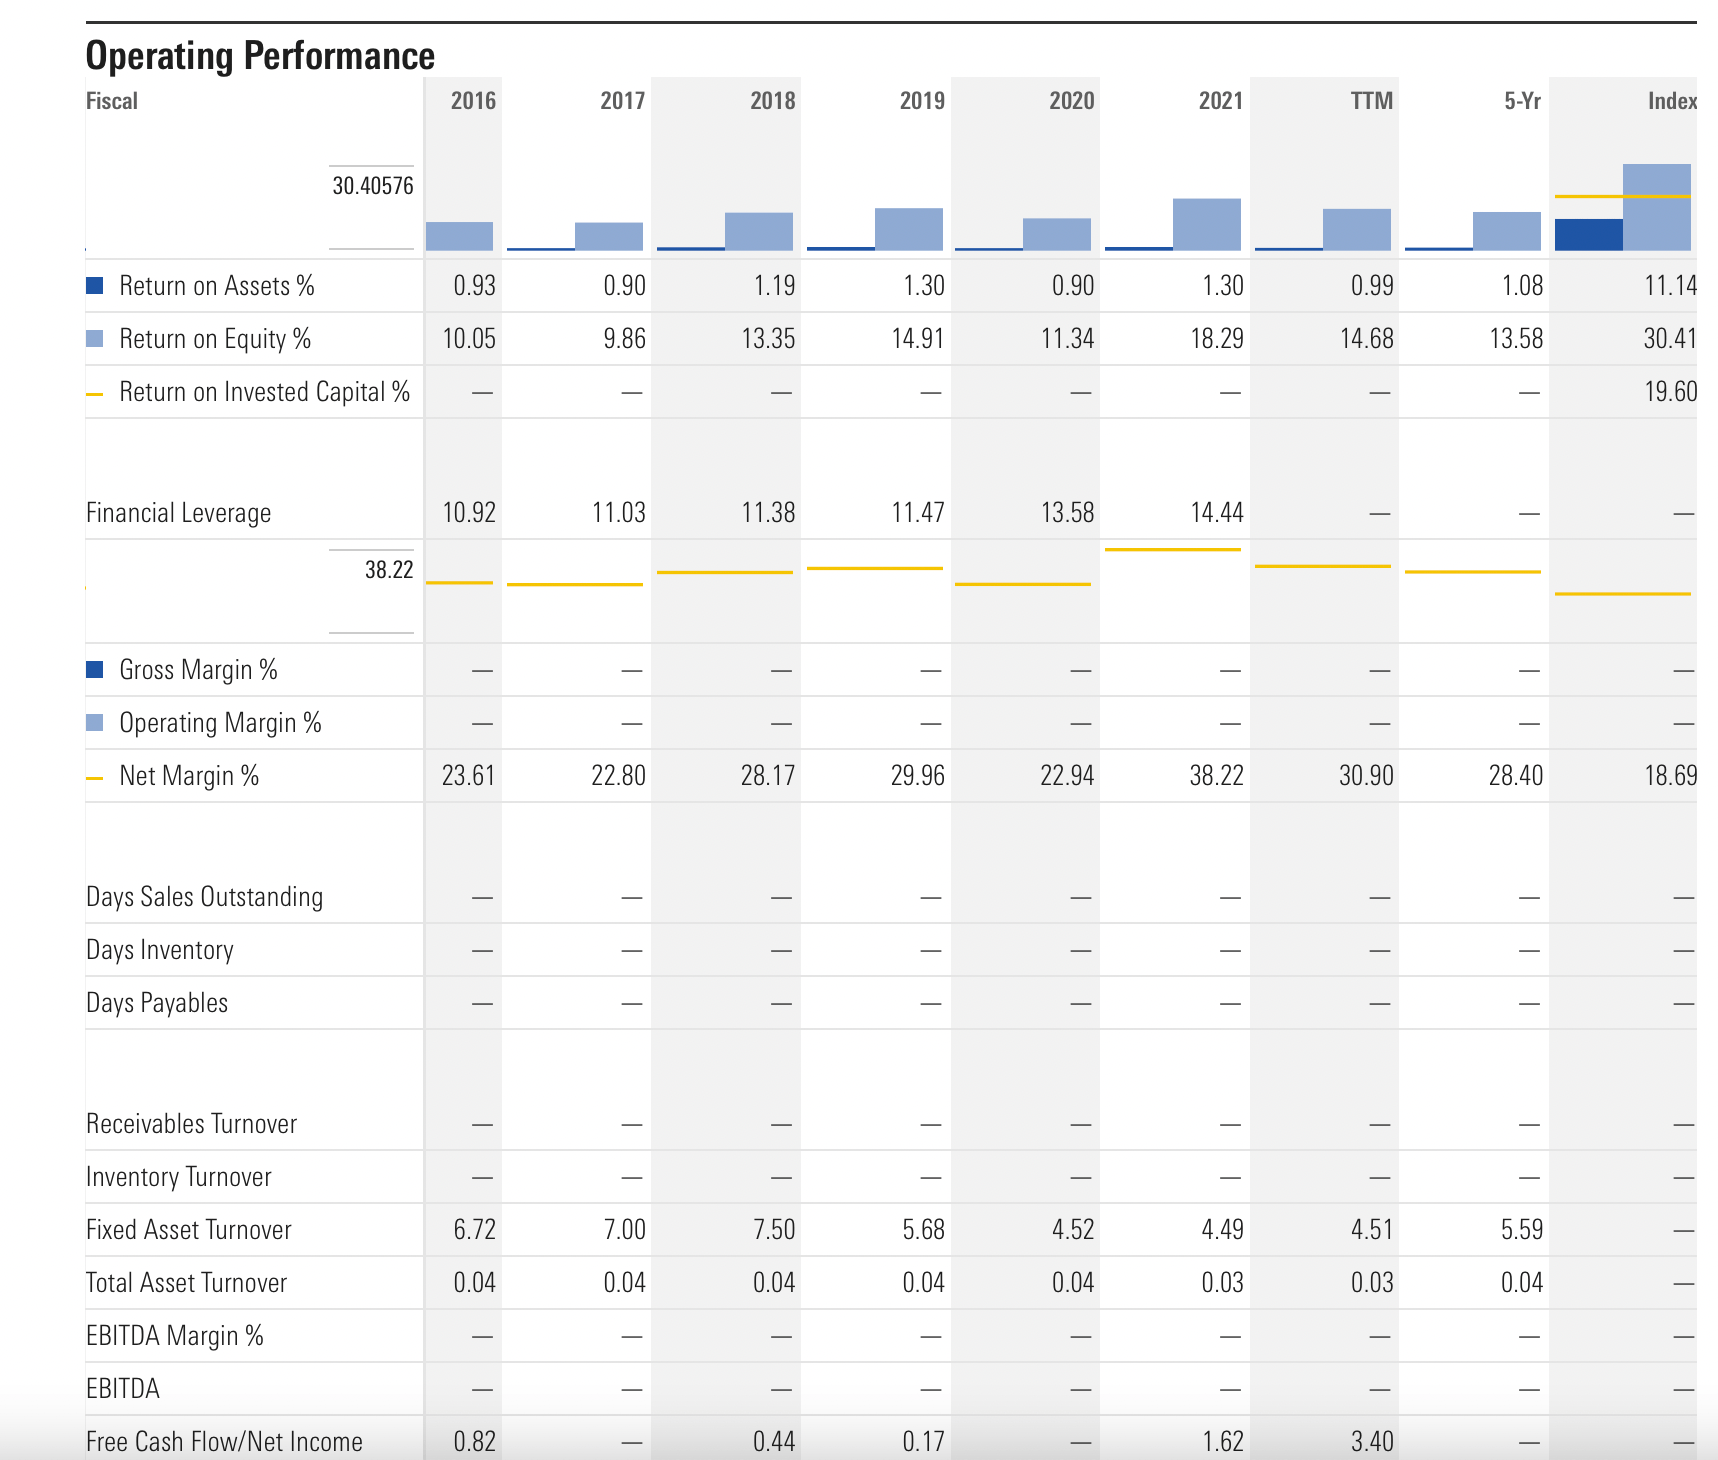
Operating performance metrics for JPM include:
- Return on Assets: The TTM reading for 2022 is just under 1%, low on the face of things but close to the five-year of 1.08.
- Return on Equity: With a TTM of 14.68%, a bit better than the five-year reading of 13.58.
- Financial Leverage: There is a readout through 2021 – 14.44% – but none for 2022. Leverage has increased fairly consistently over the past five years.
- Net Margin: The TTM 2022 metric is 30.90. The 2021 number was 38.22 while the five-year is at 28.40. If the full year shows a similar result to Net Margin/TTM, it is a solid figure.
Note: A search on Yahoo Finance reveals approximately the same limited operating performance data set for JPM.
Dividends
Dividend Policy (Morningstar)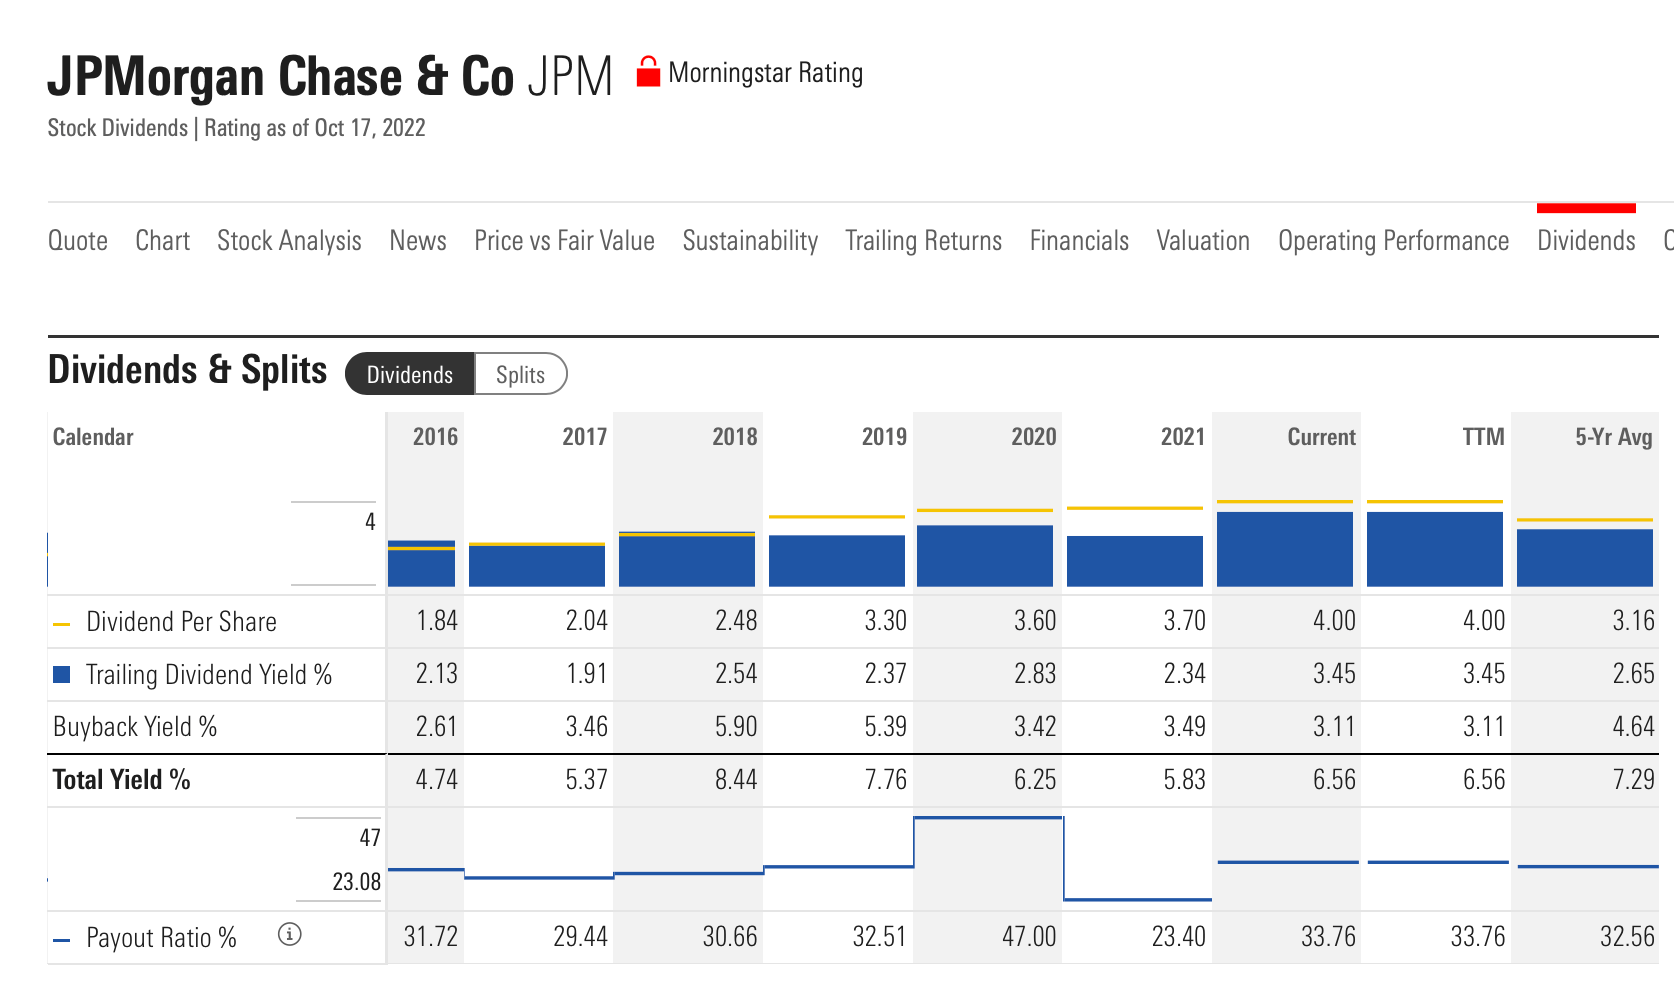
JPM has been relatively generous with dividends policy. Dividends per share have increased steadily, including in the 2020 pandemic year. The current yearly dividend is 4.00.
Dividend yield has fluctuated, dropping in 2021 but increasing dramatically this year thanks to share price declines. Buyback yield % is 3.11, down from a high of 5.90 in 2019. The five-year average is 4.84.
Total yield on a TTM basis for 2022 is up to 6.56 from 5.83 last year, but is below the five-year percentage of 7.29.
Dividends performance and increases policy have been favorable to investors – not earth-shattering but solid enough to serve as encouragement for a JPM share purchase decision.
GuruFocus JPM Stats
The GuruFocus JP Morgan summary has some important data and highlights in categories. Those that I have chosen to highlight for their relevance are financial strength/safety, growth rank and value rank. A reader may use the link above to study the GuruFocus summary page in detail.
JPM Financial Strength Summary (GuruFocus)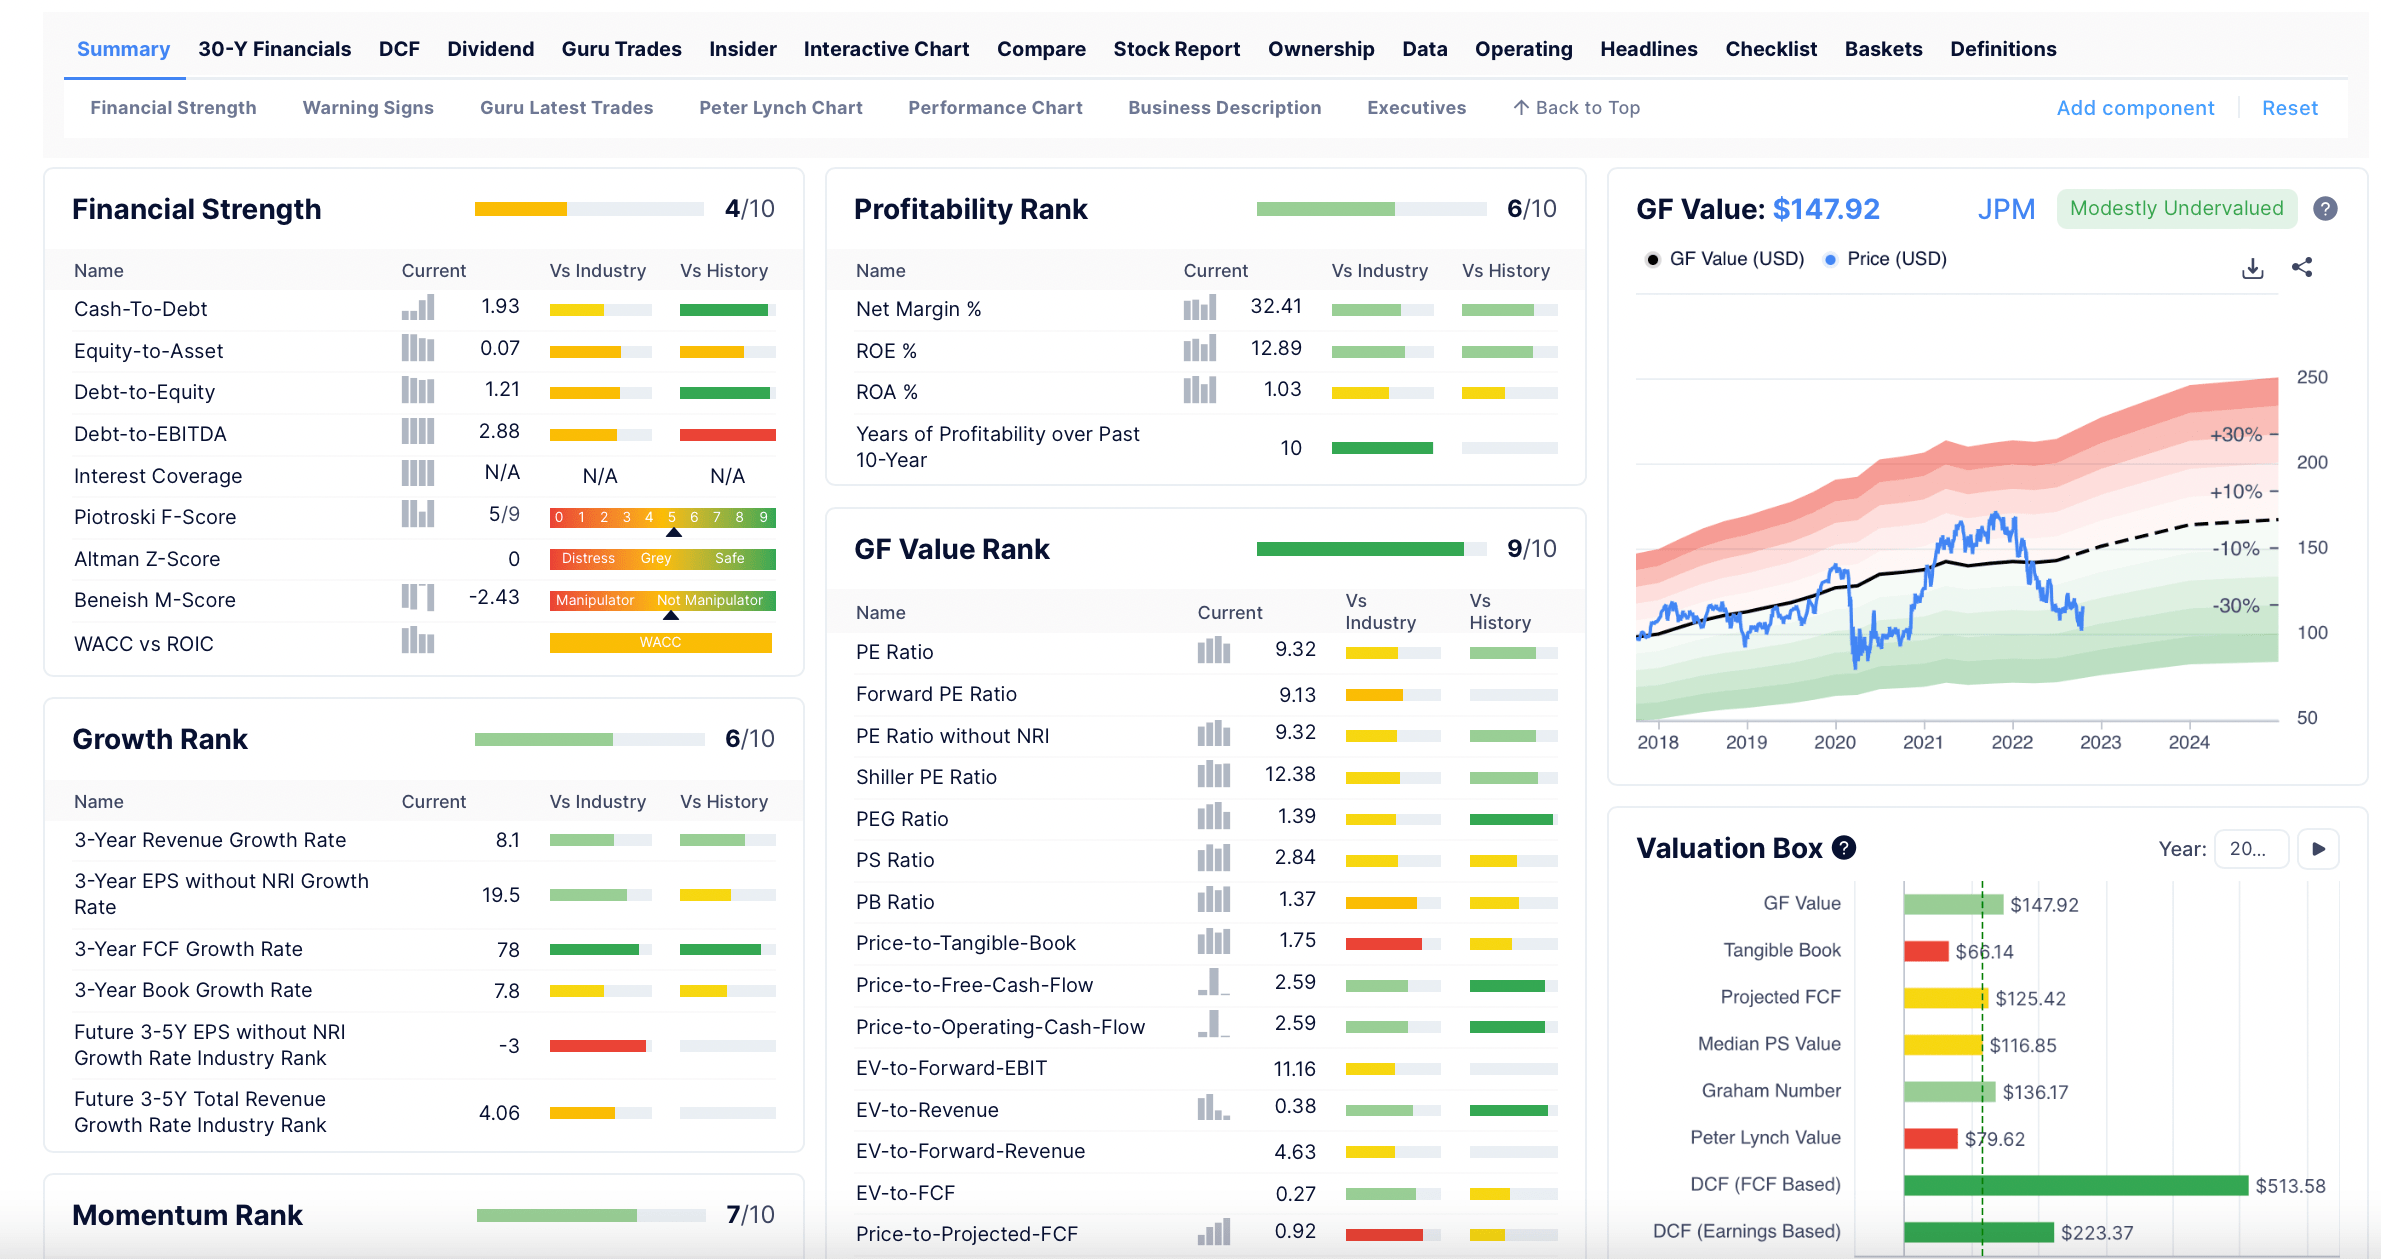
Financial Strength/Safety. JPM scores a middling four out of 10 here. The Piotroski F-score measuring financial strength is middling, as is the Beneish M-score – a statistical model that evaluates whether company earnings might be manipulated. For both of these measures, JPM lands squarely in the middle range.
Growth Rank. Here the company receives a six out of 10. However, an extremely strong point is Free Cash Flow (FCF) growth, a key metrics for how public companies are likely to reward shareholders. JPM receives a 78 of 100 for three year FCF growth.
Value Rank. This is gathered and scored according to a group of very specific metrics on PE, PEG, Price/Sales, Price to Book and Price to FCF and to operating cash flow. Add in various Enterprise Value ratios and Price to Discounted Cash Flow (DCF), and a positive picture of current JP Morgan Value emerges, with a score of nine of a maximum 10.
A View of the Competitive Landscape
Comparing JP Morgan to several well-known competitors provides further context for assessing its position among the large US financial institutions.
Bank of America (BAC)
Bank of America is on a long and successful recovery path from the disastrous acquisitions around Merrill Lynch, an investment bank, dubious mortgage lender Countrywide Financial and poorly-performing MBNA. These decisions hurt the bottom line, required billions in legal/regulatory settlement fee outlays and forced a strategic reconfiguration while dealing with the accumulated credit losses from the acquisitions.
Despite all this, B of A is now a preeminent banking franchise within the US, a top investment bank, a major US credit card issuer and acquirer, a very reputable commercial banking player and has transformed Merrill Lynch into a leading US brokerage/advisory firm.
Bank of America is enlarging scale and scope of its franchises. It has focused on mobile use among customers, has the marketing advantage of data access on many customers, and owns one of the biggest tech budgets among banks.
Scalability is a big deal among large banks, and B of A is in the sweet spot of that factor. The combination of technology emphasis and organic growth as shown in a large increase in financial centers is powerful. Expansion is focused so that products match local demographic/financial profiles. And B of A has kept expenses in check while pursuing this intelligent expansion.
Bank of America is certainly a worthy competitor to JP Morgan in the large financial services sector.
Citigroup (C)
Citigroup is a mixed story. It has struggled with expenses while attempting to build consistent growth year-over year. It has an ambitious revenue increase target of 7 or 8%, and while it does not compete on the level of a JPM or BAC, it offers attractiveness to potential shareholders because current prices are attractive – assuming it continues on path to generally meet its financial goals.
The problem for C is that it must continue to perform consistently to restore the market’s confidence in it. That also requires that Citi overcomes its image problems as well.
C is a major player in trading, investment banking, international corporate banking and credit card operations. It has done best with institutional clients as it enjoys scale and a global footprint in commercial banking and capital market operations. This international presence is a unique selling proposition for Citi, for corporate customers that do much business across national boundaries. Yet this also results in expensive and complex maintenance.
Citigroup has not done well with its markets desk and its consumer units return mixed results, including in the US. Citigroup is selling off many consumer units in the Asia-Pacific units and in Mexico in order to focus on the North American consumer and on global wealth management. Should it work through this shift, Citigroup may emerge as a formidable competitor to JPM and additional top-tier financial institutions.
Wells Fargo
Wells Fargo (WFC) is a bank with a less than storied recent history that has included scandals, abuse of customer accounts, and the abrupt resignation of a CEO after being dragged into Congressional testimony. Recently, and despite a transition to a better present and future, WFC has continued to suffer from operating losses.
Nonetheless, Wells is widely considered to be undervalued in today’s market. The company is in the midst of rebuilding, both fundamentally and in terms of market and public image. It is striving to be more efficient and attempting to grow capital markets share, building its customer credit/debit cards offerings and its advisory group.
The transition that Wells Fargo is undertaking is nonetheless complex. Its strengths include the gathering of customer deposits, where it is third in the US behind JP Morgan and Bank of America, its extensive network of retail branches, and its mid-market commercial offerings. Wells may struggle to reach levels of efficiency and profitability that mark JPM or BAC, but under its new CEO it is on the right track.
Risks
I can think of several risks that may threaten JP Morgan’s success and stock performance.
Potential Cracks in the Moat
The major objective risks are those that might threaten its business/bull cases, including factors or events that could weaken JPM’s fortress-like moat. Core components of the moat include cost advantages and switching costs. If either is dented, cracks might appear in the moat.
JPM’s cost advantages stem from a few factors previously discussed. These include diversity of financial franchises, a leading or near-leading role in each of these compared to competitors, and a set of strong tech resources to underpin large sets of transactions and organic expansion. I do not see indications of looming threats to these cost advantages. About switching costs, the risk level seems correspondingly low. The diversification of franchises and relative low costs of use combined keep most customers with JPMorgan.
Strategy/Continuation Risks
Should JP Morgan fail in some aspect of its corporate and customer strategy, for example, misread the market in a certain franchise or alienate large groups of customers, this might disrupt its steady trajectory. I do not see any evidence that some aspect of overall strategy is either fundamentally flawed or moving in that direction.
A corollary to this risk – or a factor that might promote breaks in the strategy chain – would be a change in leadership. If we call this Key Man Risk and associate it with the departure of CEO Jamie Dimon or other key leaders, I believe it is also low. JPM appears to have a rich bench in its C-Suite, and while Mr. Dimon is very capable and an effective communicator, my suspicion is that his departure would induce short-term pain at most.
Competitive Risks
Additional risks may appear in the sudden improvement of competitors’ positions. We have surveyed a few key competitors. Though each appears to be on a positive path, none are likely to produce the kind of stunning, sustained results that will threaten JP Morgan’s overall sector dominance.
Summary
I am very positive on JP Morgan as a company in which to buy an appropriate ownership stake. As Mr. Buffett has said often, this is what buying shares in good businesses is about, along with holding those shares for a sustained period of time unless and until a story demonstrably changes for the worse.
In my view, JPM qualifies for such a designation. I am long JPM shares and think it is a prime candidate for a financial holding within a diversified investing portfolio.
Disclosure: I/we have a beneficial long position in the shares of JPM either through stock ownership, options, or other derivatives. I wrote this article myself, and it expresses my own opinions. I am not receiving compensation for it (other than from Seeking Alpha). I have no business relationship with any company whose stock is mentioned in this article.