Summary:
- Not every investor can pick 10-baggers like Peter Lynch, but there are some proven and repeatable rules that can help.
- This article examines Meta Platforms, Inc. as a fast grower using Lynch’s guidelines.
- Besides other commonly analyzed financial metrics, its inventory (rather, lack of inventory) is a key competitive advantage.
- Meta Platforms’ PEG is a bit above the 1x ideal Lynch pick. Although the premium is quite mild (my estimate is ~1.2x) and totally justifiable.
shutter_m
Thesis
Peter Lynch is renowned for his ability and success in identifying 10-bagger stocks. Not every investor has such talent and ability. However, there are some proven and repeatable rules that can help. Lynch’s book, “Beating the Street,” outlines his approach. He categorizes stocks into six groups (ranging from stalwarts to turnarounds to fast growers) and summarizes their typical traits. Lynch’s favorite category is, of course, fast growers. While fast growers offer the potential for significant gains, they also carry higher inherent risks. Lynch, therefore, provides some criteria for identifying these growers and controlling the risks.
And this leads to the main thesis for today. In this article, I will examine Meta Platforms, Inc. (NASDAQ:META) as a potential fit as a fast grower using Lynch’s guidelines. In particular, I will examine the following three criteria and argue why it is:
- META is a dominant player in the rapidly expanding digital marketing space, therefore is well-poised for significant growth in the next 3~5 years ahead.
- One of Lynch’s key insights is inventory, an indicator that most investors ignore. Although inventory is one of the most reliable and telling indicators of a company’s business and overall health. And I will explain why META inventory (rather, the lack of inventory) is a key competitive advantage.
- Finally, the famous Lynch PEG ratio. For valuation, Lynch prefers a PEG ratio (P/E to growth rate ratio) of around 1x for the fast-grower category. And you will see that even though META’s PEG ratio is not as low as 1x, it is getting quite close (about 1.24x from my analysis).
1. A leader in a fast-growing space
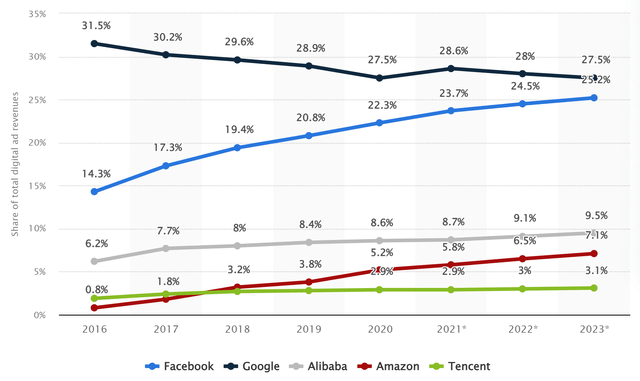
There is not too much to be said about META’s dominance in the digital ad space (see the chart below). The duopoly of Google (GOOG) and META has been absolutely dominating the space and leaving everyone else far behind.
In the case of META, it has a massive user base of close to 3 billion monthly active users across its various platforms (Facebook, Instagram, Messenger, and WhatsApp). This not only gives the company a vast audience for targeted advertising, but also a humongous database to further improve its targeting accuracy and monetization. META has sophisticated algorithms and tools that allow advertisers to target specific demographics, interests, and behaviors of its users. This enables advertisers to create highly targeted and personalized ad campaigns, which can result in higher engagement and conversions. And its data-driven approach constantly analyzes new user data to further optimize ad delivery and targeting.
In the meantime, the digital ad space has been and is projected to continue growing at a rapid pace (see the next chart below). To wit, the 2023 digital advertising market is expected to increase by 13.1% from the $602.25 billion spent in 2022. In terms of absolute market size, the digital advertising market just crossed the $600 billion mark in 2022. It is expected to reach $756.47 billion in 2024, over $800 billion in 2025, and $876.1 billion by 2026, representing a 68.2% overall increase from 2021. By 2026, digital ad spend is predicted to make up 73.6% of overall media ad expenditure, i.e., about three quarters. Our societal shift toward the digital age is unstoppable and irrevocable.
And next, we will see why META is well-poised to capitalize on such a megatrend.
Source: Digital Ad Spend (2021-2026) by Oberlo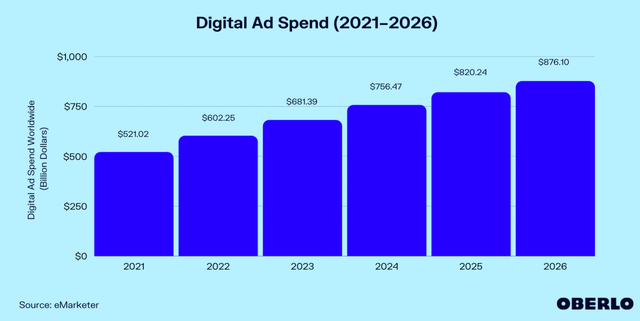
2. Inventory
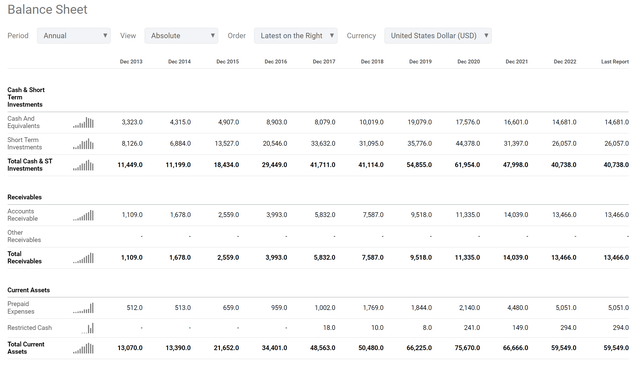
There are many ways to analyze the health of a business, and most of them have been applied to META already. Here I will focus on the use of its inventory, or rather, the lack of inventory (see the next two charts below). Examining the inventory is one of Lynch’s key insights into evaluating a business because it is one of the most reliable, easily obtainable, and less ambiguous pieces of financial data. Yet it offers a wealth of valuable information, ranging from the level of demand for the company’s products, the effectiveness of its just-in-time inventory management, seasonal fluctuations, supply chain disruptions, and production constraints.
And the inventory picture for META is really simple – it doesn’t have any (or more precisely, it has a negligible amount of inventory compared to its other balance sheet items). For readers unfamiliar with the financial statements, inventory is typically considered a current asset and would show up in the current assets section on the balance sheet. And see, META has none of it. And the ability to run and make money without the need to maintain an inventory is a key competitive advantage in my view. It eliminates impacts from all the factors mentioned above. In contrast, you can see a more manufacture-oriented business like Tesla, Inc. (TSLA) has to maintain a sizable inventory (on average about 79 days) and is subject to supply chain disruptions and production constraints. Even Apple Inc. (AAPL), run by Tim Cook, an operation guru, is still subject to these impacts (and also seasonal fluctuations).
Thanks to its unique business model and technological lead, META is simply free from all these issues related to inventories. Furthermore, maintaining an inventory inevitably ties up cash that could be used for other things. Without inventory tying up capital, META has more cash to invest in growth.
Source: Seeking Alpha data Source: Seeking Alpha data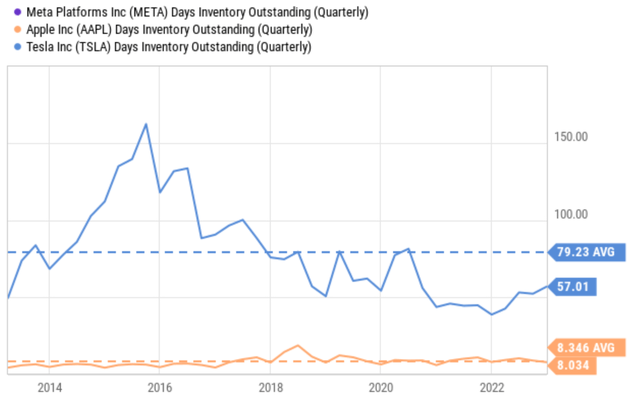
3. The Lynch PEG ratio
Finally, onto valuation. META’s current PEG ratio is not yet as low as the ideal 1x Lynch pick. However, my estimates, which are based on the data summarized in the 3 charts in this section, show a current PEG ratio of around 1.2x only. And I consider it close enough to the idea 1x considering its wide moat, dominance, and the growth potential of its space as analyzed above.
To wit, my analysis started with an FWD P/E ratio of 21.4x according to Seeking Alpha data, as shown in the first chart below. In terms of growth rates, its EPS has grown at a rate of 40.5% over the past five years. And consensus estimates predict annualized EPS growth rates of 16.8% in the next 3 years, from an EPS of $9.6 in 2023 to an EPS of $15.3 in 2026. Based on this projected CAGR, its PEG ratio would be about 1.27x as shown in the 2nd chart below. It’s worth noting that META currently has a net cash position of $40.7 billion on its balance sheet, equivalent to about $5.62 per share. If we subject the cash from its price, its P/E ratio is slightly lower (around 20.8x FWD) and its adjusted PEG ratio is also slightly lower (about 1.24x).
Source: Seeking Alpha data Source: Author based on Seeking Alpha data Source: Seeking Alpha data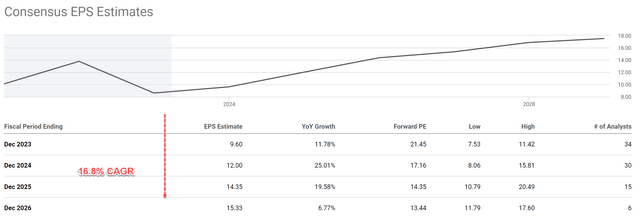


Risks and final thoughts
META faces several key risks in the longer term. META operates in a highly competitive market, and there is a risk that new entrants or existing competitors could gain market share, reduce profitability, or impact pricing. Some strong contenders that could challenge META and Google’s dominance in the digital ad space include Amazon, TikTok by ByteDance, and even streaming services like Netflix (NFLX). META is also vulnerable to changes from other platforms such as Apple’s iOS14 update – that is, more vulnerable than Google. META monetization relies on users’ consent for tracking on their devices, while Google depends on users’ search terms to reveal their intent. Besides competition, government regulations, particularly with regard to privacy, could impact META’s business operations.
To conclude, I view the above risks have been fully priced in already for Meta Platforms, Inc. stock. As detailed above, META now is a good fit for Peter Lynch’s criteria as a fast grower at a reasonable price. It is a scale leader in a rapidly growing space. It enjoys sustainable and critical competitive advantages as indicated by the size of its user base, no need for inventory, and also a strong balance sheet (even by the FAAMG standard). While its PEG ratio (~1.2x) is a bit higher than the ideal 1x, the premium is relatively mild and can be justified by its technological lead and growth potential in disruptive areas (such as AI and VR) that are not captured in the consensus estimates.
Disclosure: I/we have a beneficial long position in the shares of AAPL either through stock ownership, options, or other derivatives. I wrote this article myself, and it expresses my own opinions. I am not receiving compensation for it (other than from Seeking Alpha). I have no business relationship with any company whose stock is mentioned in this article.
As you can tell, our core style is to provide actionable and unambiguous ideas from our independent research. If your share this investment style, check out Envision Early Retirement. It provides at least 1x in-depth articles per week on such ideas.
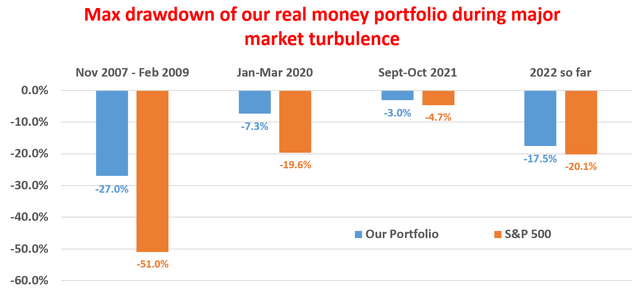
We have helped our members not only to beat S&P 500 but also avoid heavy drawdowns despite the extreme volatilities in BOTH the equity AND bond market.
Join for a 100% Risk-Free trial and see if our proven method can help you too.
